
Published Date : April 6, 2017
In previous post I have explained how to import data into Azure ML environment. In this part,I will show how to do data cleaning, data transformation in Azure ML environment.
The second step in machine learning process is bout collecting (Part 2), cleaning and loading data (current part).
Azure ML has different components for data transformation (see below image ).
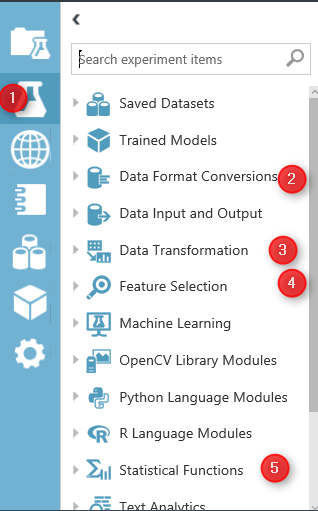
Image 1.Azure ML Data Manipulation and Transformation.
In azure ML studio, click on the Azure Experiment component (image1.1). there are different type of components that can be used for different scenario of data transformation.
in this post I will talk about “Data Transformation” (Image 1.3) component and in detail data manipulation. this component has many thing that help us to transform data, clean data and so forth.

the main part that can be used in most of Machine Learning experiments is “Manipulation” . in the below image you will be able to see the different components

Add Columns
Add Columns is one of the primary type of data transformation that help you to combine two datasets. For example, imaging we have a dataset about weather Humidity and another one about the weather temperature.

there are in different data set and you want to combine them.
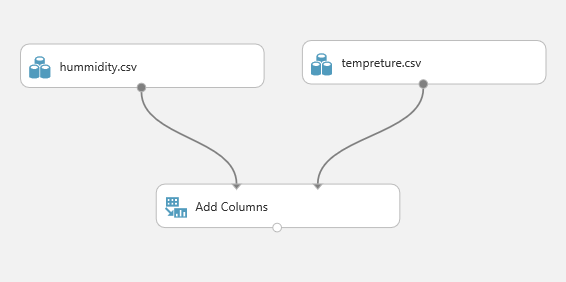
The first step is to drag and drop these two data set into the experiment area. Then connect them to the “Add Column” module (see above image).
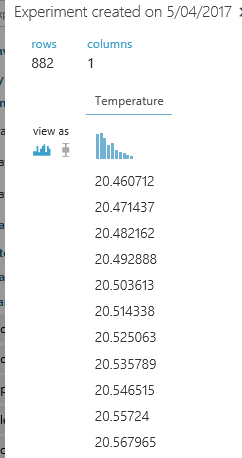
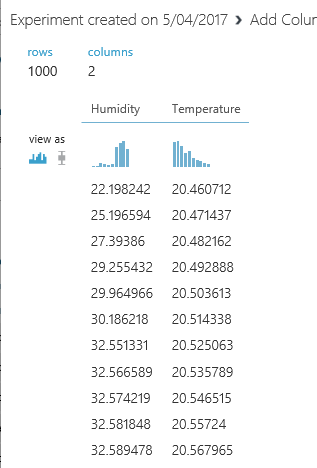
if just right click on the node bottom of the module “Add Columns” you will see that we have a dataset that have both Temperature and Humidity data in once palce.
Add rows
This component helps us to add combine rows that we have in a dataset, or combine the evaluation results. Imagine that we created an experiments that run two machine learning, we want to compare and show the result of evaluation for each of them.
I am going to explain this component via an existing Experiment in Sample experiment in Azure Ml studio. To start, click on the experiment option (below image), then click on the sample option (number 2), then in the search area type the “Binary Classfication: Credit risk prediction” and just click on the sample to open it.

when you open the sample do not freak out! I will talk about all other components in this experiment later in Machine learning parts. just click on the Run at the bottom of the page and just look at the “Add rows” and evaluation models components.

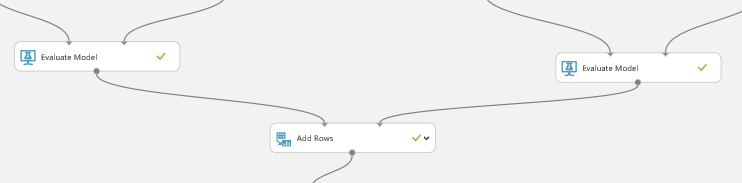
as you can see in below image, we have two “Evaluate model” components (will talk about it in Machine learning part).
First, visualize the “Evaluation Model” component by right clicking on the node at the bottom of the component (See below image).
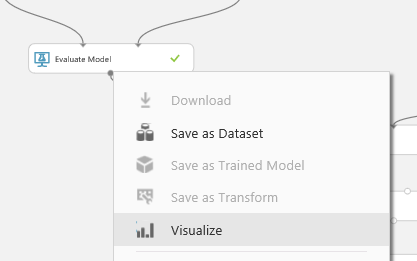
Then click on the “Visualize” option (above image). and you will see the evaluation result page. just scroll down to reach the text part of the evaluation result as below. This component show the accuracy of the model to us with charts and numbers. However, in add rows component only the numbers and data will be shown.

However, the node “Evaluation Model” has some also data output, to see just data not the graphs, I am going to drag and drop another component to model name as “Convert to Dataset” as below. I just did this to show you the real data that will pass to the “Add Rows” component.
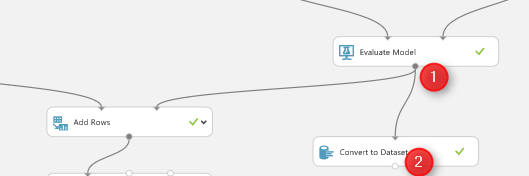
just connect it to the evaluation model and then right click on the bottom of “Convert to Dataset” component to visualize the data (see below picture)
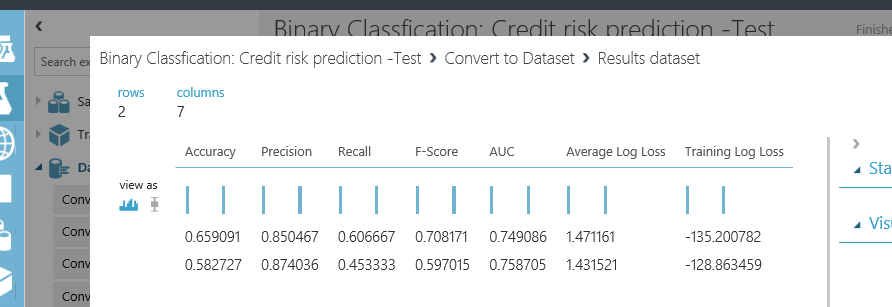
we have the same for other “evaluation model” component as below
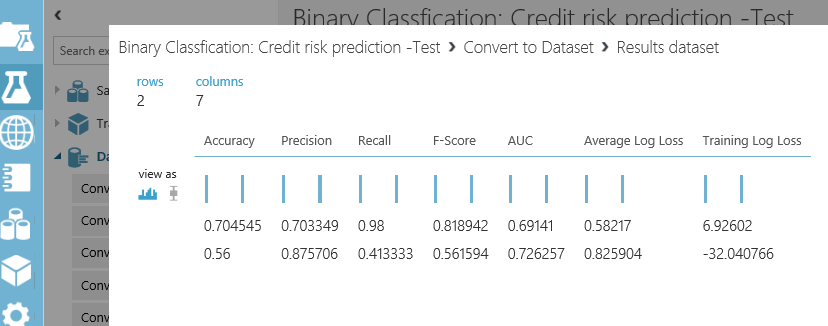
“Add Row” component will merge these information. As you can see in above picture, the row data of the “evaluation model” is just 2 rows with 7 columns. that each of them try to explain the accuracy of model to end user. we want to compare the results of these two algorithms with other ones. Hence,to see the results, just right click on the bottom of the “Add Rows” component, then click on the “Visualize” option.
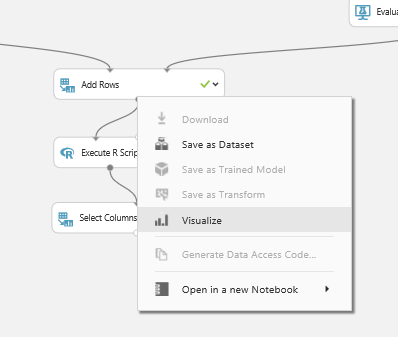
the below picture shown to you. as you can see “Add Rows” has merged these data in one place

and we able to compare the result together. I will talk about the evaluation model later in Machine learning part.
In Next post I will talk about the other component for data transformation.
Published Date : March 28, 2017
In the previous post, the main concepts of Machine Learning has been explained very briefly. However, if we want to talk about Machine Learning, it needs to read a whole book. In the second part, I am going to show the main Azure ML environment and its essential components.
Azure ML has two type of subscriptions: Free, and Standard.
In this post I am using free subscription. The extensively explanation of the Standard subscription will be explained in last part of this series.
To sing in to the Azure ML portal, you can use any of your email account: Gmail account, Microsoft account, or company email.
using this URL to log in to azure Ml studio: https://studio.azureml.net/
First, you should login to the signing page as below
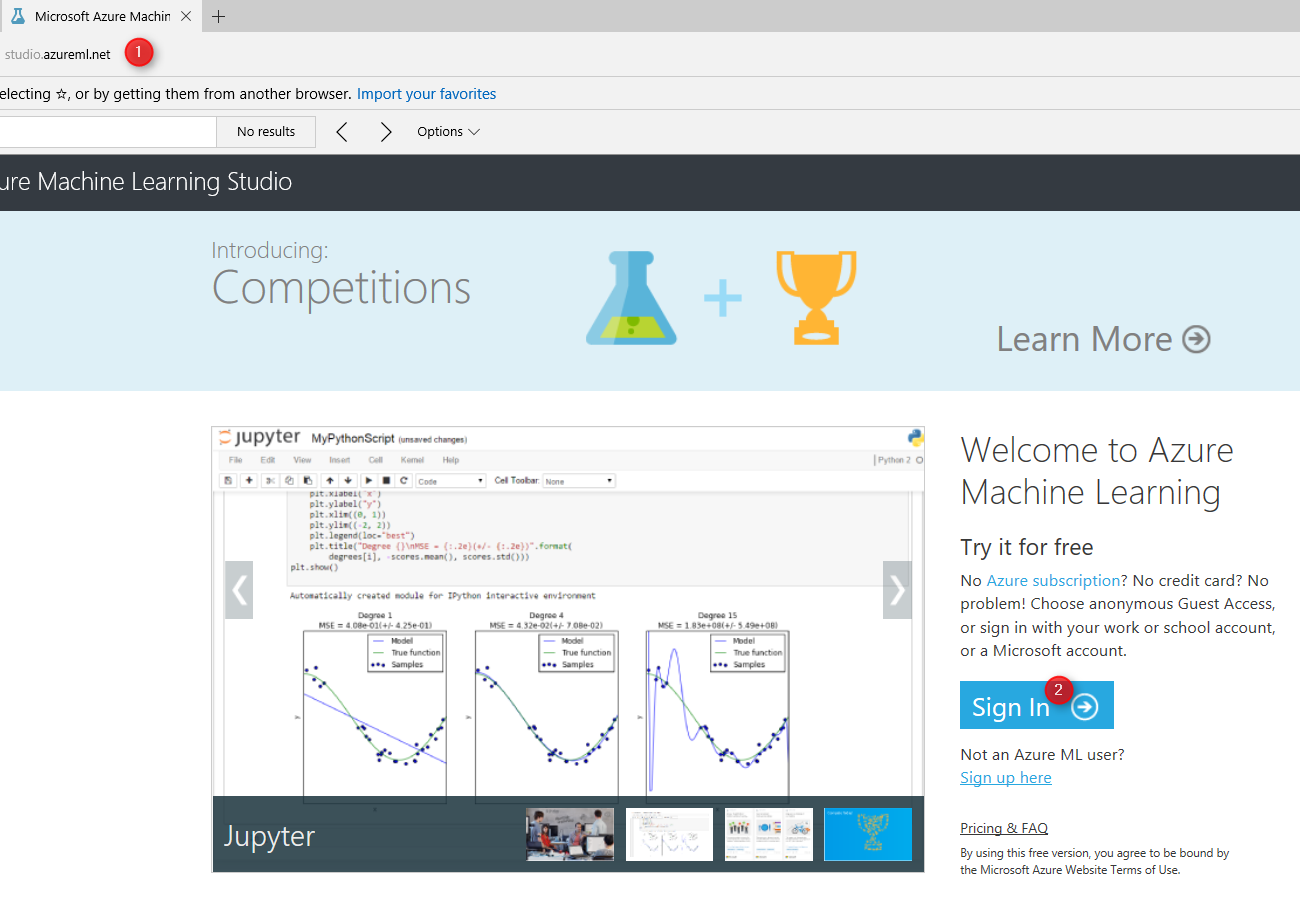
image 1. Login Page
Then, after sign into the azure portal, you will see below page. Azure ML studio has different components. The first component is “Experiments”. experiment is the first place that we will use for creating a machine learning project (number 1). to Create a new experiment, we have to click on the “New” icon in the bottom of the page. The list of created experiments will be shown in middle of the page (Number 3). if you want to delete an experiment, you first should select it, then click on the “Delete” icon (number 4). Moreover, for copy specific experiment, just select it and then click on the “Copy experiment” icon (number 5).
In the left side of the window, we have other components such as “Web Services”, “Notebooks”, “Datasets”, “Trained Models” and “Settings”.
“Web services” is a place that the created web services will be shown there and you able to see them (I will explain the process of creating web services in the next series). Also we have “Notebook” component, for Python users (number 7). The imported dataset and new datasets will be accessible via “Datasets” icon (number 8). Moreover, the “Trained Models” also store the created models that we can use in other applications (will explained it in the next parts). and finally, “setting component” that help us to arrange the environment.
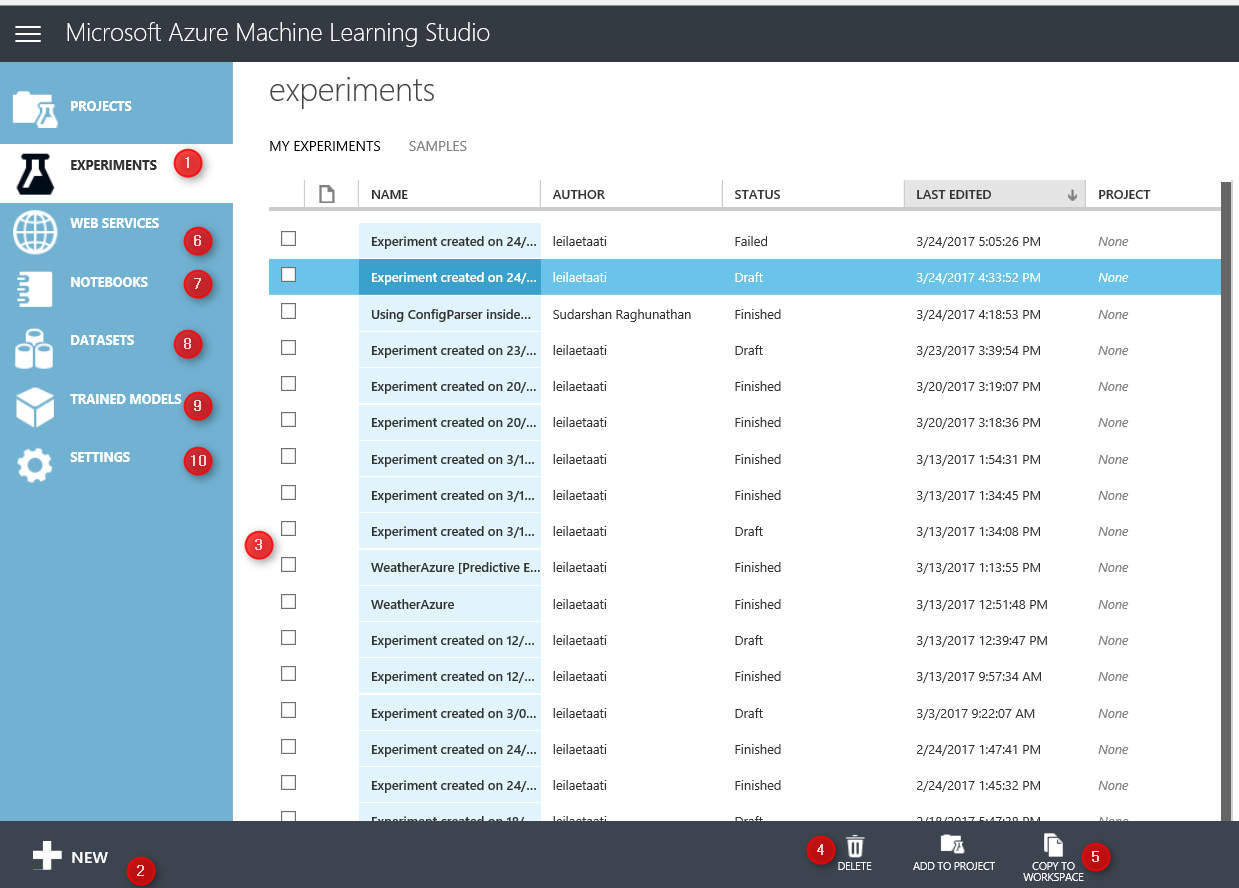
Image 2. Main Page
In this series I will talk about “Experiments”, “Datasets”, “Web Services”, “Trained Models”, and the “Setting”.
In this post, we first look at the “experiment”. In the experiment, we able to create a new Machine Learning Module. In experiment area we have a drag and drop environment, that we able to put items from menu in the left side to the middle of screen (Number 1). Moreover, we able to put some more description about the experiment we are creating in the right side of the screen (number 2). Each Experiment could have specific name on top of the page (Number 3) that has been assigned by user. All the main components and tools for creating a machine learning module have been put in the left side of the screen (Number 4). We also able to “Save/ Save as” the component (number 5). Finally, after creating model, we can “Run” the experiment.
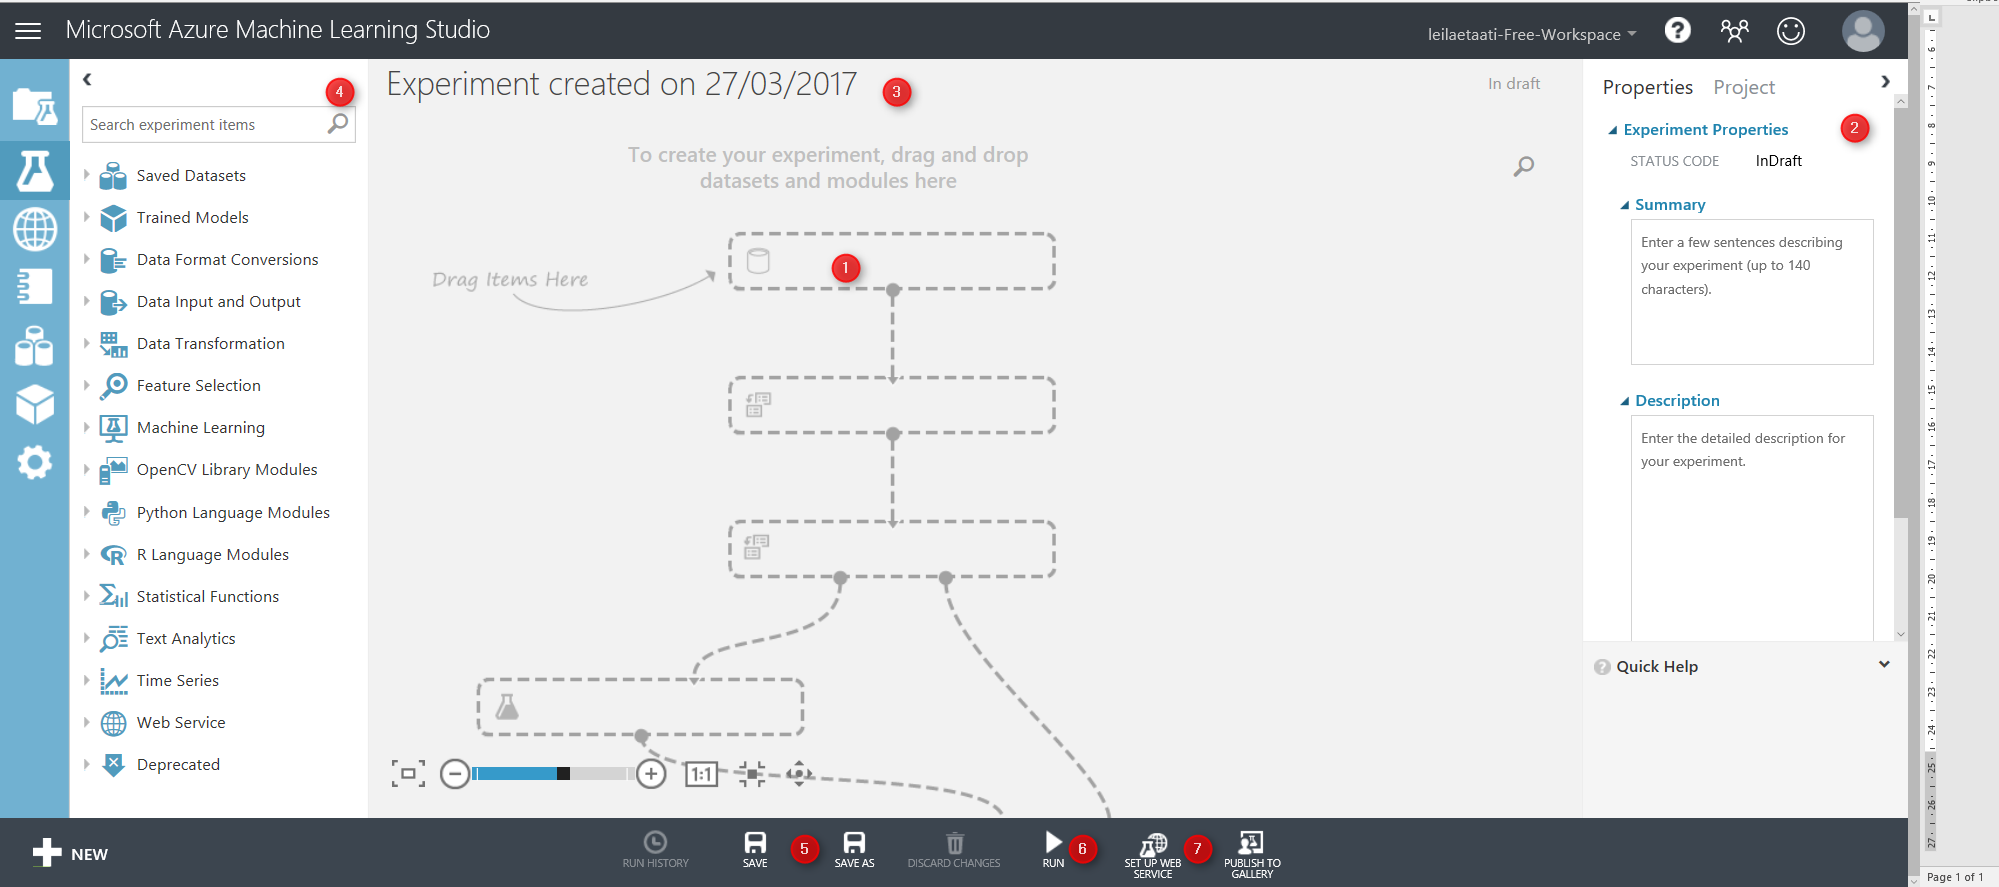
Image 3. Experiment
According to the Part 1 of this series, the first step after identifying the business problem, is about data gathering, data cleaning, data filed selection and splitting data.
to start a machine learning process, we have to get data first from resources.
There are couple of options to fetch data.
1. Import Data set
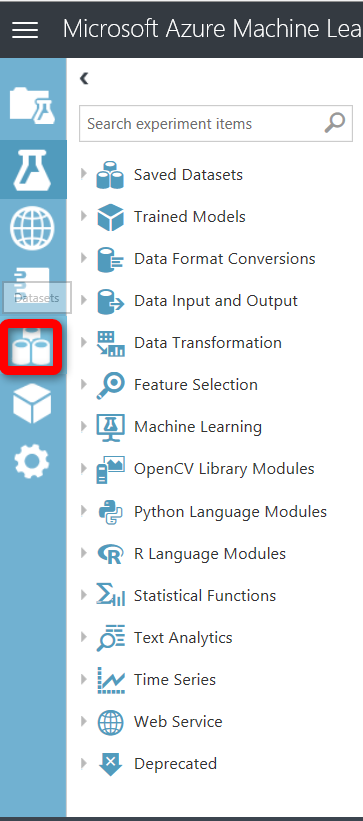
first approach to import data, first click on the “database” icon on the left side of the screen
then in the Data set window, first click on the data set icon in the left side (Number 1), then on the “New” icon on the bottom of the page.
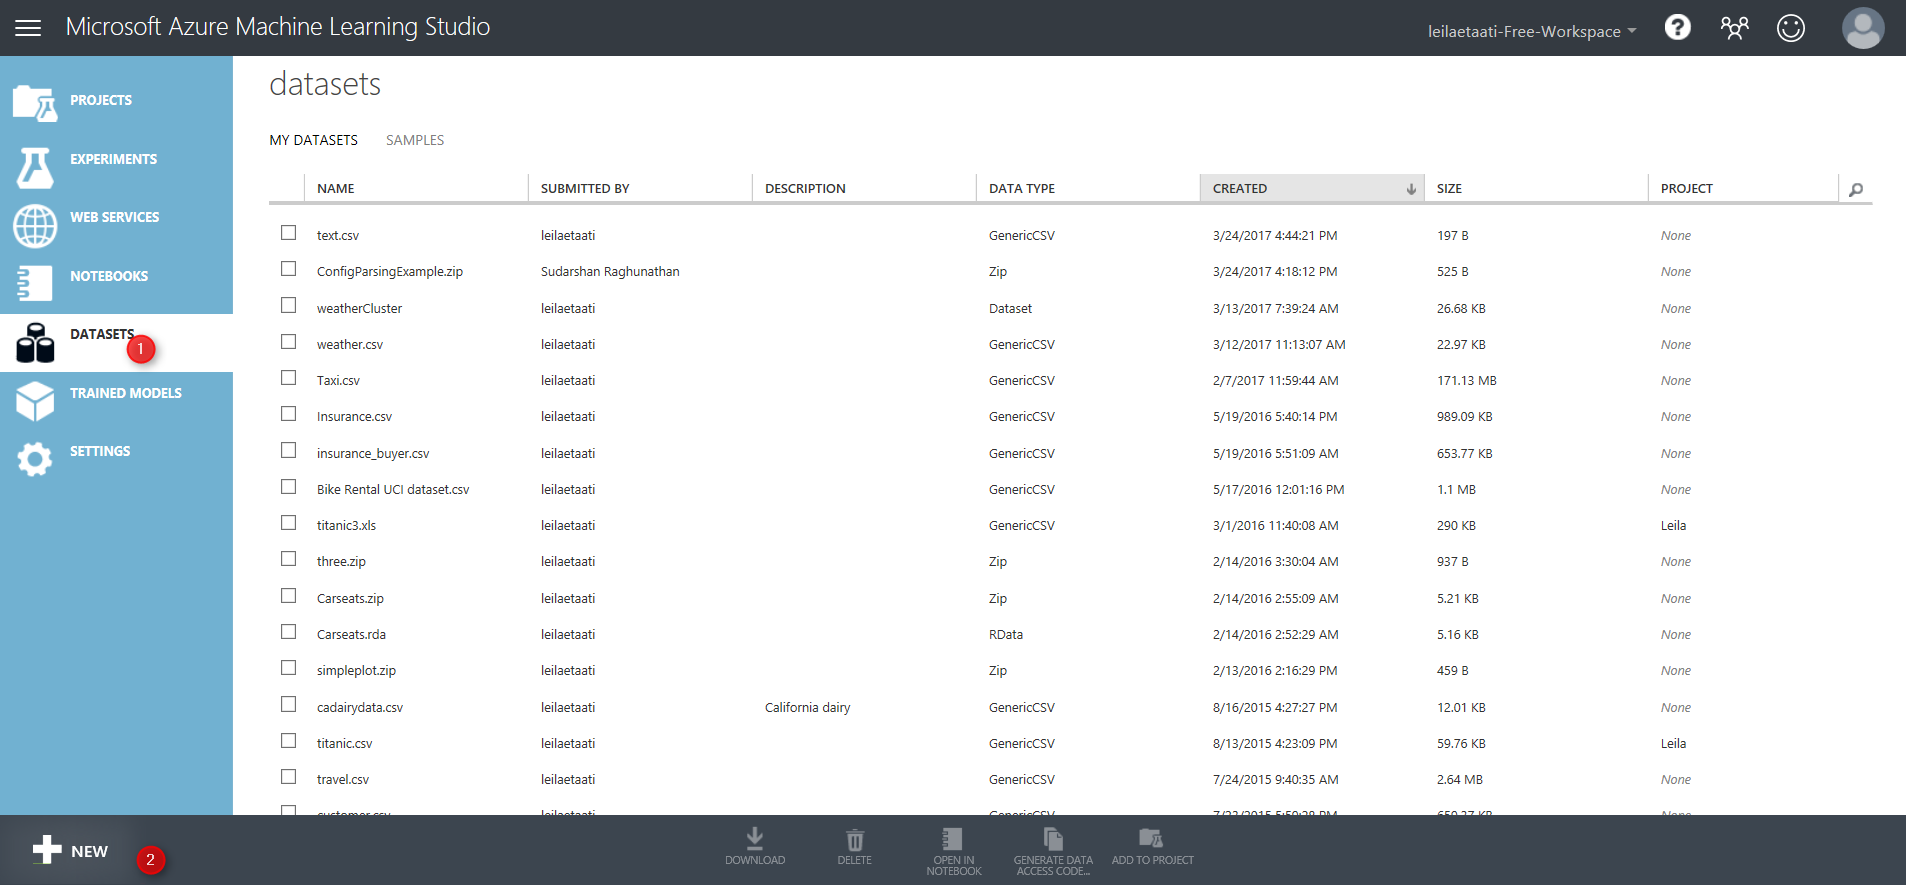
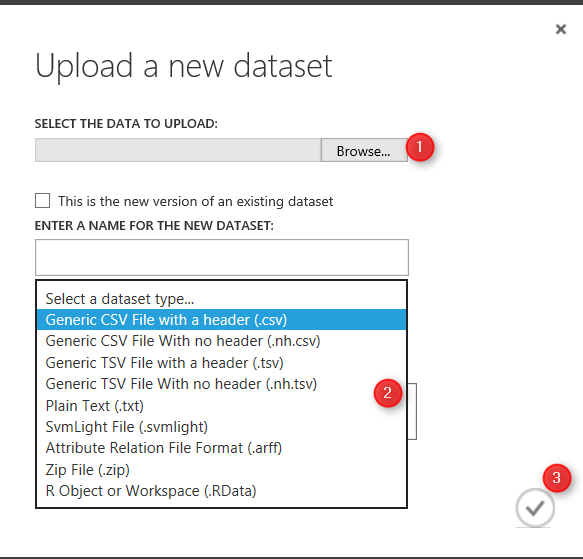
Then, below windows will be shown up. To import the dataset from your local pc, you should click on the “dataset” icon (Number 1), then click on the “From Local File” icon (Number 2)

Then, you able to upload a new data set into the Azure Ml experiment. Just brows your pc to select the data set. There are some limitations on data set type as just able to import directly from local pc just : CSV, TSV,TXT, ARFF, Zip and Rdata data types.
After selecting datatype (number 2),just approve it (number 3). You will able to see the data set in the Azure ML environment.
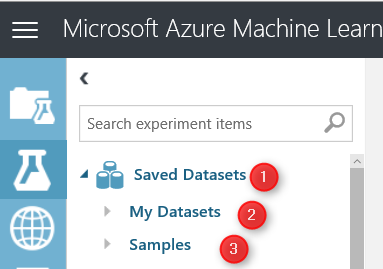
In the azure Ml experiment area, you will see a “Saved Datasets” icon, also under the “My Datasets” you will find uploaded data set. However there are some predefined data set in the system as Microsoft provided them for users (Number 3).
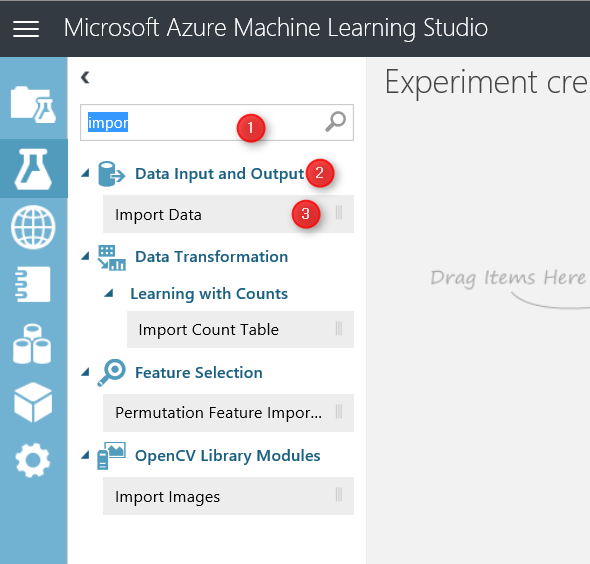
Importing data from local pc is not the only way for importing data, the other way is using component “Import data”. just type word “import” in the search bar in number 1. you will see under the “data Input and Output” component, we have a module name “Import data” (Number 2 & 3). Just Drag it and drop it in the middle of the screen in Experiment area (Number 4)
After putting Module ” Import data” in the experiment, we able to identify the main source of data from variety resources in the cloud and web resources (see below image)
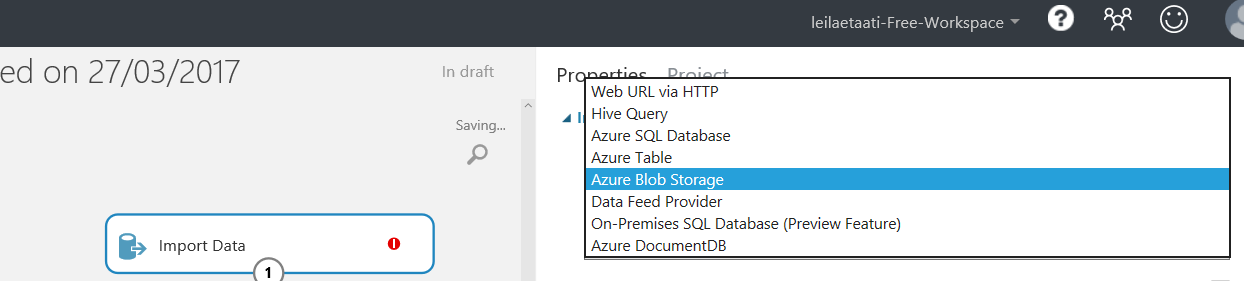
By using “Import data” you able to get data from different resources as has been shown in above image. many of them are part of Azure Cortana suite (Azure Blob, Azure SQL DB, Azure doc, and Azure Table) however there is possibility to import datasets via web url(first option) or from a web service (data feed provider).
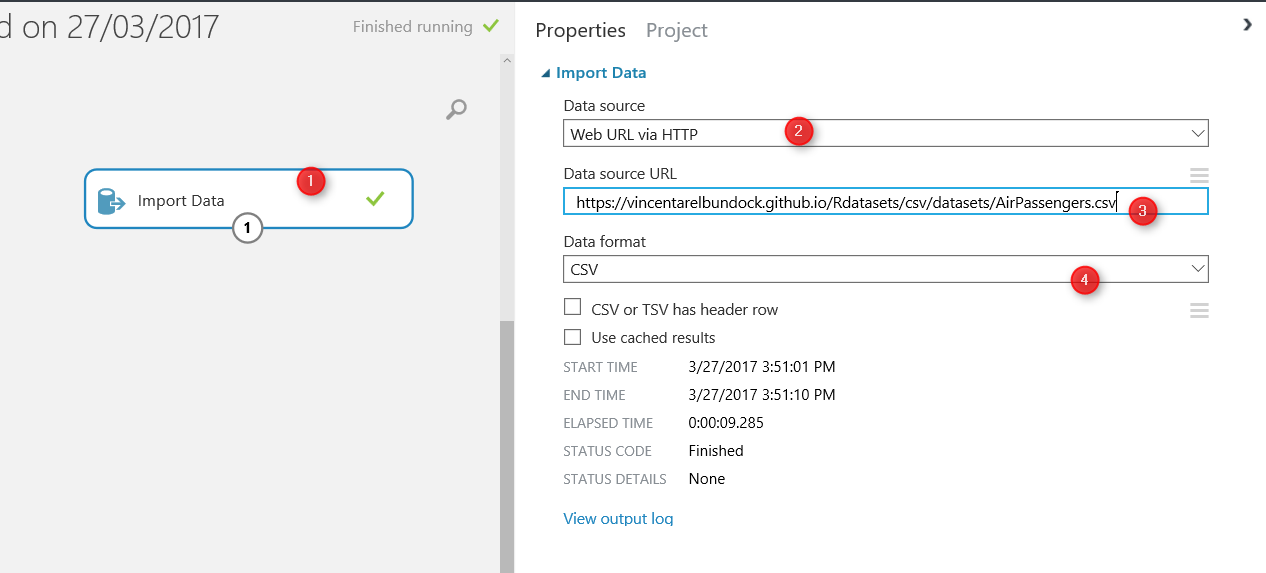
For example, I want to import data from a web url : https://vincentarelbundock.github.io/Rdatasets/csv/datasets/AirPassengers.csv. This a CSV file.
First, I click on the Import data module, then in the “data source” I will choose ” Web URL via HTTP” (number 2), following, in the front of the “Data Source URL”, put the web link url . Finally, in “data format” identify the data format as csv (or other format). Then just run the experiment.
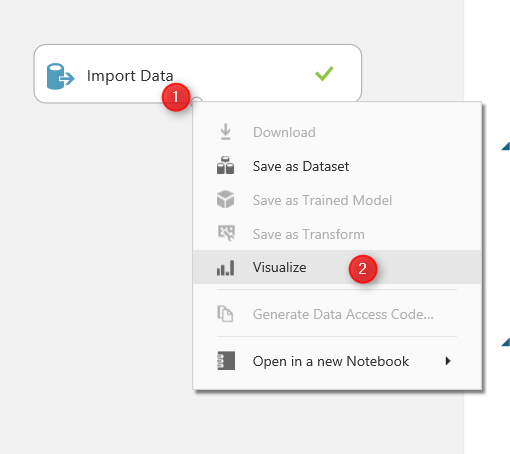
After, Running the experiment, you will see a green correct sign will be appear in the front of the module, which shows that we correctly able to import data from web. now by clicking on the node at the bottom of the module (number 1) and then clicking on the “Visualize” option (number 2) you will see the imported dataset.
Imported dataset, has 145 rows (number 1) and 3 columns (number 2). Also, the detail of data has been shown in the middle of screen. Finally, a description of data both from statistic view( number 4) and from visual aspect(number 5) are shown in the right side of the screen. 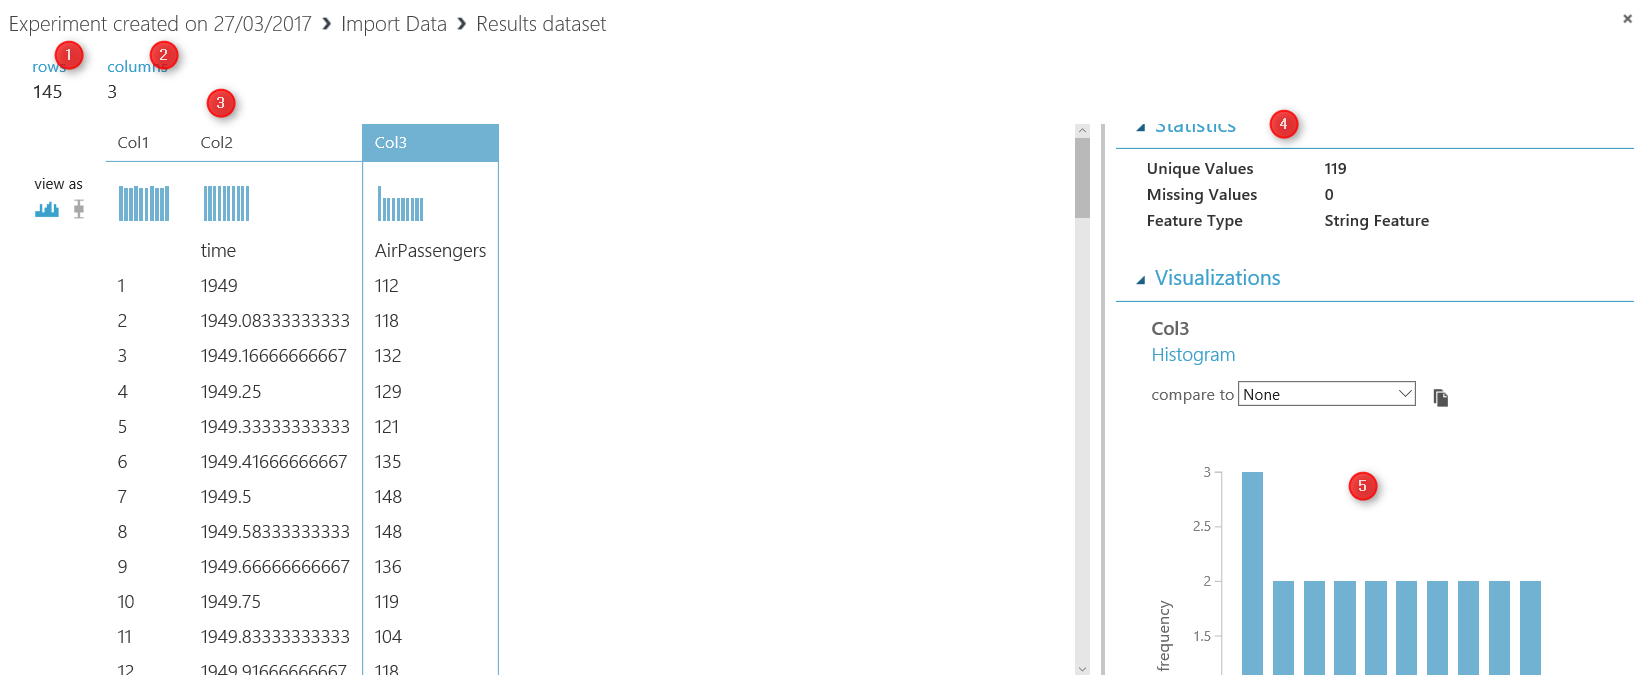
I thought these are the main approaches for importing data into Azure Ml. According to machine learning process (Part1) after identifying the source data there is a need to do data wrangling in Azure ML. Hence, in the next part I will explain how to use Azure ML different components for data wrangling.
Published Date : March 27, 2017

In this series, I will talk about Microsoft cloud machine learning: Azure ML. I will explain the main components and concepts of Azure ML. In the first post, I will talk about the Machine Learning concepts and Azure ML.
What is Machine Learning:
Machine learning according to Wikipedia is:
“subfield of computer science that gives computers the ability to learn without being explicitly programmed“
The main concept comes from learning from data and then for new series of data, predict based on the past data behavior.
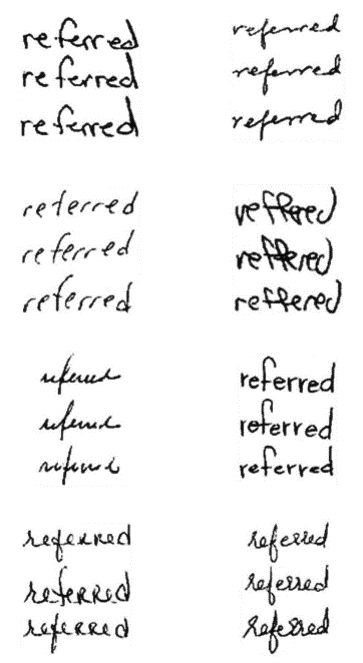
The best example is: hand writing recognition in a Post Office.

Computer will be feed by many different handwriting styles. For instance for the word “Referred” we may have different ways of writing it (see below image). A machine learning program will learn from all different writing styles, then in the new set of data, it should be able to distinguish it. So computer program will learn that the word “referred” can be written in different ways. Hence, for future letters, computer program will be able to distinguish different variation of writing “referred“.
Moreover, machine learning is a new trend in BI. Before this era, we mainly focused on “What is happened”, “Why is happened”, or “What is happening now”. The new trend that we looking at is :”What will be happen” and “How to make it happen”
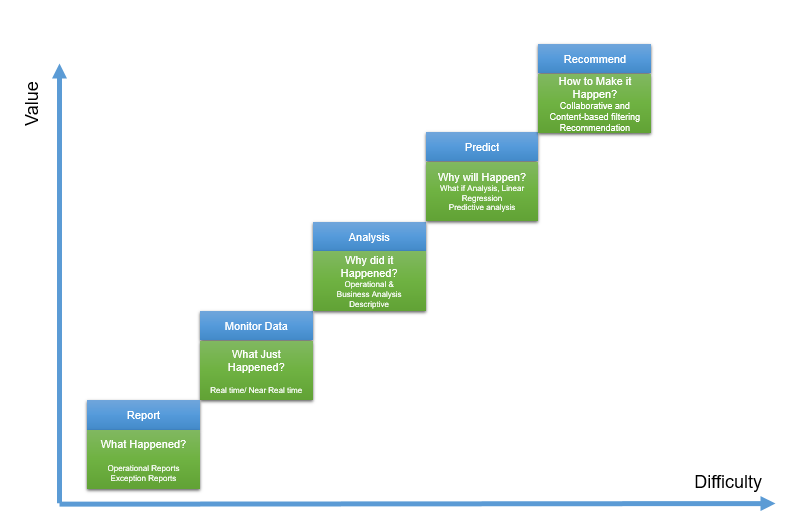
The first level (What happened) has been used for many years in BI systems. Which is about checking what happened in the past without any level of analytics, while the second level fetchs the same data, but it will look at the real time or near real time data. It can be an example of internet of things. In the third level, the main aim is to see “why it happened” so we focus is on what if analysis.
The fourth level mainly is about the “What will happen” which machine learning will be used here. it is not an easy task but it worth the effort especially for future decision making. Finally, the last part is about the Recommendation, that based on the specification of customers what action/products/ so forth good for them.
For the first and the third level we can use BI tools such as Microsoft Power BI. the good example for second level is “IoT” or using “Gateways” in Power BI.
However, the main aim of current series is more on the fourth and the fifth level of analysis which is predictive and prescriptive analytics.
Machine Learning Cycle
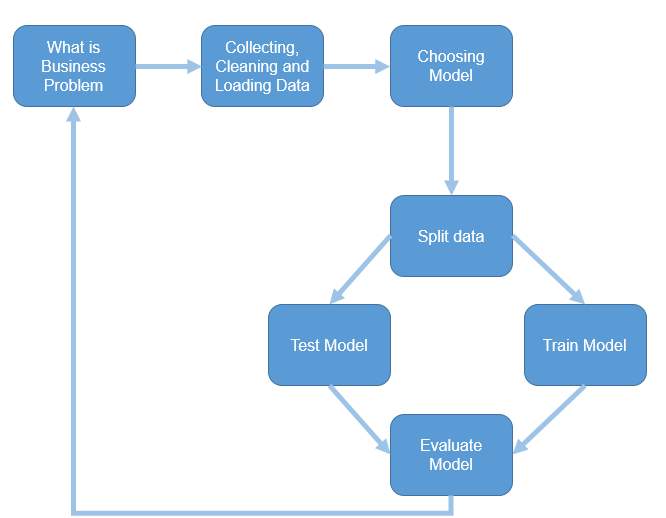
To do machine learning, we should follow specific cycle as below:
The first step is to identify the business problem such as : sale prediction, customer churn and so forth. The next step is about the identifying the relevant data, what attribute has more impact on problem, gather data, clean data and load data. In the second step, ETL process may be applied. Finally, after gathering data and data wrangling, we have to choose the relevant algorithm based on the problem nature (will be explained later in this series). Finally, we split data some part for training model and some other for testing the mode. model will learn from the past data to better predict the upcoming data. Then, we evaluate the created model and deploy it.
In some cases, the model evaluation is not satisfactory, hence we have to reconsider the business problem, collect other data or choose other model.
This process applies for any other machine learning platform.
Azure Machine Learning
Azure ML is a cloud machine learning platform. It is part of Cortana analytics suite. Azure ML make the process of creating predictive, descriptive and prescriptive analysis much more easier.
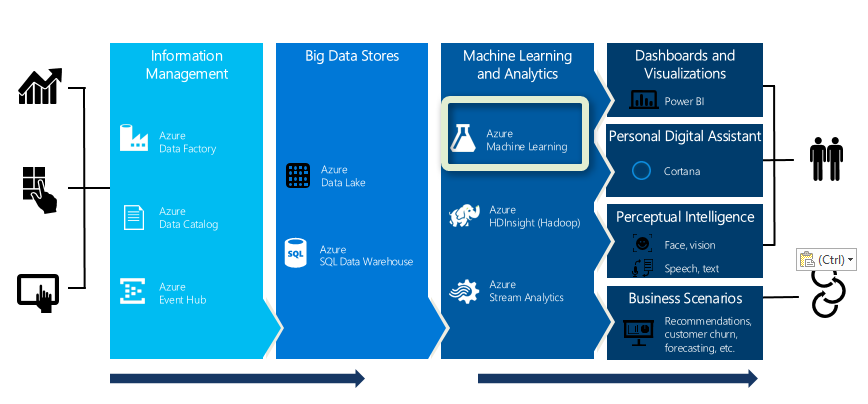
Azure ML is in “Machine Learning and Analytics” part of Cortana.
The main specifications of using Azure ML are as below;
and so many others.
In the next post I will show the Azure ML environment and its main components.
Published Date : March 10, 2017
In previous posts (part 1 and part 2), I have explained the process of data live streaming. In the first post, I have explained the process of setting up the Raspberry PI 3 and Weather station. In the second one, I have explained the process of setting up the Event Hub that helps us to. In this post, I will explain the process of creating and setting up the Stream Analytics.
What is Stream Analytics?
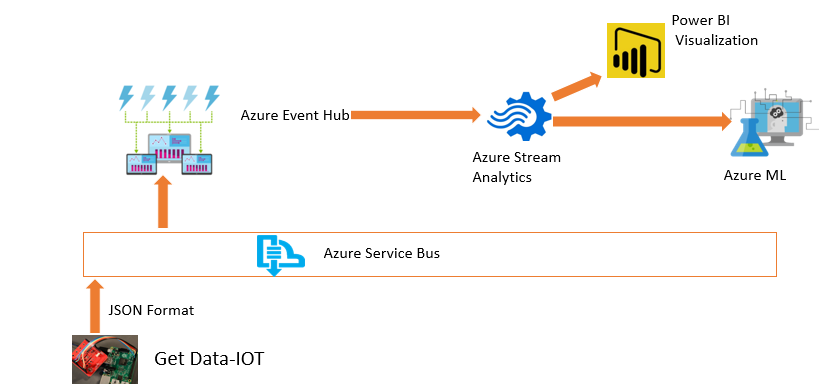
Stream Analytics is an event processing engine, which helps to send data from Event Hub to Power BI and Azure ML.
In this post I will explain how to use Stream Analytics to see live data in Power BI.
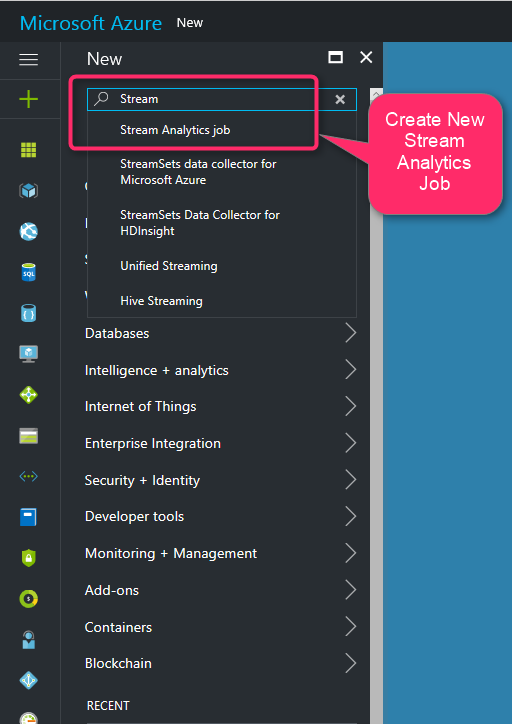
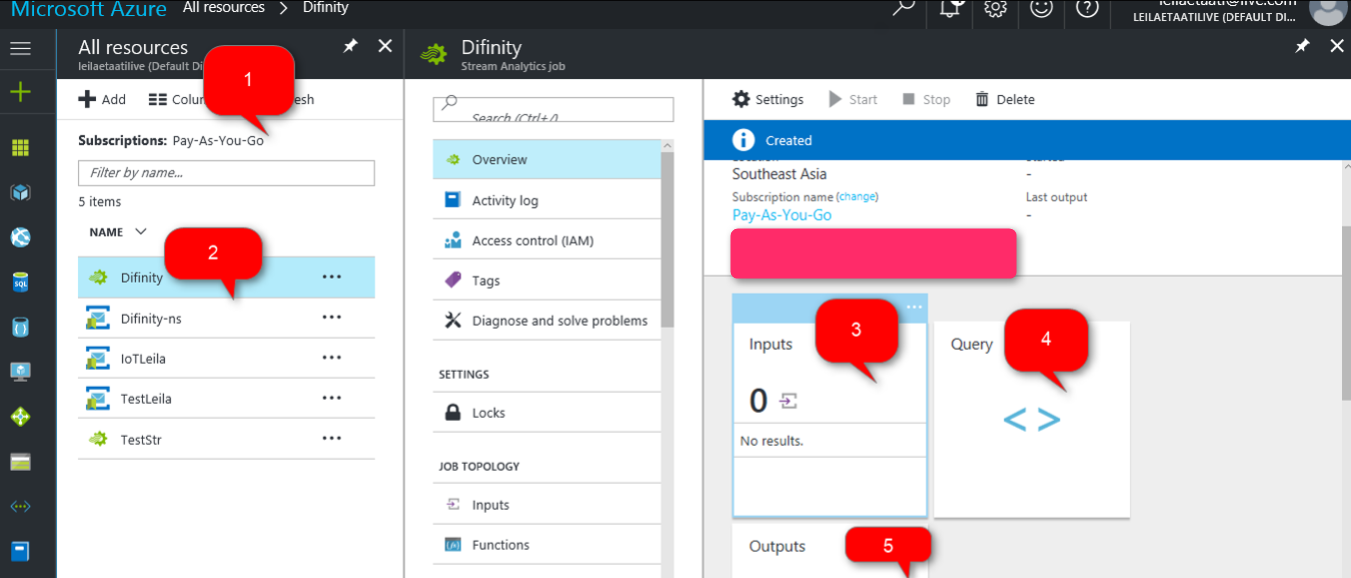
To create Stream Analytics, I login in new Azure Portal. In the search area I typed” Stream”, then I clicked on “Stream Analytics Job”
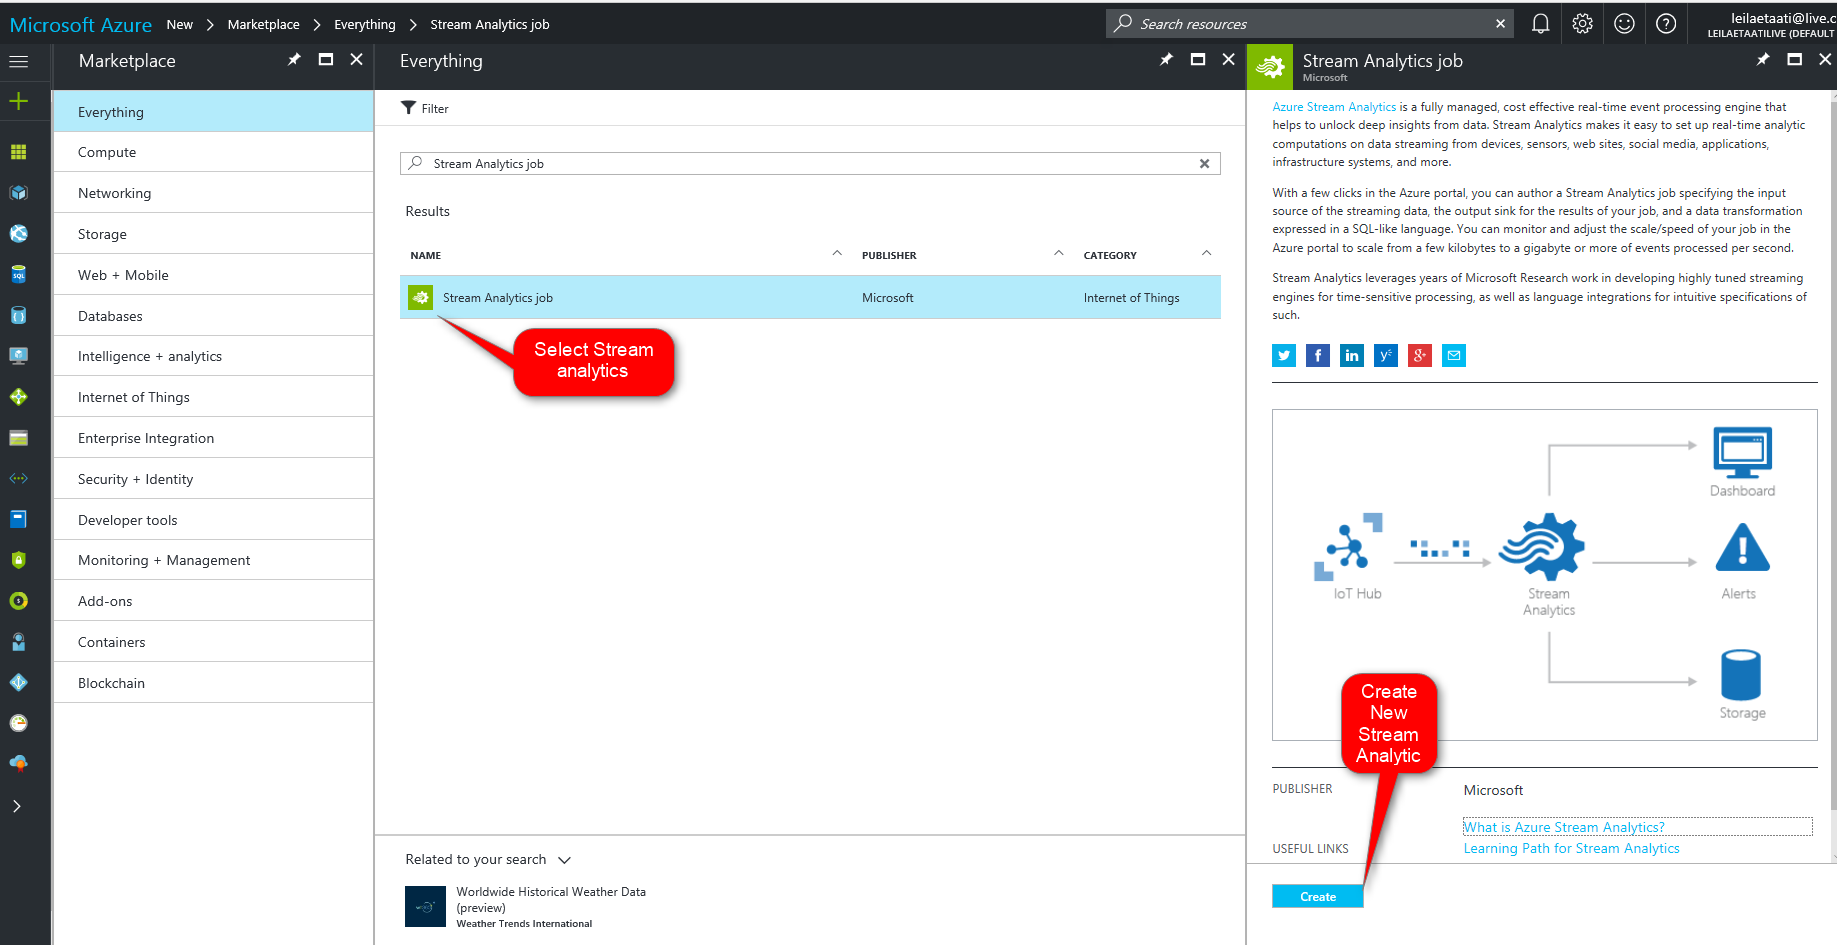
Then in “Name” area I clicked on “Stream Analytics Job”. By clicking on this icon, a new page will be appear. In this new page click on “Create” to start creation of New Stream Analytics.
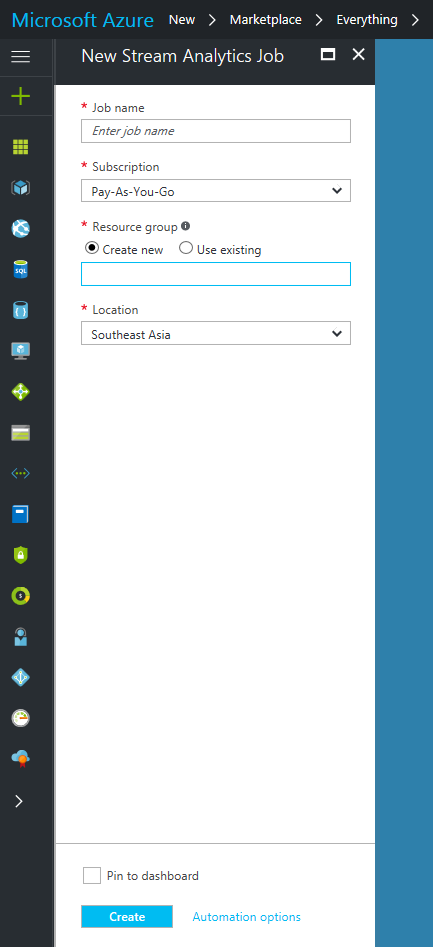
By clicking on create a new analytics, new page will be shown that we have to provided some information such as “Job Name”, “Subscription” that you already selected. Moreover, we need to identify the new resource group. Finally, we should identify the location that we want to set up the stream analytics server.
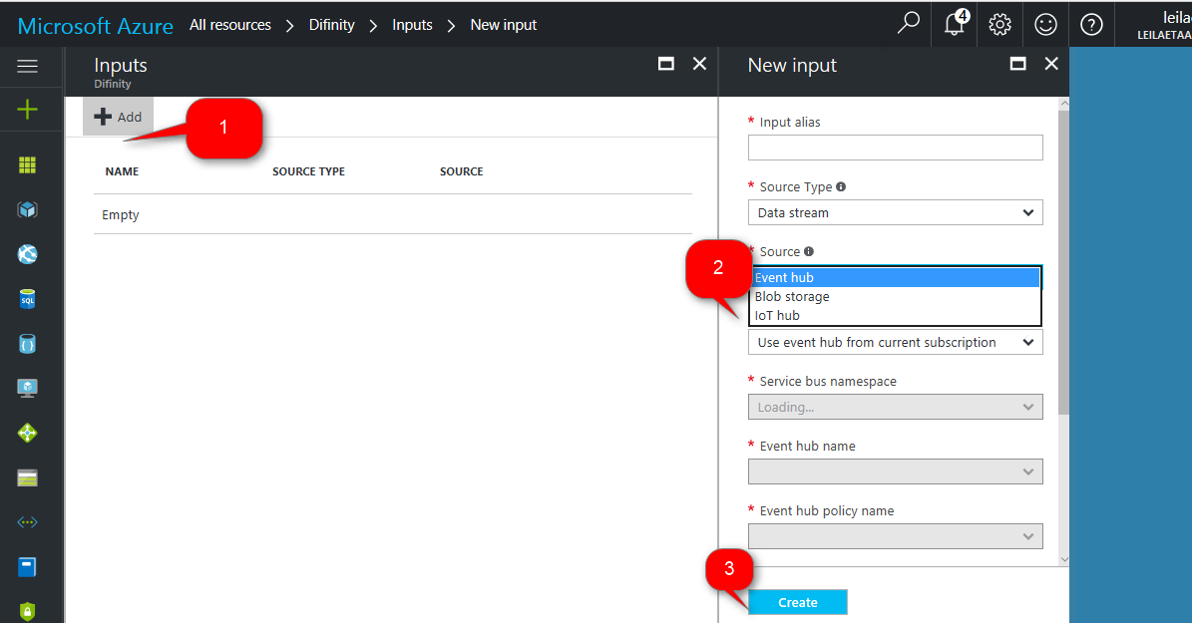
Stream Analytics accepts input from Event Hub, Blob Storage and IoT Hub. Stream analytics able to received data from these inputs.
Then we should write a query to sent the data from inputs to outputs. Stream Analytics able to send data to : Power BI, Azure SQL Server, Azure Data Lake Store, Blob storage, Table Storage, and Document DB.
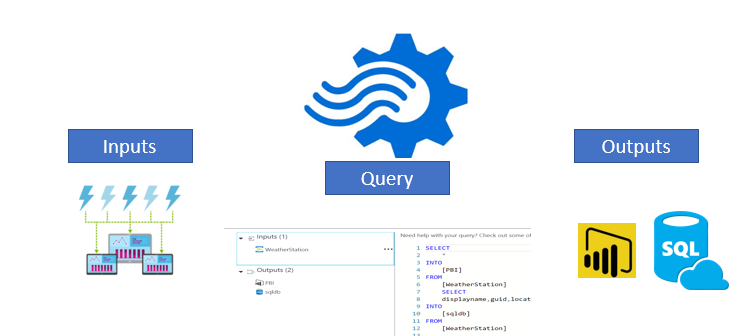
The query is “Stream Analytics Language” which is so similar to SQL statement. After creation a new stream analytics, we should specify the input and output for it. we specify the Input, Output, and Query by clicking on each of them.
after clicking on “Input” icon, we need to specify the input media. In our scenario “Event Hub” is the main input to get data. Hence, we specify the services and create the input.
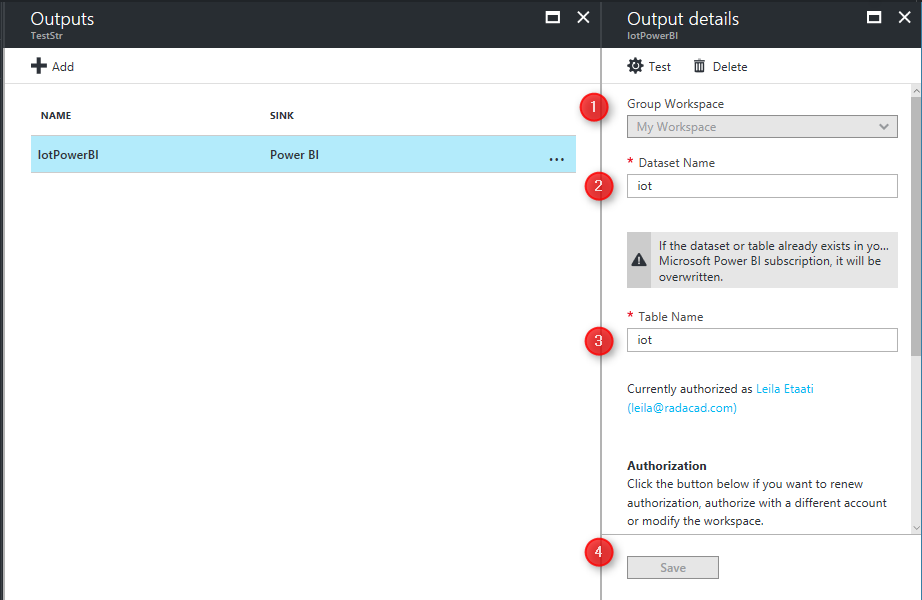
After Creating Input, we also have to select the Outputs. The output will be Power BI. By selecting the Power BI. In output we just need specify the Group workspace, Dataset Name and Table Name. Stream analytics will create automatically table in Power BI with the name that we allocated here(see below image). However the data attributes will be identified in Stream analytics Query.
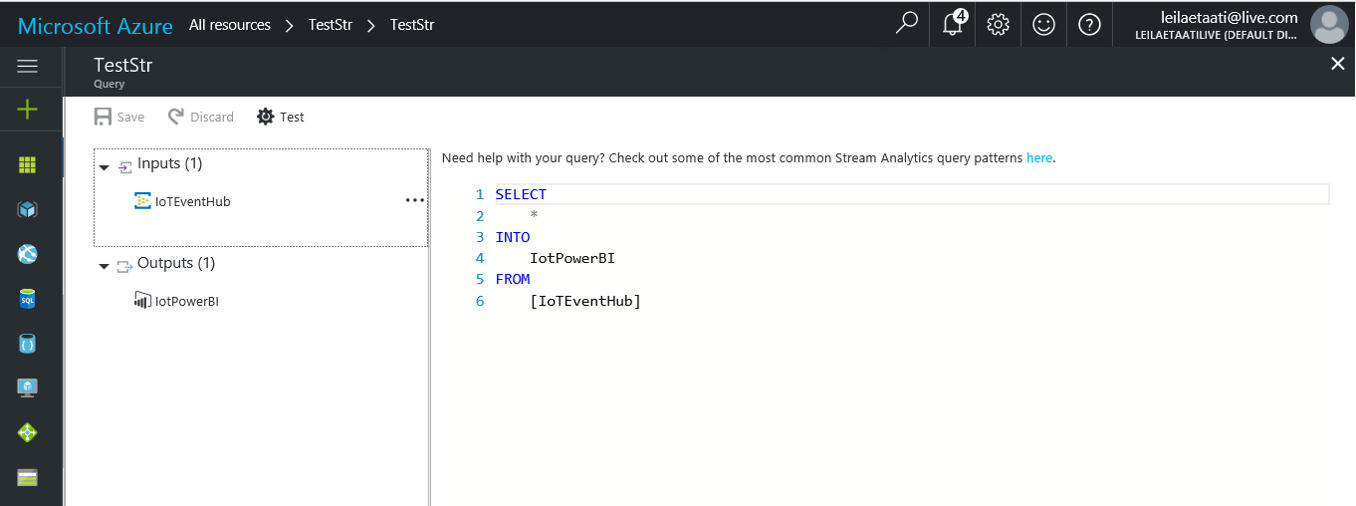
Stream Analytics Query is so similar to SQL Statement (See below image).
In this scenario, we want to get all data from Event Hub. Hence, we use “Select *” then in from clause we choose “IoTEventHub” that means all data have been collected from weather station. Then, we insert data from “IoTPowerBI”.
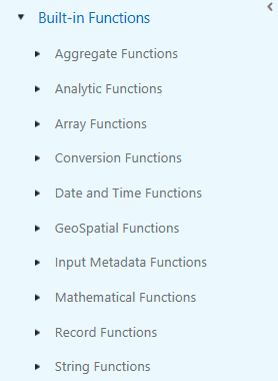
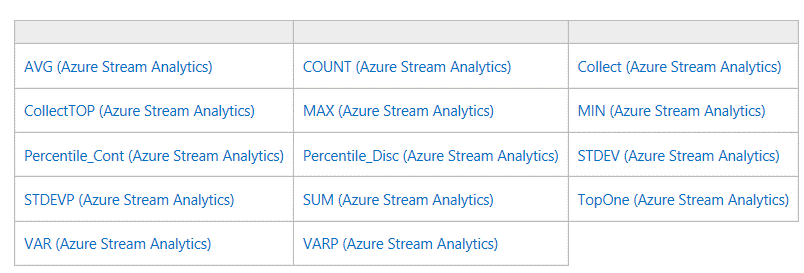
In Stream Analytics Query, we can also use the Built-in Function. In the below image you can see the all possible functions.
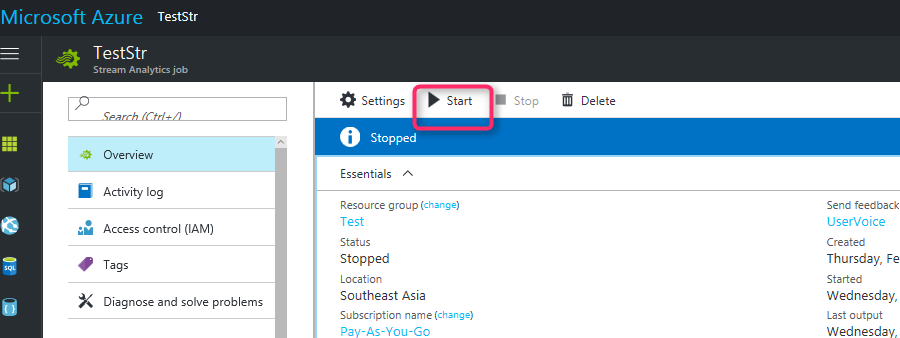
After creation Stream Analytics, we need to run the program(.Net Program that we already have it, Part1) and then start the Stream Analytics. To fetch data from event hub we have to start the stream analytics service (see below image)
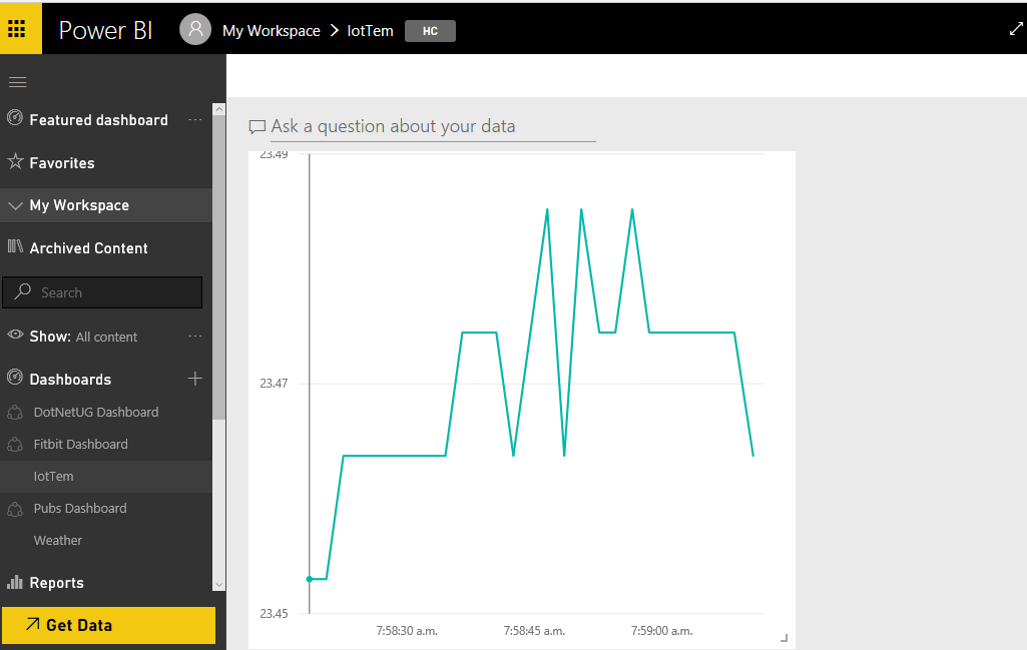
Data will be send to the Power BI. As you can see in the below image. By running the Stream Analytics. We will see below diagram in Power BI.
First we have to run the .Net code to get data from weather sensor. The data will be send from Net program to Event Hub. Below video shows the process. After that data will be send to the Stream Analytics. Stream Analytics will send data to Power BI. below video show the process.
After creation live data in Power BI.
There is a possibility to send the collected data to Azure ML and do more analytics. In the next post I will explain how to create prediction analytics in Azure ML for identifying the anomaly in the collected data from weather sensor.
[1]. https://docs.microsoft.com/en-us/azure/stream-analytics/stream-analytics-introduction.
[2]. https://www.hackster.io/windowsiot/build-hands-on-lab-iot-weather-station-using-windows-10-5b818f.
Published Date : February 28, 2017
In previous post (http://radacad.com/create-a-live-stream-weather-station-with-cortana-analytics-part-1), I have explained what is Cortana, What is IoT and how to set up the Raspberry pi3. In this post, I will explain the process of connecting weather station sensor to Raspberry Pi. Also, how to send data to the Event Hub and set it up.
For connecting Raspberry PI to weather station sensor, we should write some codes. Two types of code are needed. First a code that read data from sensor and, the second one that send data to cloud.
There is an article that shows the process of connecting weather station to Raspberry PI (https://www.hackster.io/windowsiot/build-hands-on-lab-iot-weather-station-using-windows-10-5b818f). This article provides 4 main .Net projects:
1- Sparkfun weather shield: a Universal windows project for collecting information from Weather sensor
also for collecting the “barometric pressure” information we use mpl3115a2 project and also for measuring humidity htu21d project has been used.
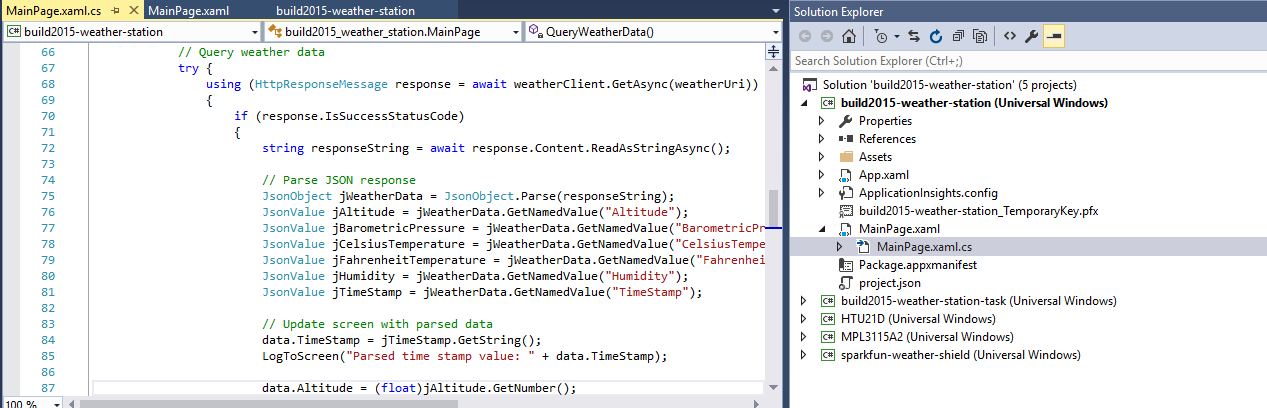
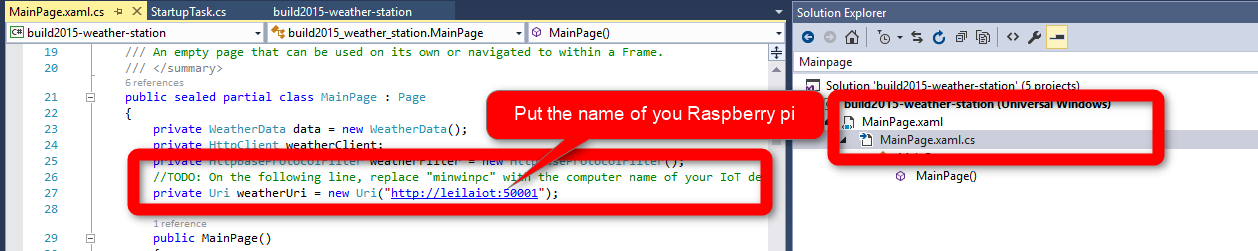
First of all, we should specify the name of Raspberry PI in code. Hence, find the file with name “MainPage.xaml.cs” then in uri put the iot device name.
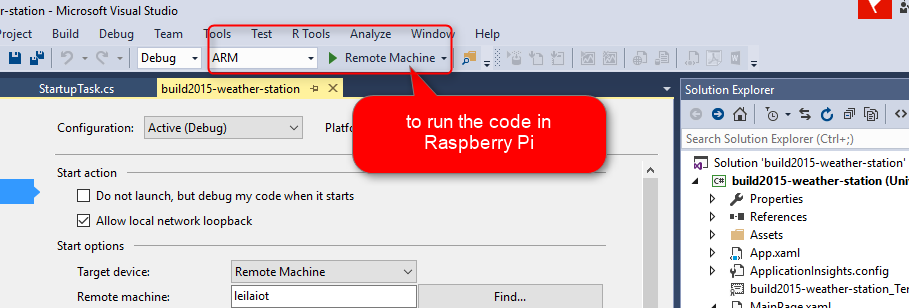
In windows universal projects, the code will be run in specific device, that in this scenario is “Raspberry Pi”. hence we have to specify the device name, that we want to run code on it. In page build2015-weather-station we should find the remote machine first.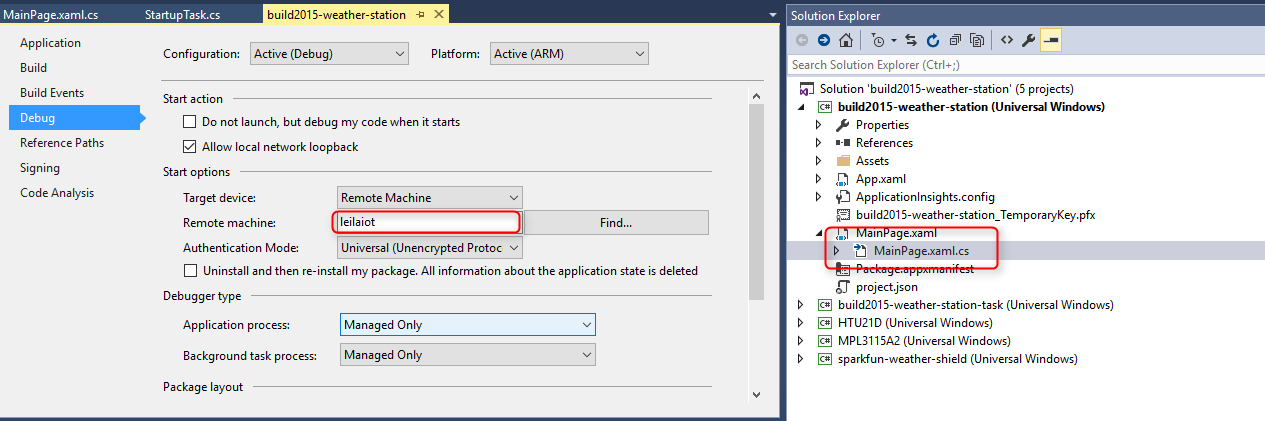
there is an important note that raspberry pi and pc that we run should be in a same internet network.
by running the code, in monitor you will see the below picture, that shows weather station is receiving information about weather such as humidity, temperature and pressure.
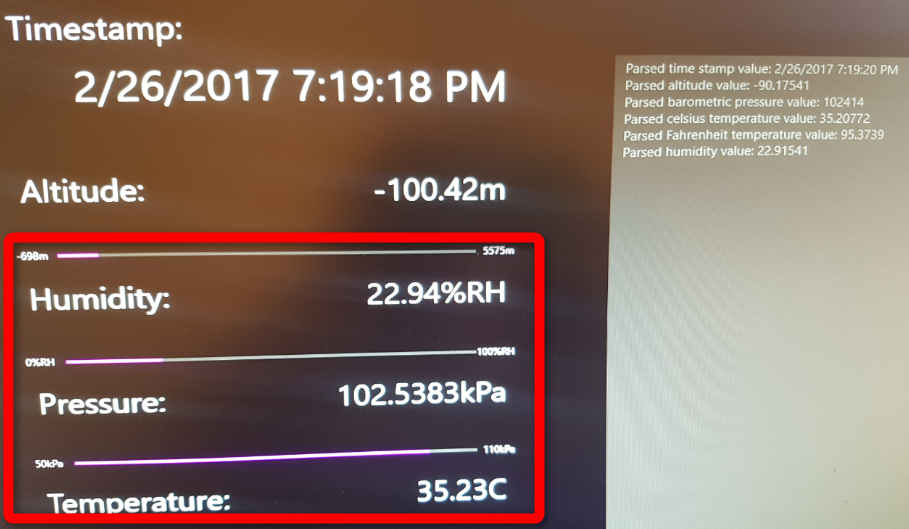
In this stage, Raspberry Pi and weather station sensor have been connected. Now, we should sent the collected data to Cloud (Cortana), but before that, we it should be set it up.
Event Hub
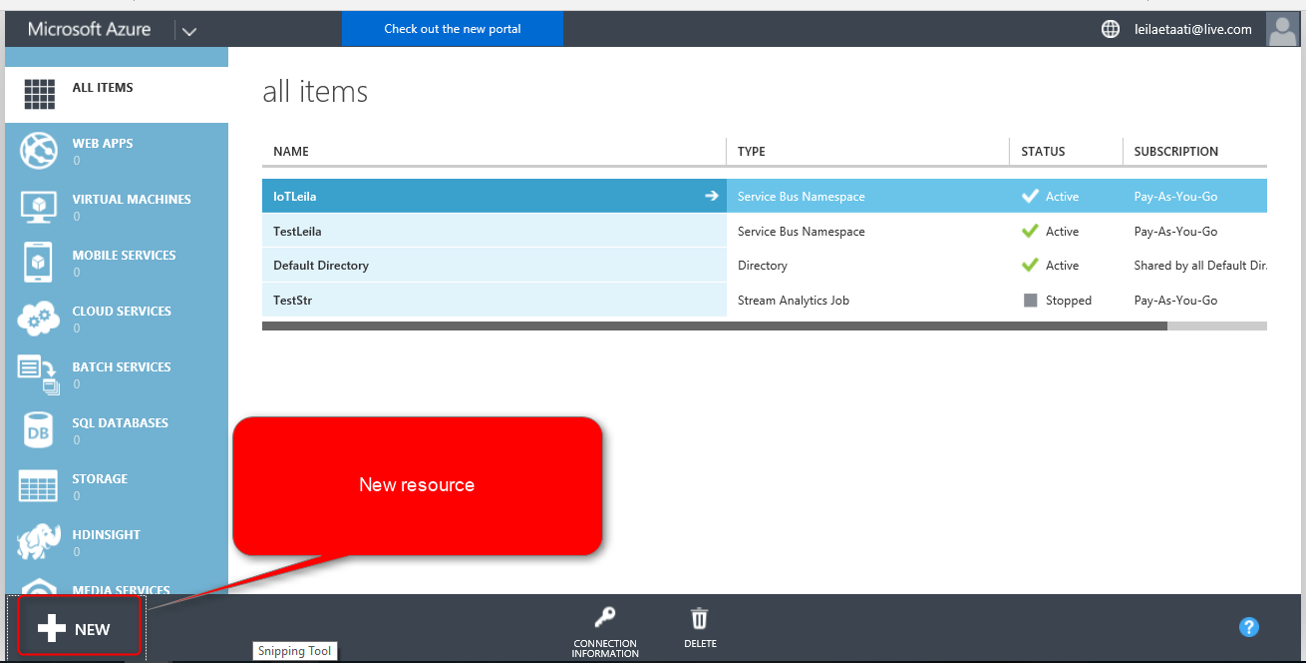
Event hub is a managed event ingestor that able to collect million of events per second from different devices. Event hub is part of service bus in Cortana. It receives information from Raspberry PI in JASON Format. To create event hub, I login in old Cortana portal: “Manage.windowsazure”. Tto create new event hub we should create “New” component.
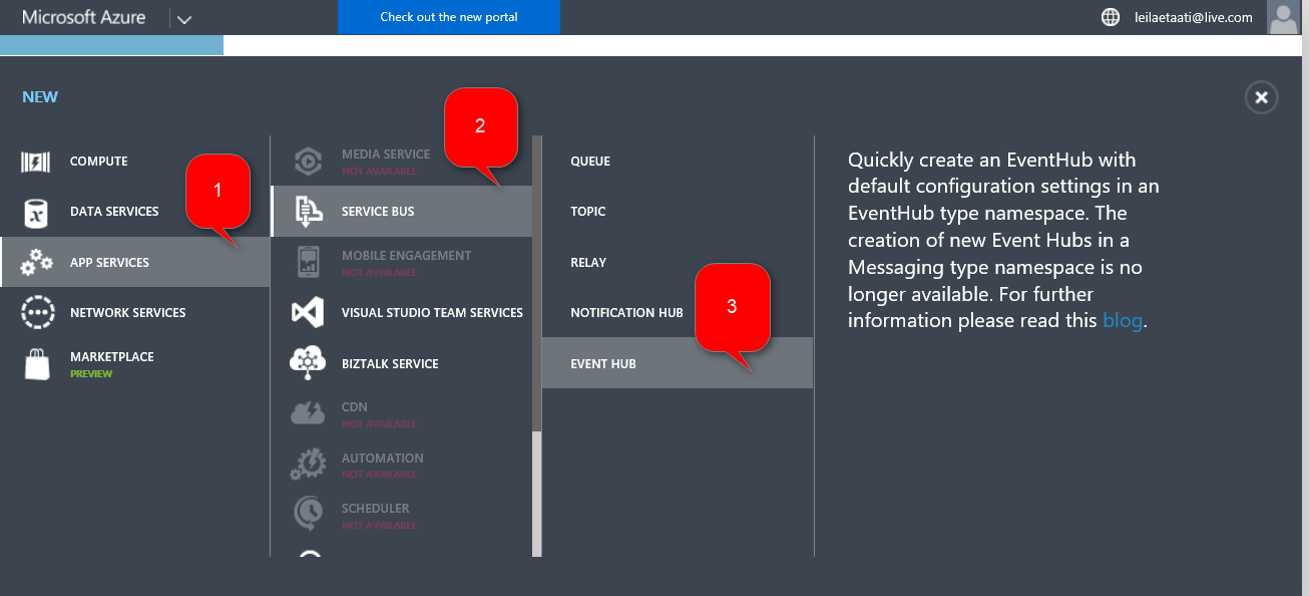
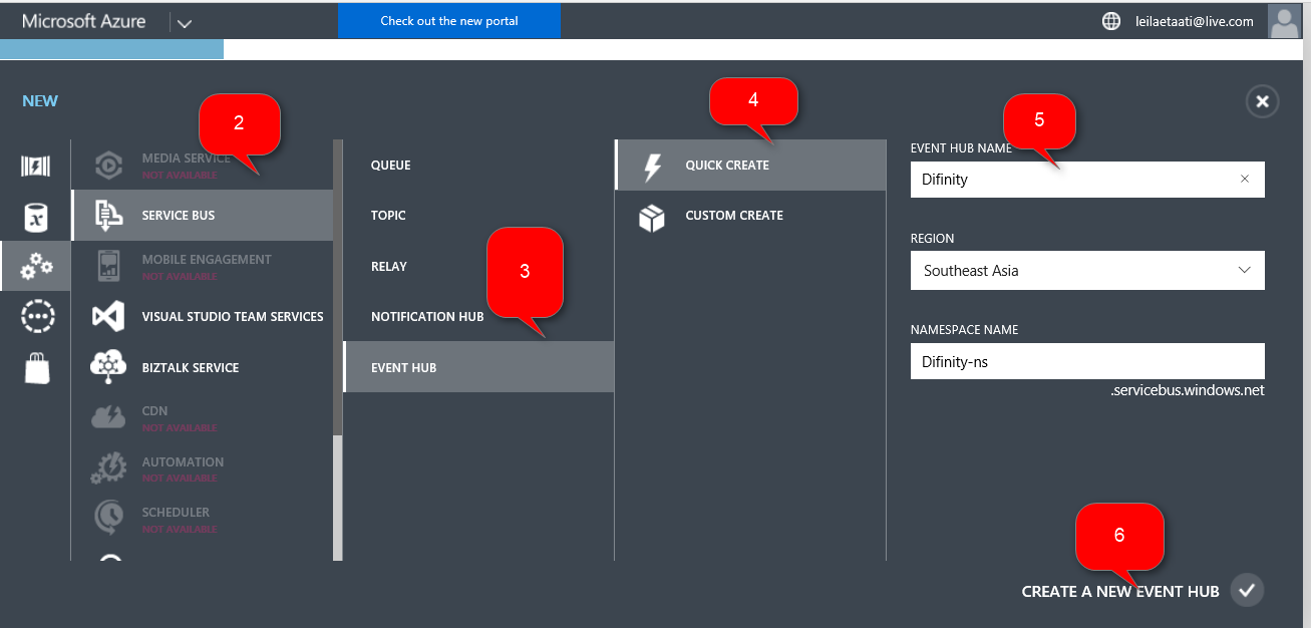
By clicking on New bottom, new page will be show up, we should create “APP Service” and then “Service Bus”. following, in service bus, “Event Hub” should be chosen.
This should be accompany with specifying the Event Hub name and Region, which in my case is “Southeast Asia”.
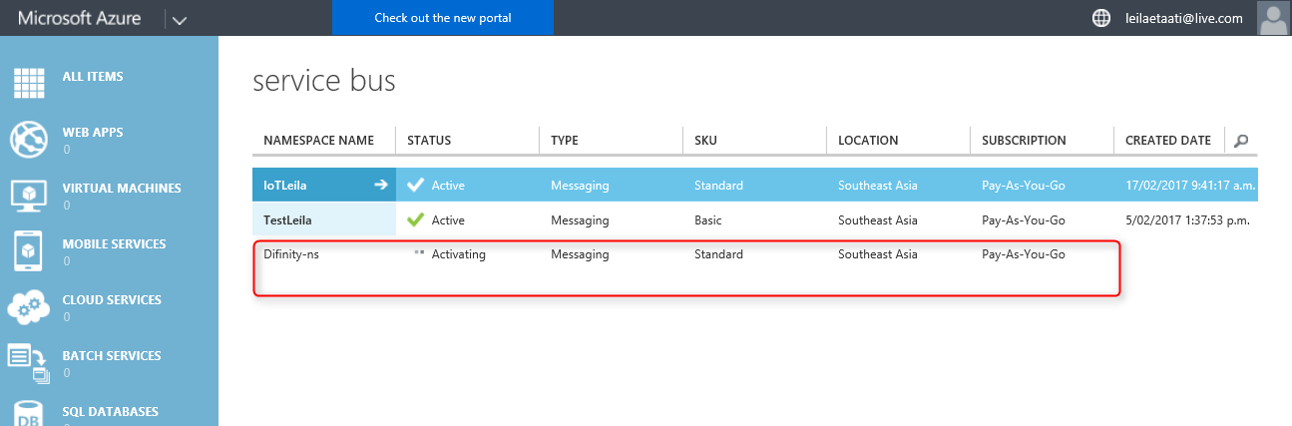
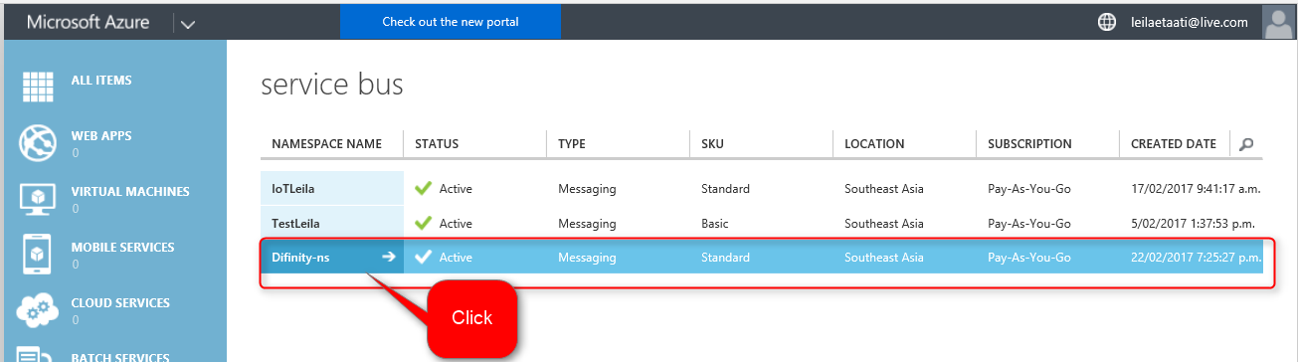
now we can see the process of creating Event hub and related service bus in Cortana (see below picture).
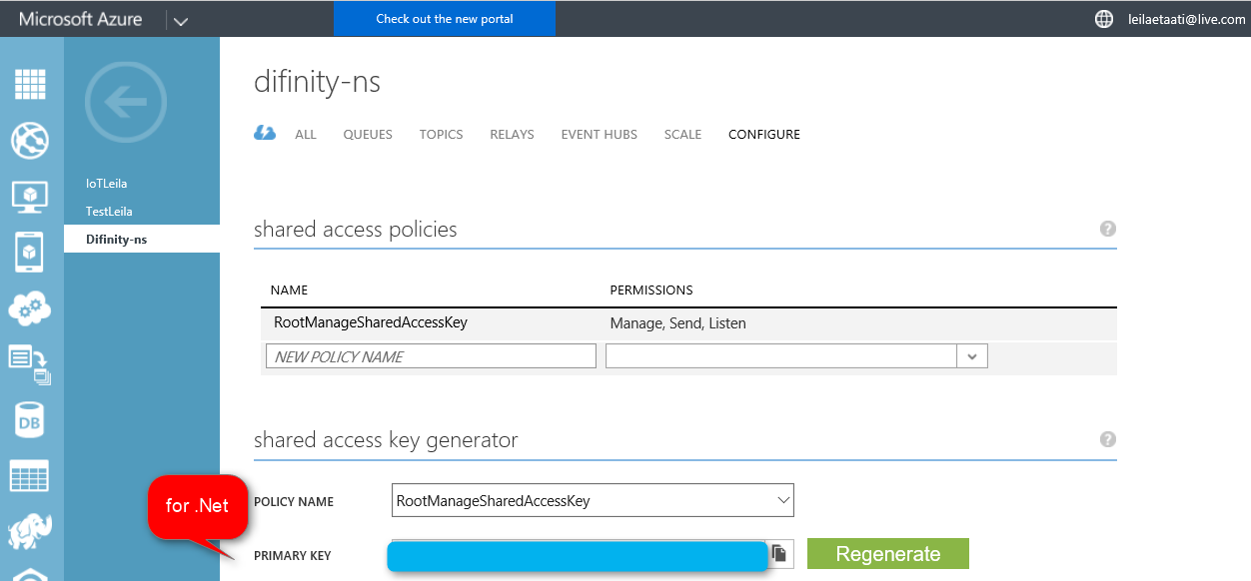
After creating Event Hub, we able to see Event hub configuration by clicking on the configuration component (below picture). By clicking on the name of Service bus, we able to see the configuration in event hub.
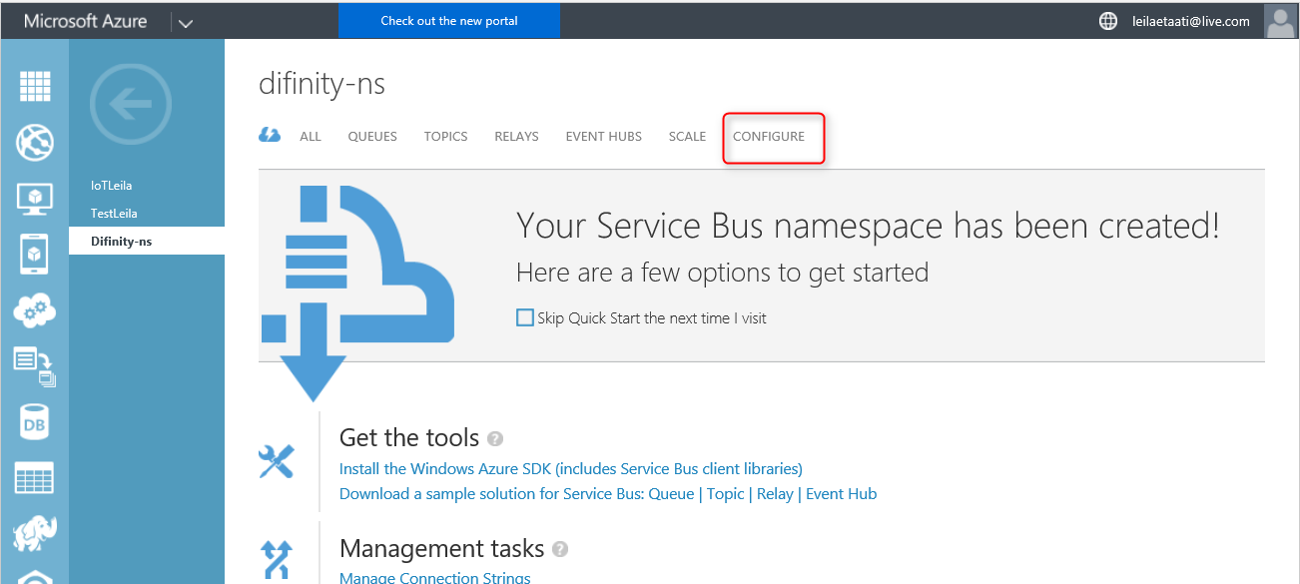
In event hub we can see some information about the “Policy Name” and “Primary Key” that can be used for creating connection between Universal Windows code that we have and Cortana analytics.
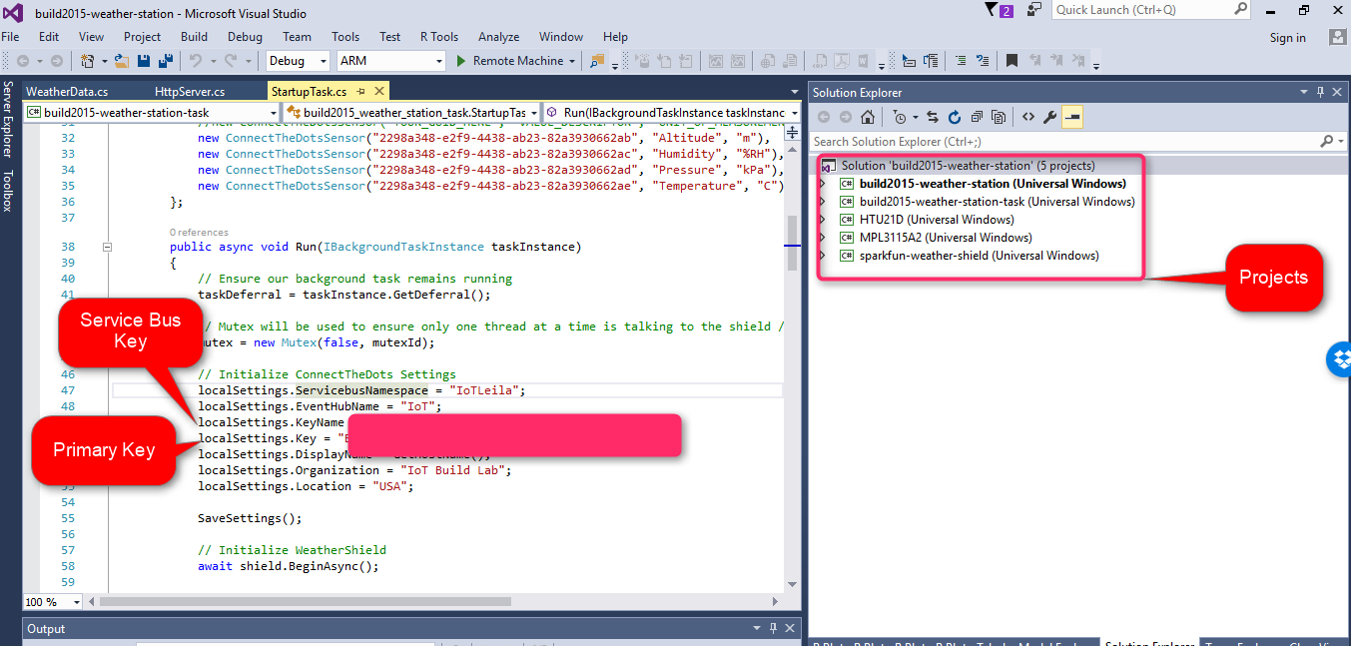
now we should put the policy code and primary key in our .Net code as below
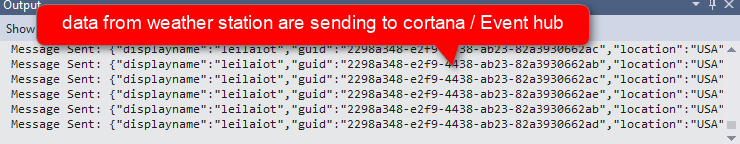
By running the code, first the project will be deployed in Raspberry PI and the information from weather sensor will be send to Event Hub. Below picture shows the sending message in output.
Now by clicking on the “iotLeila” service bus in Cortana analytics (see below picture), we can see the Related Event Hub.
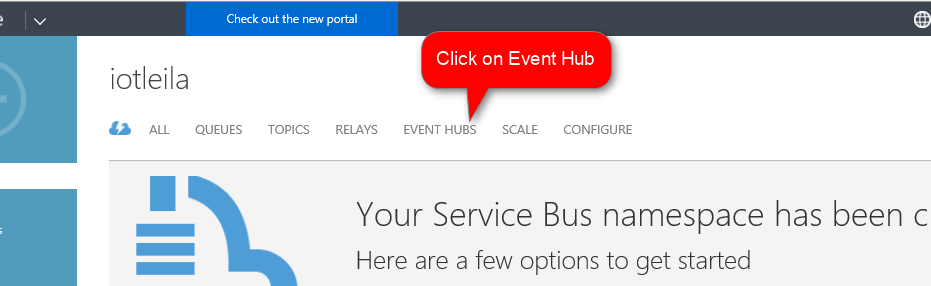
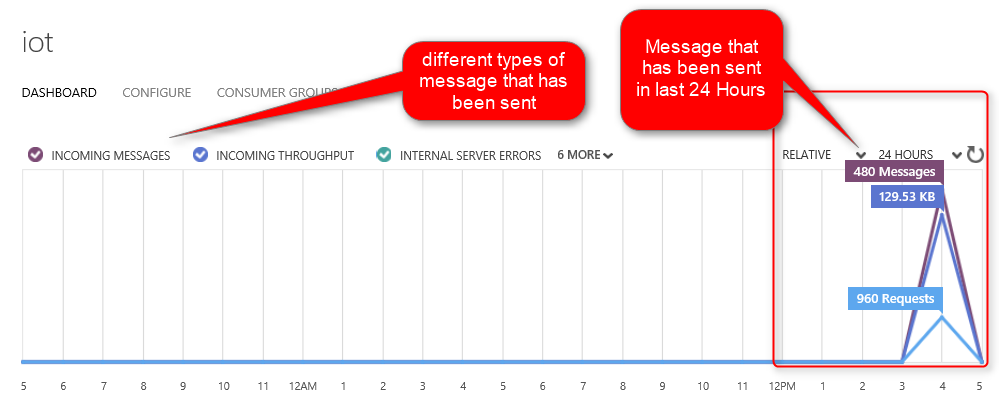
Then, we can see iot event hub in below picture.
We can see all the messages that have been sent to Event Hub in last 24 Hours. This includes all sending message, errors and successful messages.
Till now, we find out how to send data from weather station to Raspberry PI and then to Event Hub. In the next, post I will show how to sent information to Power BI and Azure ML via stream Analytics.
[1]https://www.hackster.io/windowsiot/build-hands-on-lab-iot-weather-station-using-windows-10-5b818f
[2]http://blogs.perficient.com/microsoft/2015/10/data-and-event-ingest-with-cortana-analytics/
Save
Published Date : February 27, 2017
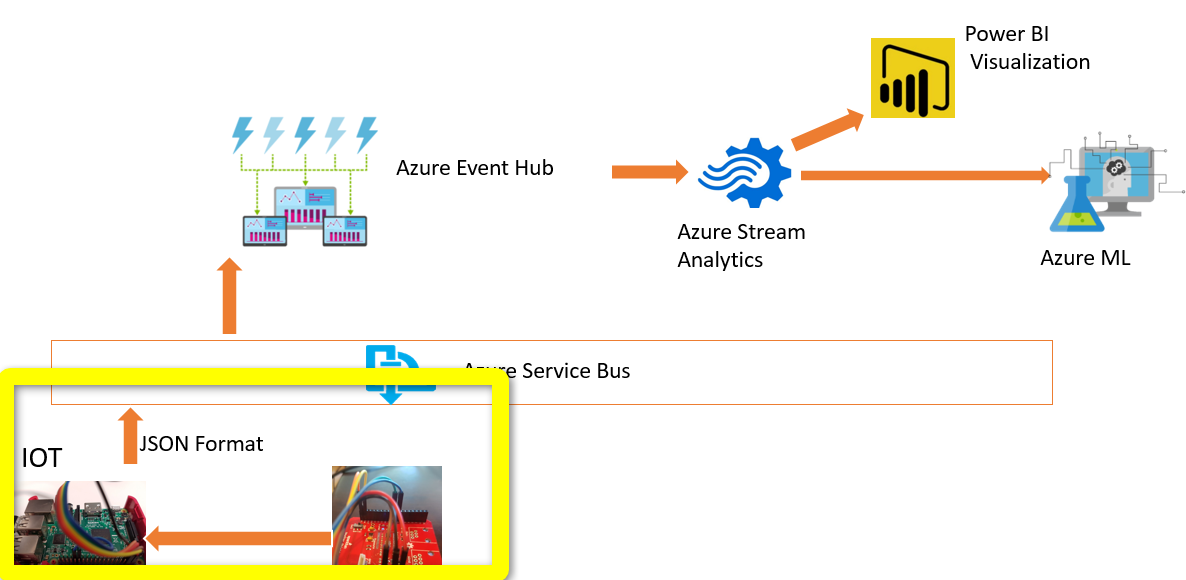
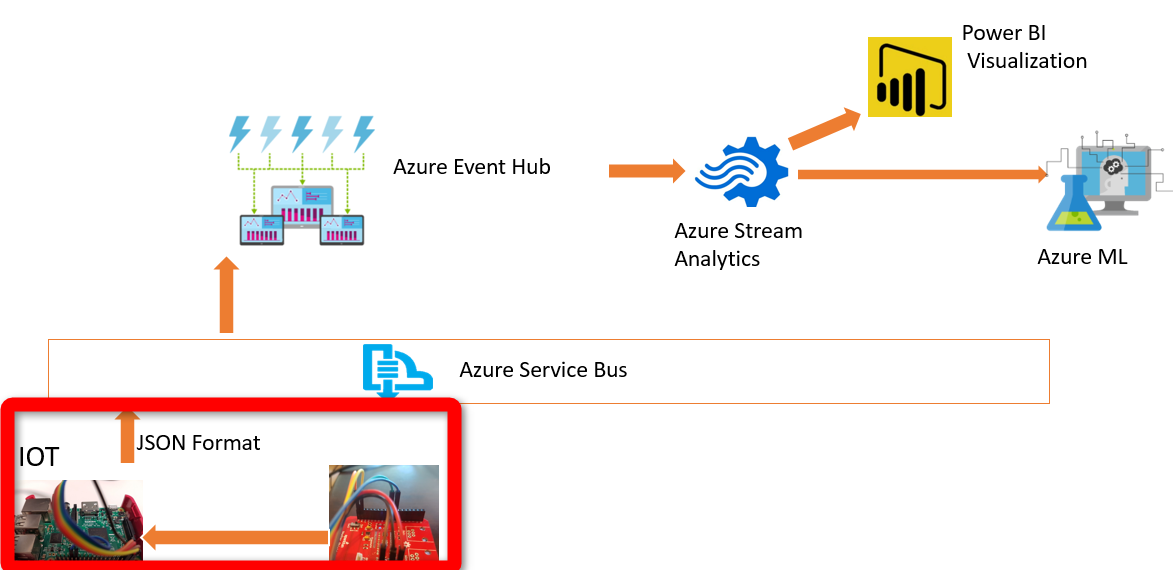
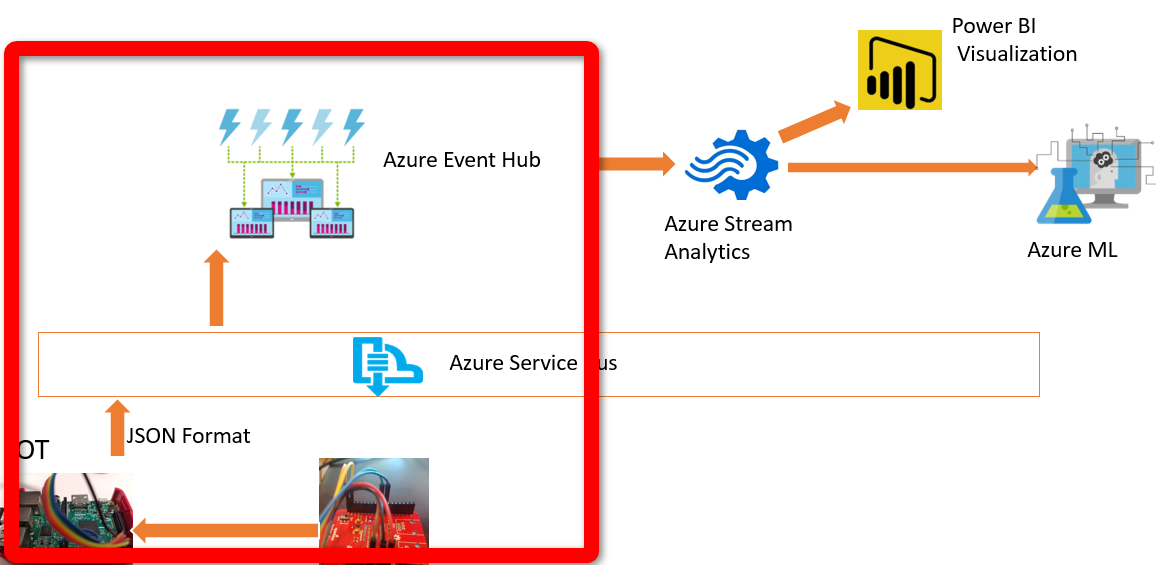
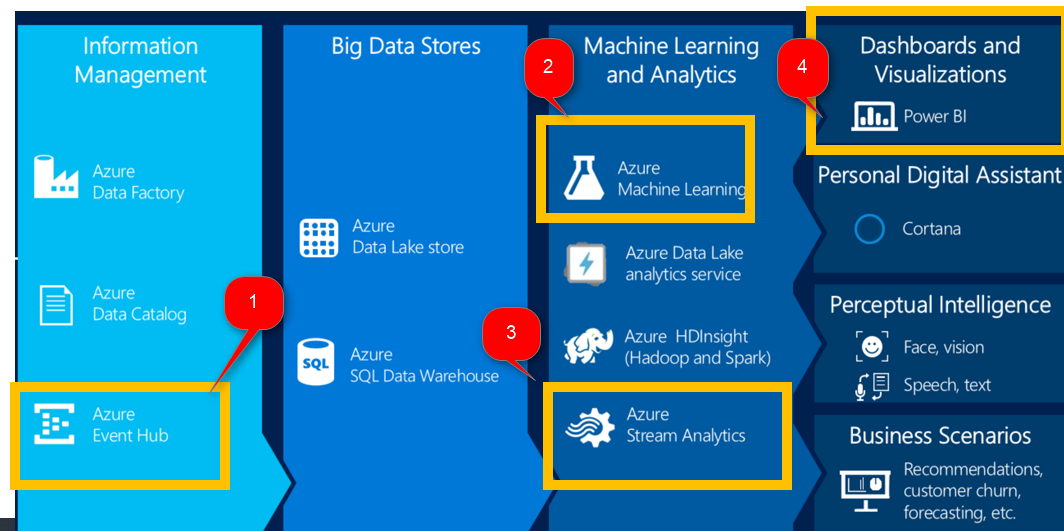
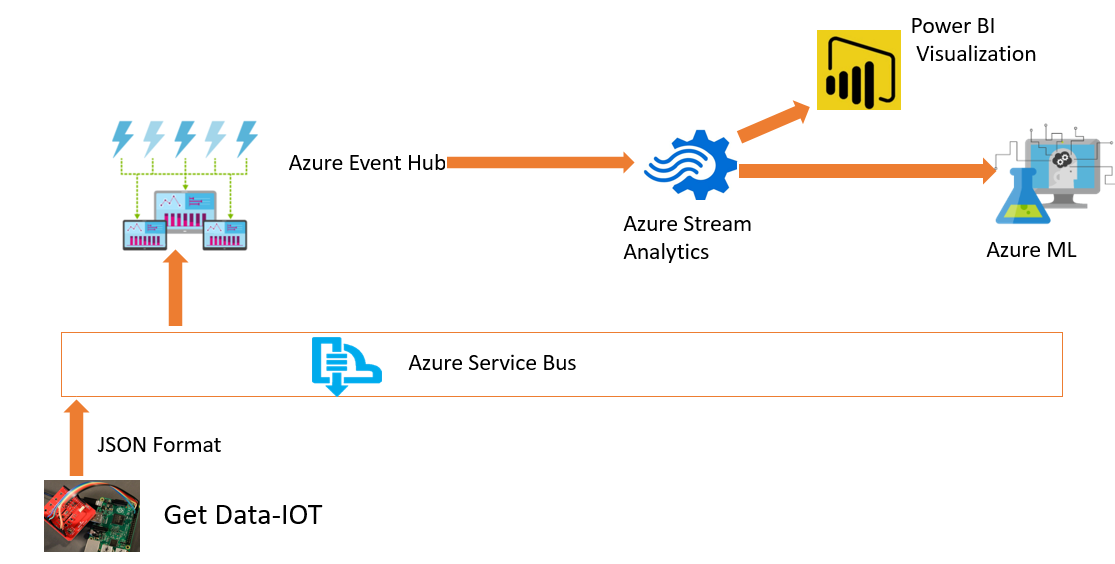
Cortana analytics help organization to transform data into intelligence. In this post I will show how to use Cortana Analytics for IoT and Machine Learning Purpose. In propose scenario I will try to show some components of Cortana intelligence that has been used for collecting data from a weather station sensor and show the live temperature data in Power BI visualization. In this post I will show how to get data from raspberry Pi and a weather station sensor[1]. In next Posts the process of creating Event hub, creating stream analytics, Azure ML and Power BI will illustrate.
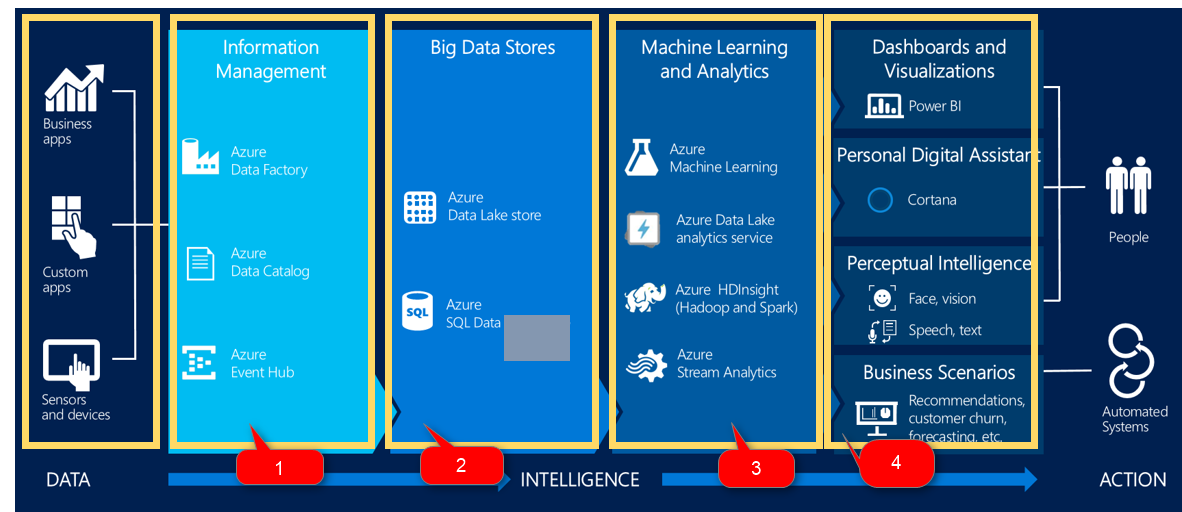
Cortana has four main parts as “Information Management”, “Big Data Stores”, “Machine Learning and Analytics”, “Dashboard and Visualization.
Information Management: has four main components that help us to gather information from different resources into Cortana.
Big Data Stores: it a another component of Cortana for storing data and information such as Azure SQL database and Azure data lake.
Machine Learning and Analytics: is another component that bring intelligence from collected data by Azure ML, and Azure HDInsight.
Dashboard and Visualization: the fourth component that shows the result of analytics to end user.
In this post I used four main component in Cortana to transfer data from sensor to power BI.
The internet of things (IoT) is one of the hot topics in last years. So, what is IoT and how we can make benefit from it? according to Wikipedia: “The Internet of things (stylised Internet of Things or IoT) is the internetworking of physical devices, vehicles (also referred to as “connected devices” and “smart devices”), buildings, and other items—embedded with electronics, software, sensors, actuators, and network connectivity that enable these objects to collect and exchange data”
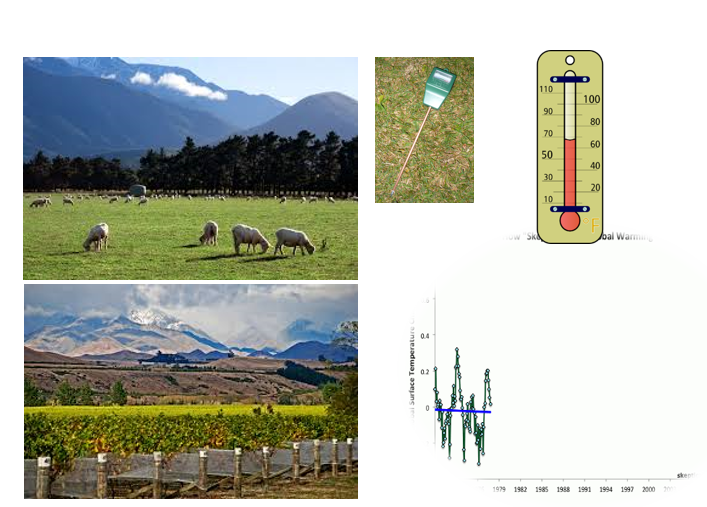
There are many examples of using IoT in farming, greenhouse, boats and houses.
IoT can be used in a farm or greenhouse to check the weather elements constantly. some plant are so sensitives to suddenly changes in temperature and humidity. These changes may has some terrible impacts on plants, herbs and flowers.
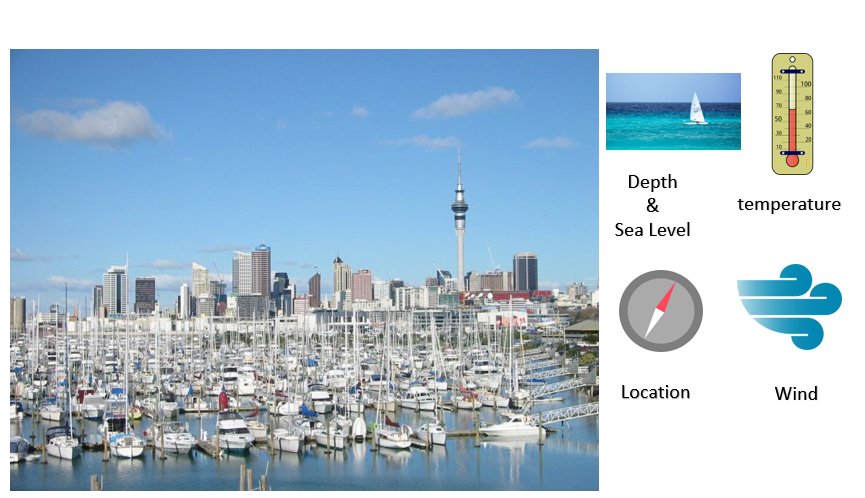
IoT can helps people who are going for fishing or boating. It possible to check the sea depth, temperature, location and wind via sensors and observe the changes live.
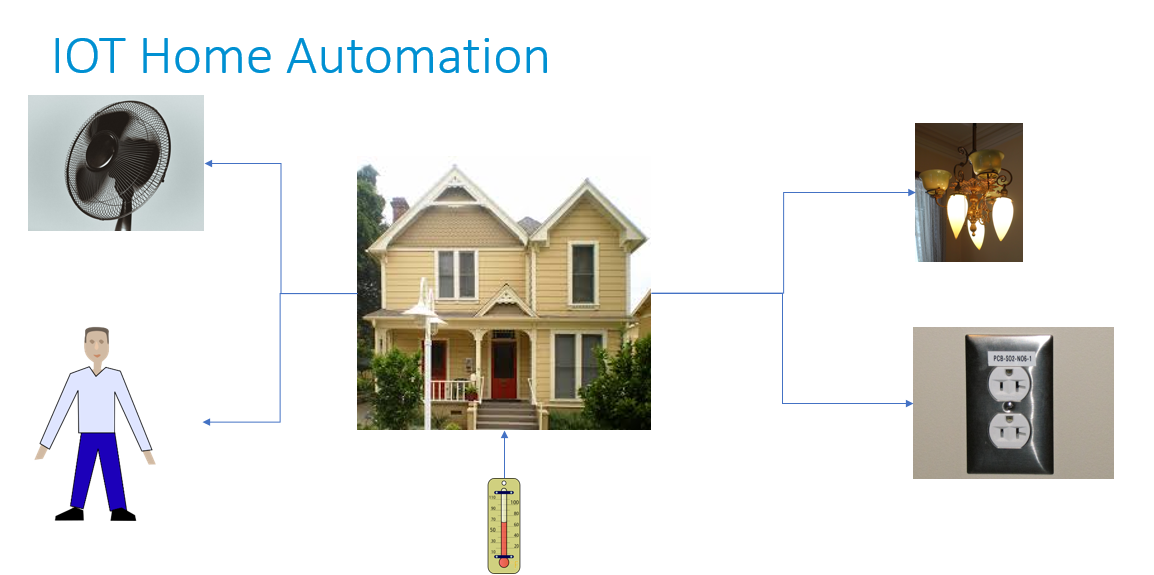
also IoT devices can be used to control the home automation. for instance, control the heat of rooms, speed of fans, switch off and on the lights or even check the movements in home live and via different sensors
In this post I will show how to get data from a raspberry bi and weather station sensor.
First of all you can see the whole process in below video
https://www.youtube.com/watch?v=PeNBMpArCM8&feature=youtu.be
first of all we should collect data from sensors. To do that we use a Raspberry PI
Raspberry pi 3 has been used widely in creating games, teaching computer programming to children, or as a IoT device to control the home environment.
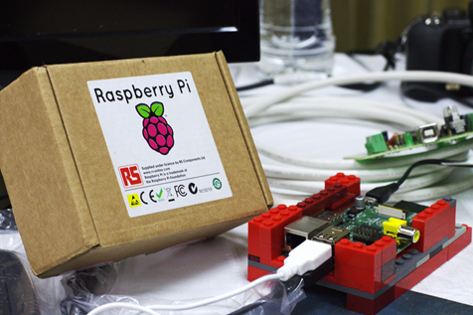
approximately 8 millions raspberry pi has been sold around the word.
according to the Wikipedia raspberry pi “The Raspberry Pi is a series of small single-board computers developed in the United Kingdom by the Raspberry Pi Foundation to promote the teaching of basic computer science in schools and in developing countries”
raspberry pi is like a PC that has all main elements of a PC such as CPU, USB Ports, Memory (SD card), HDMI port, Bluetooth, Ethernet port, audio jack and composite video, RAM and so forth

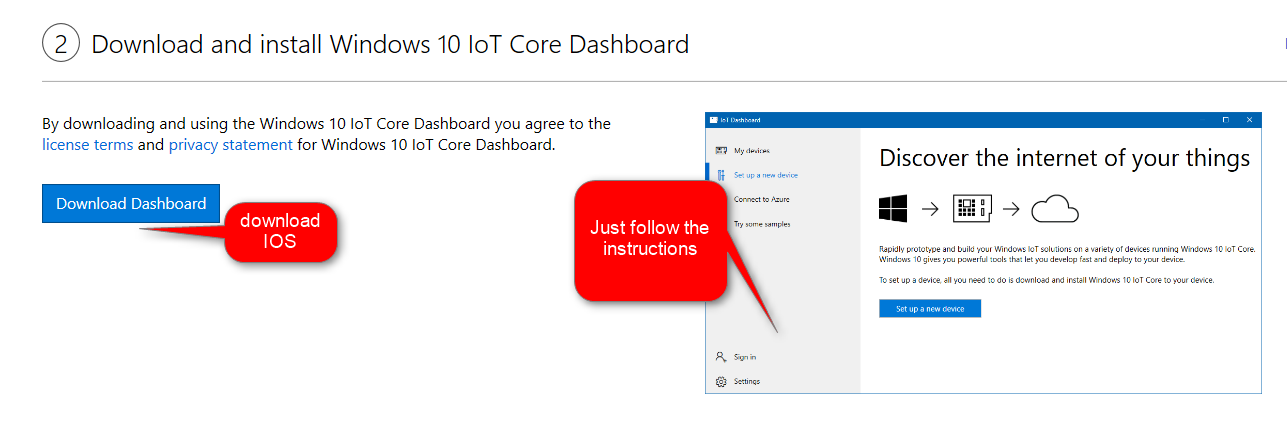
to run the raspberry pi 3 we have to install windows IoT on it. to do that, we install windows IoT 10 on it via below website: https://developer.microsoft.com/en-us/windows/iot/getstarted
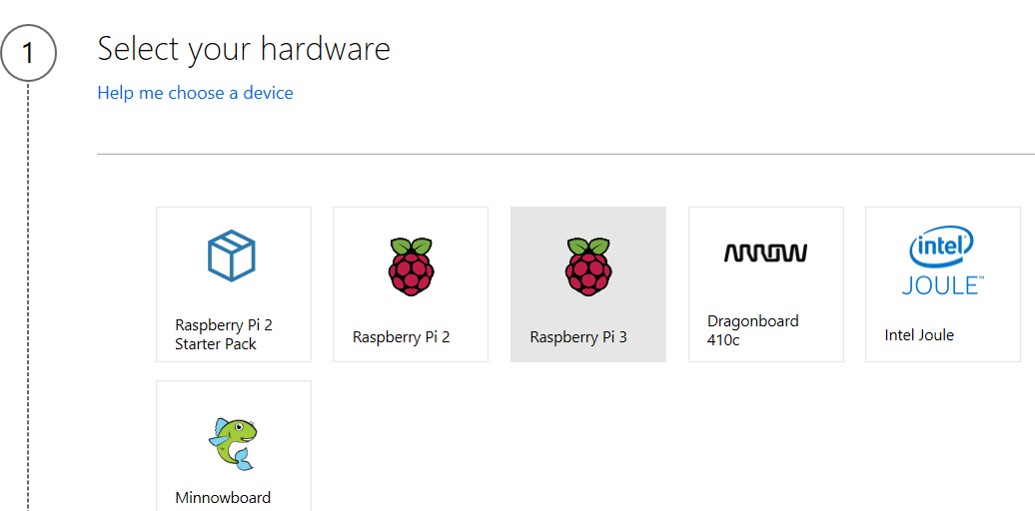
we first choose the Raspberry pi model which in my case it was Raspberry pi 3
then the related hardware is choose
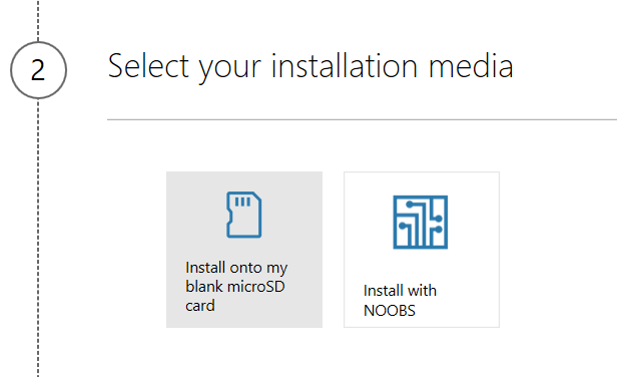
and finally we choose the windows IoT version
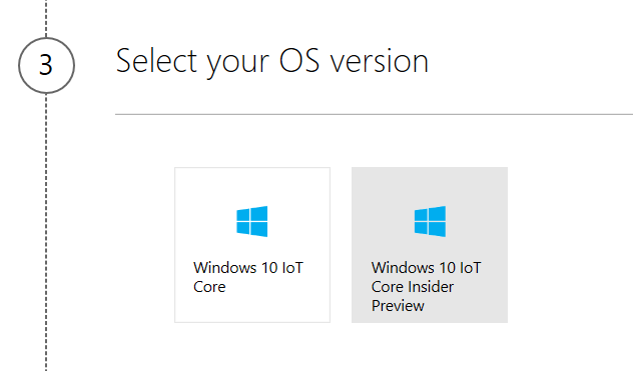
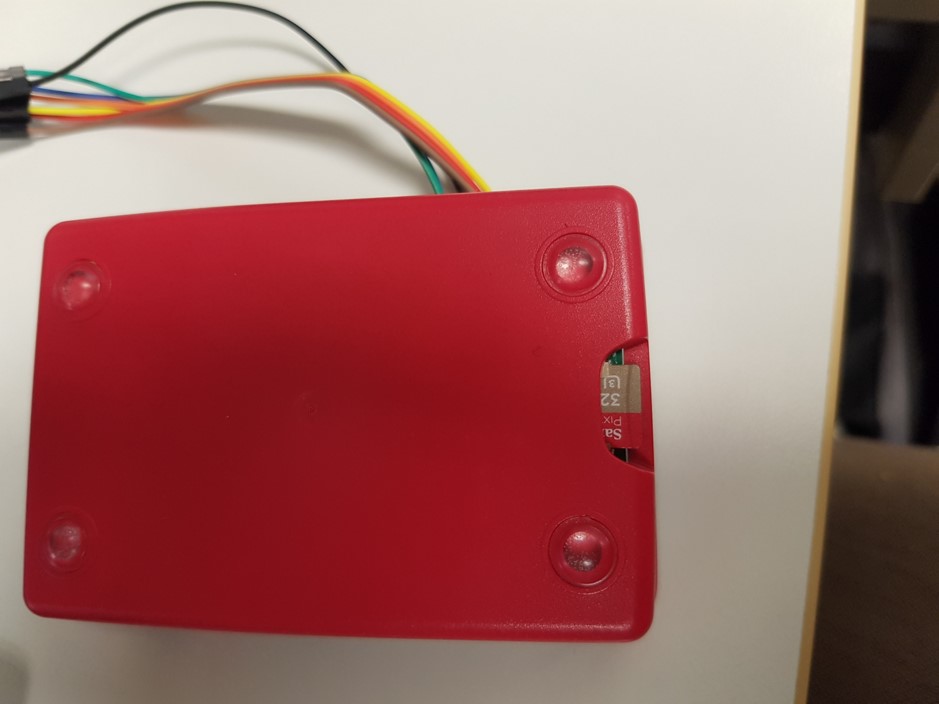
Finally we install windows 10 IoT in SD memory card, you should follow the rest steps to install the IoT into Sd card.
Then we put the SD memory card into Raspberry pi3 (see below picture)
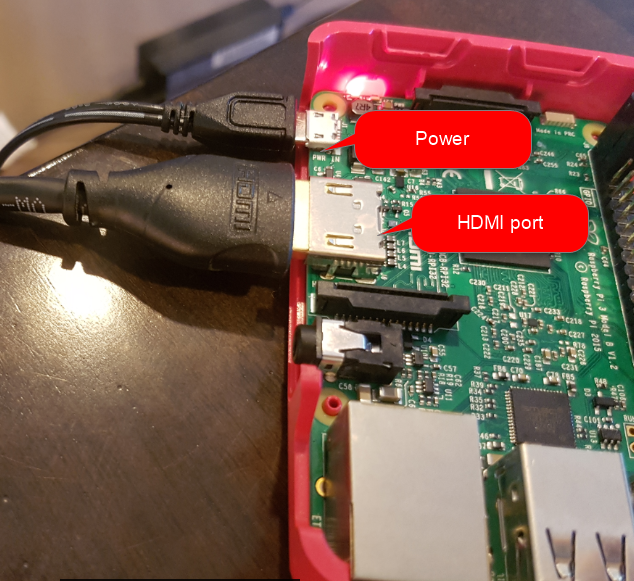
now we have windows in out Raspberry pi. Now, we connect it to the power and monitor to see its environment. Moreover, as the windows IoT is a visual IOS, we can connec a keyword and mouse to the Raspberry pi 3 USB ports.
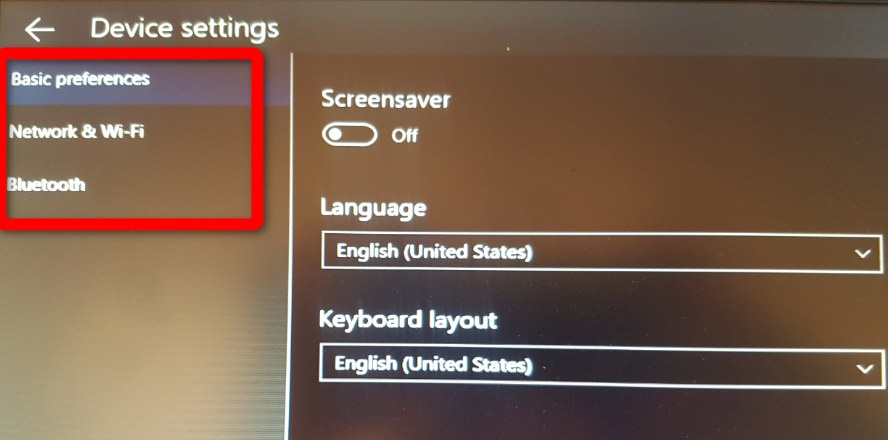
now in monitor we can see the windows IoT that we install in raspberry PI 3

the device name, network connection, the setting and other information has been shown in monitor. moreover, to set the wifi and Bluetooth we use the setting.
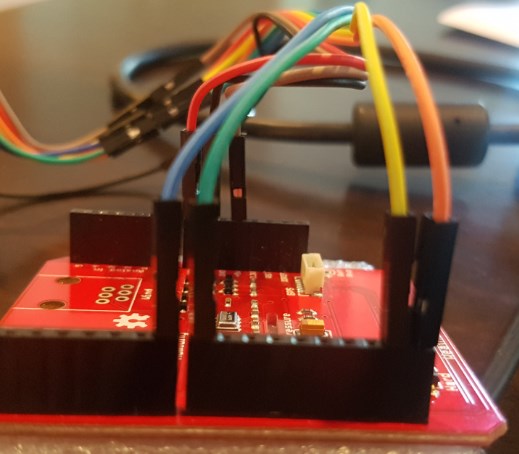
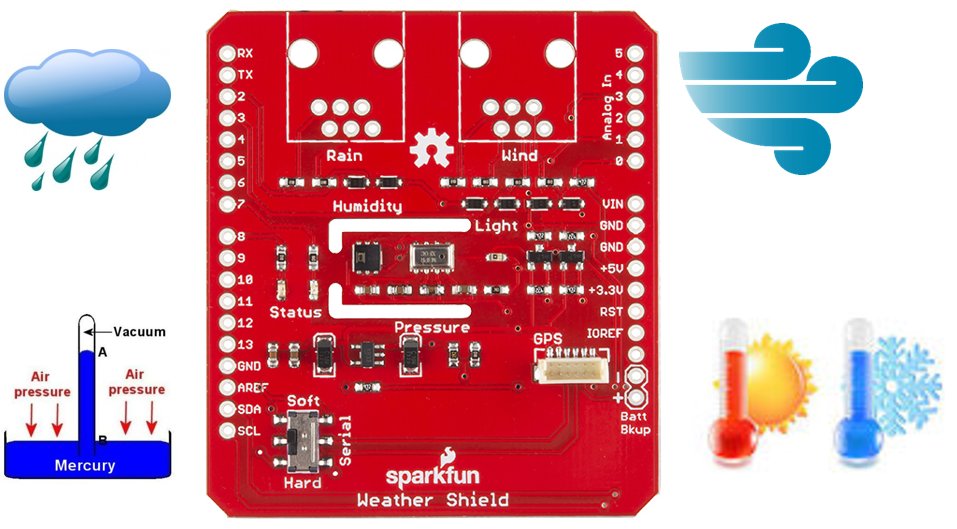
Now, we should set up the weather station sensor.
I purchased online from https://www.sparkfun.com/products/12081.
this sensor able to measure weather temperature, humidity, and some other elements.
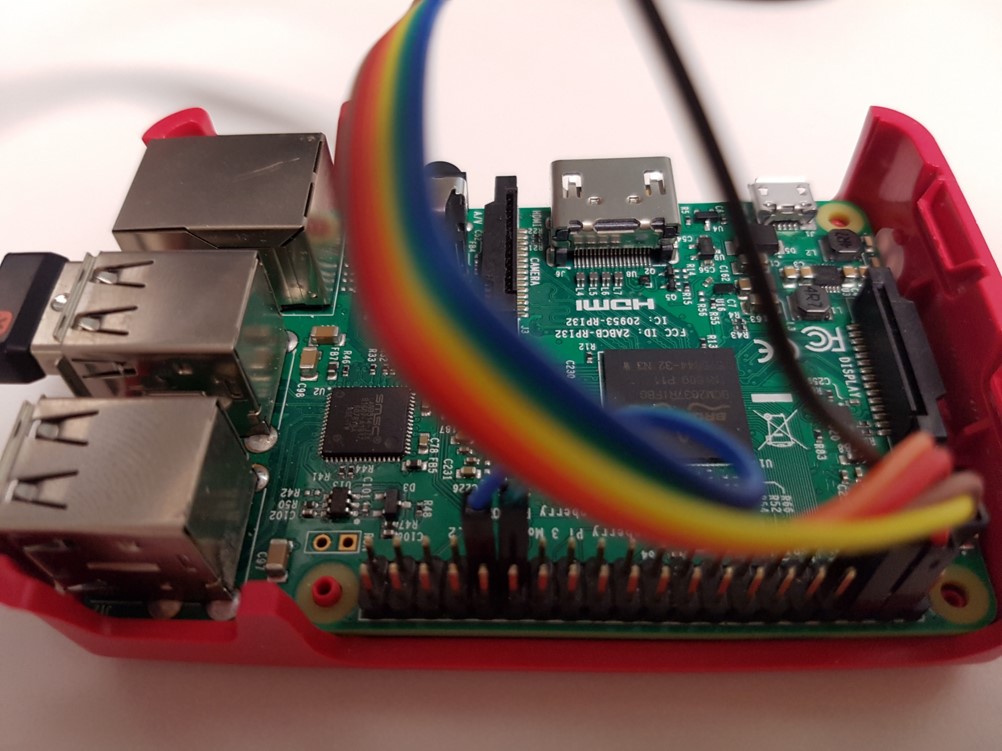
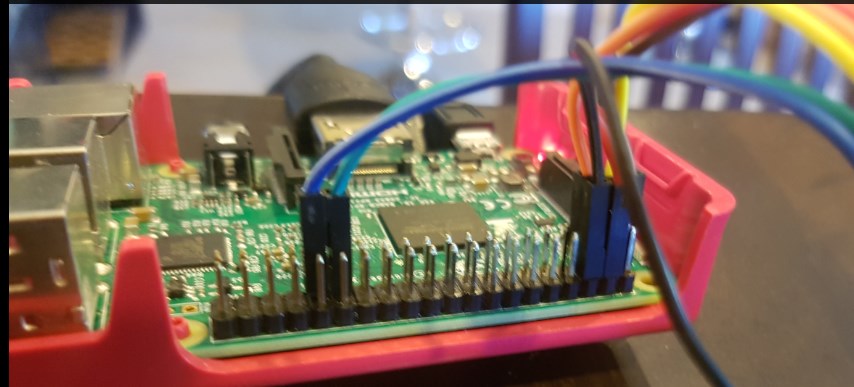
to connect the weather station to raspberry pi I followed instruction provided in : https://www.hackster.io/windowsiot/build-hands-on-lab-iot-weather-station-using-windows-10-5b818f
. we need a Ribbon cable to connect them.
I have took some picture on which port of raspberry pi 3 should be connected to weather station ports
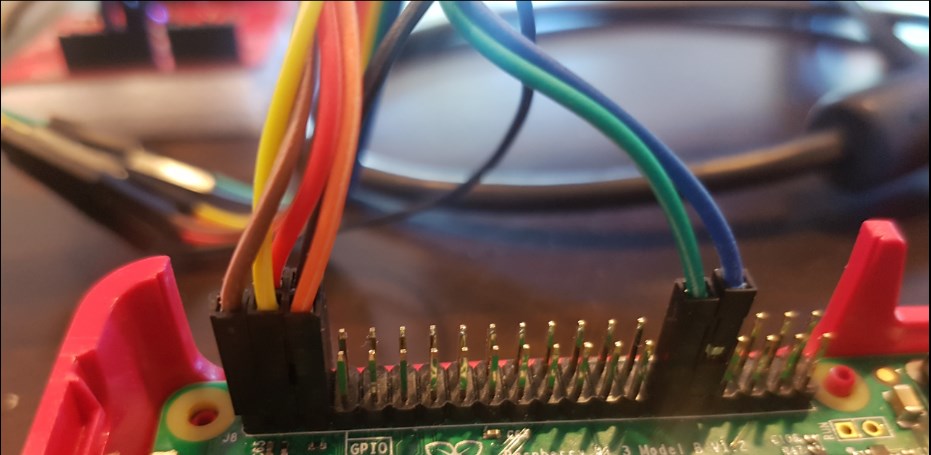
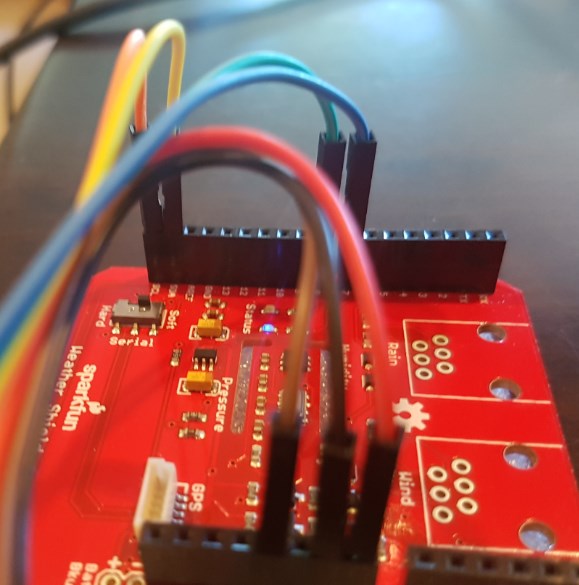
after connecting the weather station to raspberry pi 3, now we should sent the message from weather station sensors to raspberry pi and then from raspberry pi to Cortana.
In the next posts, I will explain the below process. In part 2 the connection of weather station to raspberry pi and the process of creating event hub in Cortana will be explained. In part3, the process of creating stream analytics and showing the data in power Bi and Azure Ml will be shown.
[1]https://www.hackster.io/windowsiot/build-hands-on-lab-iot-weather-station-using-windows-10-5b818f