Published Date : September 26, 2016
You can filter all visuals in Power BI except Slicer! In fact slicer itself is a type of filter, however there are some times that number of items in slicer is too many. So this is normal that we want to filter the items in the slicer itself. Unfortunately current version of Power BI Desktop doesn’t support visual level filter on slicer, and I’m sure this feature will come soon. However in the meantime here is a work around for filtering slicers using calculated tables. If you want to learn more about Power BI, read Power BI online book; from Rookie to Rock Star.
The idea of this blog post came from a question that one of students in my Power BI course asked to me, and I’ve found this as a high demand in internet as well. So I’ve decided to write about it.
You might have too many items to show in a slicer. a slicer for customer name when you have 10,000 customers isn’t meaningful! You might be only interested in top 20 customers. Or you might want to pick few items to show in the slicer. With all other visual types (Such as Bar chart, Column chart, line chart….) you can simply define a visual level filter on the chart itself. Unfortunately this feature isn’t supported at the time of writing this post for Slicers. However the demand for this feature is already high! you can see the idea published here in Power BI user voice, so feel free to vote for such feature 🙂
The work around in this post might get dated very soon because I expect Power BI team to fix this soon, however in the meantime this workaround will help some people I believe.
There are number of workarounds for this challenge;
I have written a blog post about what Calculated tables are and how to use them for features such as role playing dimensions in Power BI, and fetching filtered views such as top 20 customers. I strongly encourage you to read that post to learn about usages of calculated tables. In summary calculated tables are DAX generated tables, these tables will be part of the model, and can have relationship with other tables in the model.
For filtering data in a slicer I thought using calculated tables for such filtering. I know it won’t be that easy filtering. and I would need to write a bit of DAX instead of picking items from a list, but at least I have full DAX features to use and create whatever filter I want. Once we create the filtered view as a calculated table, then we can create relationship between that table and other tables, and use it in the slicer. Let’s go through that with an example.
For running this example you need to download and install AdventureWorksDW database from here.
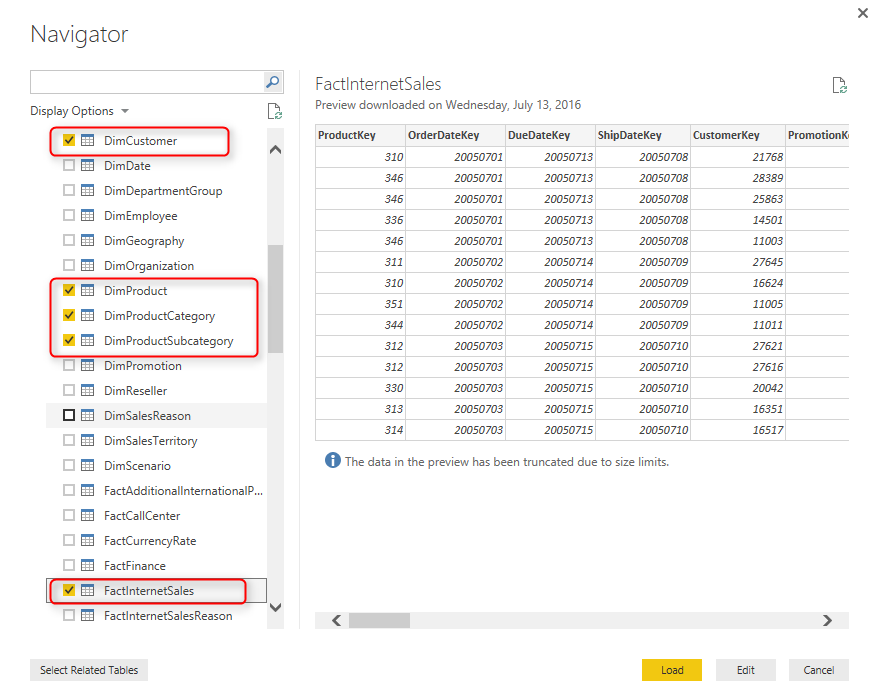
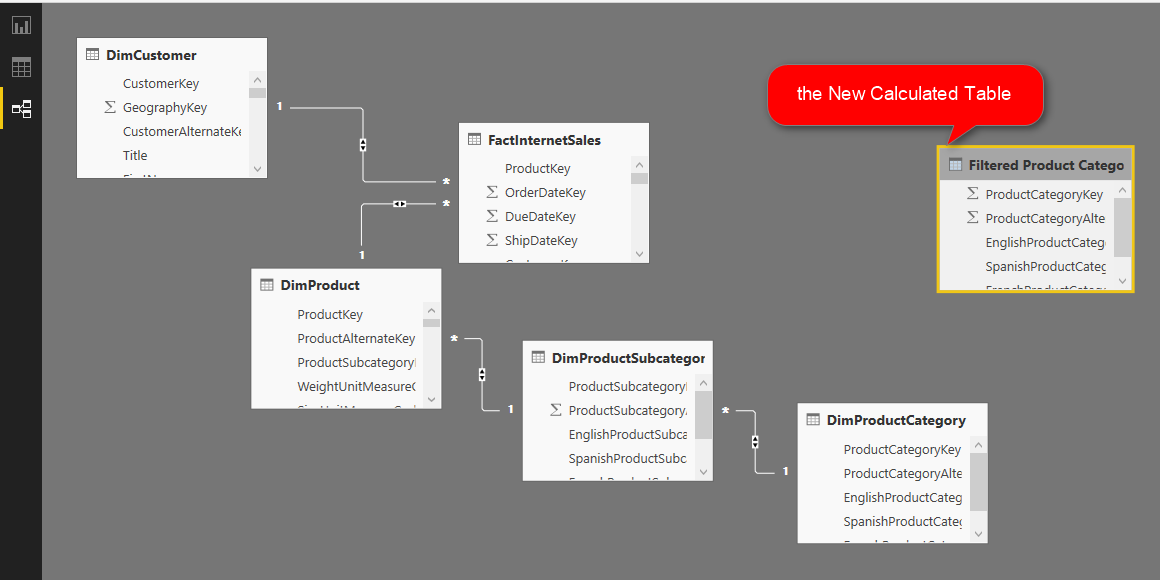
Start with Get Data from AdventureWorksDW database, and choose these tables to import: FactInternetSales, DimProduct, DimProductSubCategory, DimProductCategory, and DimCustomer.
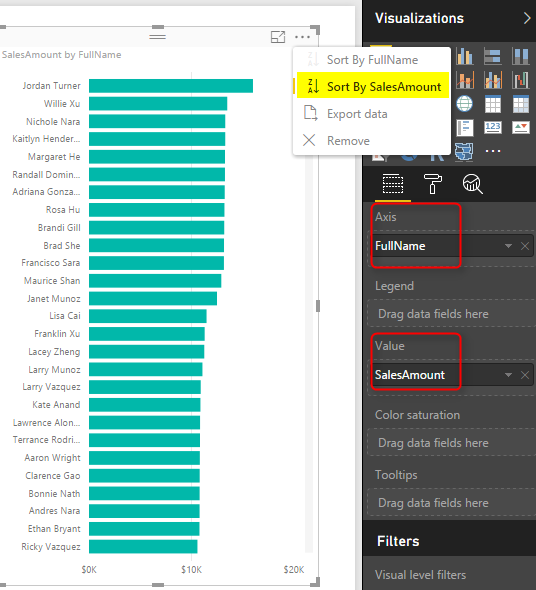
Click on Load, and then build a bar chart with Full Name from DimCustomer as Axis, and SalesAmount from FactInternetSales as Value. Also sort the chart by SalesAmount in descending order.
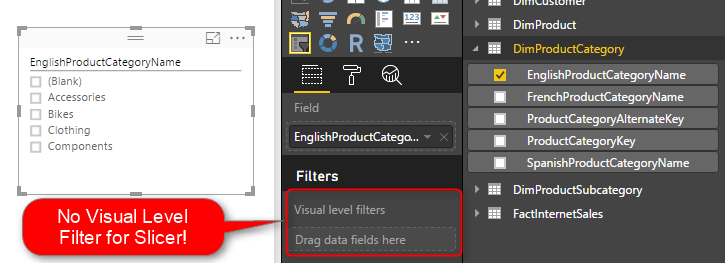
Then Create a Slicer with EnglishProducctCategoryName from DimProductCategory. Note that if you drag and drop something into visual level filter it won’t be placed there! in this version of Power BI Desktop Visual Level Filters are not supported for slicer! But don’t worry we will solve it with calculated tables.
Go to Data Tab, and from Modeling tab, choose Create Calculated Table

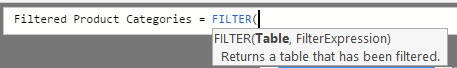
Let’s create a table for filtered list of product categories. As a simple example, let’s show everything except Bikes. I use FILTER function of DAX which gets a table to filter as the first parameter, and the expression as the second parameter.
Now set DimProductCategory as the table, and everything except Bikes as the expression as below;
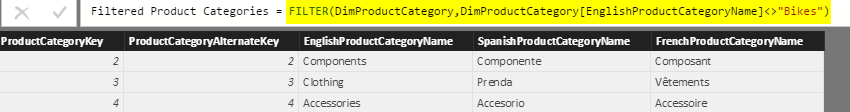
Here is the DAX code;
Filtered Product Categories = FILTER(DimProductCategory,DimProductCategory[EnglishProductCategoryName]<>"Bikes")
As you can see the filter simply selects everything but Bikes. After creating the table, go to Relationship tab
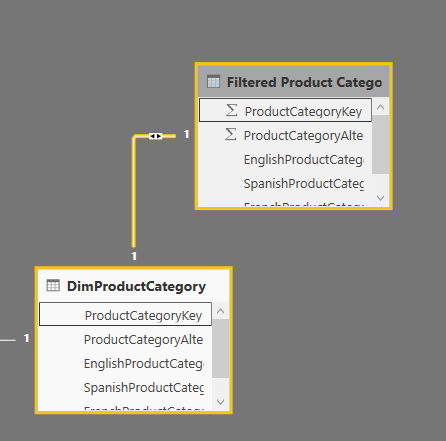
Create a relationship between DimProductCategory, and Filtered Product Category based on ProductCategoryKey.
Now go back to the Report tab, and in the slicer use EnglishProductCategoryName from Filtered Product Category.
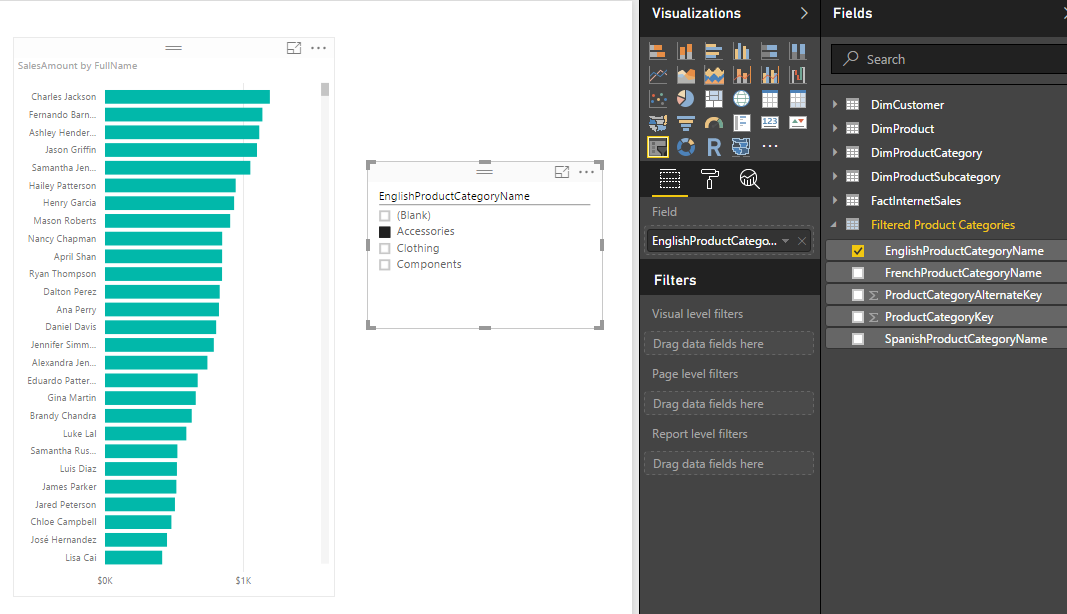
You can see that the slicer is now showing everything but Bikes. Other elements in the report will show everything if slicer hasn’t filtered them yet. If slicer filter their data then they will show only filtered data.
The example I’ve showed you here was a very basic example of filter. DAX is fully featured language. you can define a very complex filter as well. Think about all possible filters you can create with calculated tables. things like top 10 customers, or any other filters that you cannot simply achieve with visual level filters are possible here.
Calculated tables can be created only if you use Import Data into Power BI. these are generated based on DAX functions, and are not available as DirectQuery.
Calculated tables consumes memory, but you can reduce it with selecting minimum number of columns in calculated tables, and some DAX performance tuning considerations.
In summary I explained to you how to create a visual level filter on a slicer using calculated tables. This method might not be as easy as picking some items from a list in a visual level filter section of the report, but it is very powerful because it uses DAX filtering for generating calculated tables. creating filters such as top 10 customers are possible here with DAX expressions. There are some limitation though, DAX is only supported if you import data into Power BI. the DirectQuery don’t support calculated tables.