
Published Date : March 23, 2016
Power BI utilizes two built-in map charts; Map and Filled Map. Filled Map is a map that shows data points as Geo-spatial areas rather than points on map. Areas can be continent, country, region, state, city, or county. Working with Filled Map however isn’t as easy and convenient as the map chart is. You need to set the data category of fields in the data model appropriately to get the Filled Map working correctly. There are also some limitations in filled map with countries that address hierarchy is different from State, City, County. In this post I’ll get you through some tips of using filled map in your Power BI solution. I also show you some existing issues in the current version of filled map and things that you need to be aware of when you work with this visualization element.
As I mentioned earlier working with filled map requires a bit more steps than the regular map. Let’s go through that with a real example; This Wikipedia page includes list of all regions in New Zealand with their population. So let’s create a filled map for this data to show areas with their population.

I can use Get Data -> From Web and use the URL of the Wikipedia page to explore the data set. I can remove some extra columns and rows in Query Editor window easily (If you don’t know how to work with Query Editor read the Power Query introduction part of this Power BI series). I also add a custom column called Full Region with the country name attached to the end of region name (because there might be another Auckland in another country which is not what I want to show in my map). So here is what I have at my query at the end:

Now if I directly use Region Full in a Filled Map, I’ll see an error message that says; More location data is required to create a filled map. Click to learn more.
Details: To create a filled map, the location data should include Bing Map-supported geographic data, such as country/region, state/province, or postal code.

Configuring a data field as a geographic field is easy; All I need to do is to go to Data Tab. click on my query, and then on my data field. Then from the Modeling tab under the Properties pane set Data Category to State or Province.

After the change when I get back to the Filled map I can see that it illustrates regions on the map nicely.
As you see in the Data Category options you can set the field to be Continent, Country/Region, State or Province, City, County, Post Code…. If you have the geographic values in your data set then you can easily map them to these data categories and filled map will draw them nicely for you.
I’m living in New Zealand (if you don’t know know it already ;)) and the geographic structure here is different from State, City, County. What we have is more like Country, Region, District, Suburb. for example: Country= New Zealand, Region= Auckland, District =Franklin, Suburb= Pukekohe. You’ve seen in example above that I used State or Province data category for Region and it worked fine. So I thought I can map District to the City data category as well, but Here is what I get when I map cities in Auckland to a City data category:

However when I change data category to County I get it working (not perfect though! there are some white spots in the map!);

and Here is the category I choose for it:

So as you see I have to play with to map my data fields to a data category which generates a result close to what it is. And as you see I don’t get a clean result. I see an area (Papakura) in the map above which is white (no data points) which should be drawn as part of one of Districts (Manukau City). I did a search on Google Map and Bing Map to see if they can show me boundaries of districts, and found out that they can’t. Here is what Google Map shows me:

And here is what the actual boundaries should be (from Wikipedia)

The orange area in map above is much bigger than the area mentioned in Google Map. So no wonder why Power BI shows some areas blank. So I can’t blame Power BI, because it seems to be related to the boundaries definition in Bing maps which is not up-to-date. However at the end of the day this won’t give me the result I’m looking for.
Believe it or not, there are some situations that you can’t find any appropriate data categories to map to your geographic data field. This might not happen in USA geographic information, but I found it when I tried to go one level down to the Suburb level. The sad fact is that I couldn’t find a data category that maps to suburbs in some areas in New Zealand! Here is what I’ve done;

I’ve mapped suburbs to County because that was the lowest level I’ve found in data category for geographic information. (Place and Address cannot be used for Filled Map at the time or writing this post). and I got Nothing! Not event a small area on the map. I’ve tried then removing the district and putting suburb, region, country format with County as the data category which didn’t helped again.
I’ve found that I can map some locations based on Postal Code as you see below. However not Postal Code is not always good distinguishing field for a region, as multiple regions might have a postal code shared.

Then I tried to find Latitude and Longitude of each suburb in Bing Maps and use that for Filled Map, but I’ve found that Lat and Long fields in Filled Map isn’t working in the way they supposed to work!

There was no other method I could try to map suburbs with Filled Map unfortunately. So the sad end of this experiement is that with the current version of Filled Map I cannot show some suburbs with Filled Map.
Filled Map is good visualization element but it has some limitations. You can use it for areas which their boundaries are clear, such as Country, Region, States. However when geographic structure is different from built-in structure in Data Category types, then you might face some difficulties and won’t be able to generate the visualization you want. I hope Microsoft BI team fix issues related to this graph soon (And I believe they will, because they did a really good job in Power BI extensive improvement through past months). If you want to learn more about Power BI feel free to read rest of Power BI online book from Rookie to Rock Star.
Published Date : March 7, 2017
I have previously written some blog posts about Map visuals in Power BI. One of them was specifically about Filled Map, titled as Filled Map; the Good, the Bad, the Ugly! Why? you need to read that post to find the reason. In this post I want to explain the power of Shape Map which is one of the visuals Power BI team published recently. This visual is still at preview mode at the time of writing this post. This visual is much more powerful than what it looks. The actual power behind it is that you can have your own map added to it. Let’s take a closer look at this visual with an example. If you want to learn more about Power BI; read Power BI from Rookie to Rock Star.
There are many ways to visualize something on Map in Power BI, some of it are as below;
I have written about them all expect last two. This post focus is on Shape Map, and in another post I’ll explain ArcGIS visual. Hopefully at the end I will write a post about comparison.
Shape Map is a visual first introduced few months ago with the ability to highlight regions (similar to Filled Map), and the power of adding your own map file to it. This feature makes it different from Filled Map, because the normal filled map visualize anything on a Bing map layer, and if for some reason it can’t find that geo location information result won’t be great with that. If you want to see an example of that, read this post; Filled Map, the good, the bad, the ugly! Don’t get me wrong; Filled Map is good at some stage, but there are better ways some other times.
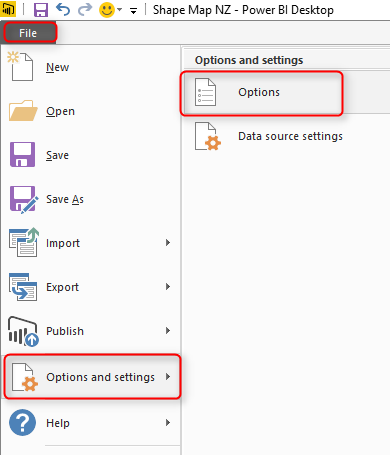
Because Shape Map is still in preview mode (at least at the time of writing this post), you need to enable it in Options section of Power BI Desktop; From File Menu -> Options and Settings -> Options.
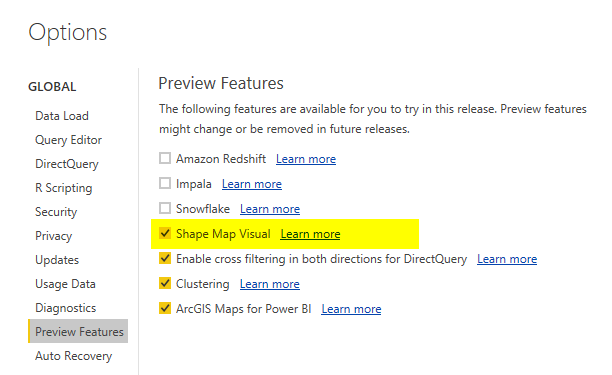
You need to select Shape Map in the list of Preview Features tab;
After clicking OK. you need to close your Power BI Desktop and re-open it again. You should be able to see Shape Map visual in list of your visuals now.

For this example I will be using an Excel file including all New Zealand regions and population of each region. Why New Zealand? Regions of New Zealand can’t fit great into filled map (I’ve explained it here), so it can be a very good example for Shape Map then. You can download all files for this demo here;
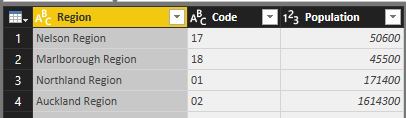
After enabling the preview feature of Shape Map, get the data from Regions Excel file, which includes data set as below;
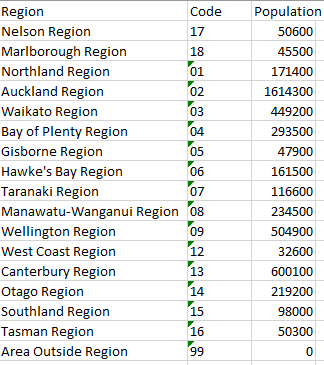
When you get data from Power BI Desktop from above data set, Power BI automatically change the data types to preferred data types. Make sure that you get correct data types; Region and Code should be Text, and Population should be Whole number;
Close and Apply query editor, and drag and drop a Shape Map visual in the report page. To get the first view of this visual, you need to drag and drop a field into it. Start with using Region as the Location, and Use Population as Color Saturation.

As you can see in above image, the first view would be States in USA, which is not exactly what we are looking for. The reason is that Shape Map works based on a predefined map. To select to map, go to Format of this visual, and expand Shape section.
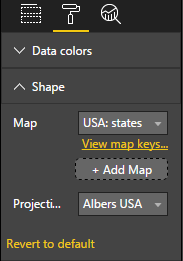
Now you can see that the default Map view is USA: States. You can simply change it to other maps in the list;
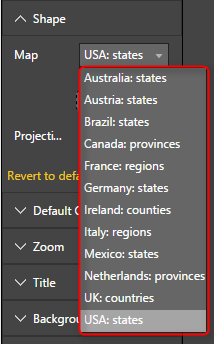
There are few maps/shapes in this list, but obviously there are many options missing. For example; New Zealand regional map is missing. Even if you want to use USA Cities Map, or Cities of a specific state in USA you can’t find it here. Don’t turn around with seeing that, Shape Map allows you to add your own Map. If your data set is dealing with any of existing maps, then you don’t need to add a custom map for it. Just use the related map, and you are good to go. If your map is not there, here is the guide to add it;
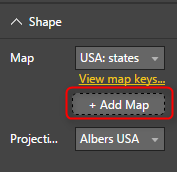
Shape Map allows you add your own custom map! For using this option you need to simply click on Add Map in Shape section of Format of this visual.
The map should be a TOPO JSON file. TOPO JSON is a standard for defining geo location information. in this type of file, information such as boundaries of each region and name/id can be stored. Here is an example TOPO JSON content;

As you can see in the above screenshot, information such as boundaries of each region plus region information listed in the file with JSON format. Don’t panic! You don’t need to write JSON to create this file, there are much easier ways;
Normally you can easily find Shape files of every map over internet. For example, here is where I have found Shape files for New Zealand Region map;
https://koordinates.com/layer/4240-nz-regional-councils-2012-yearly-pattern/download/
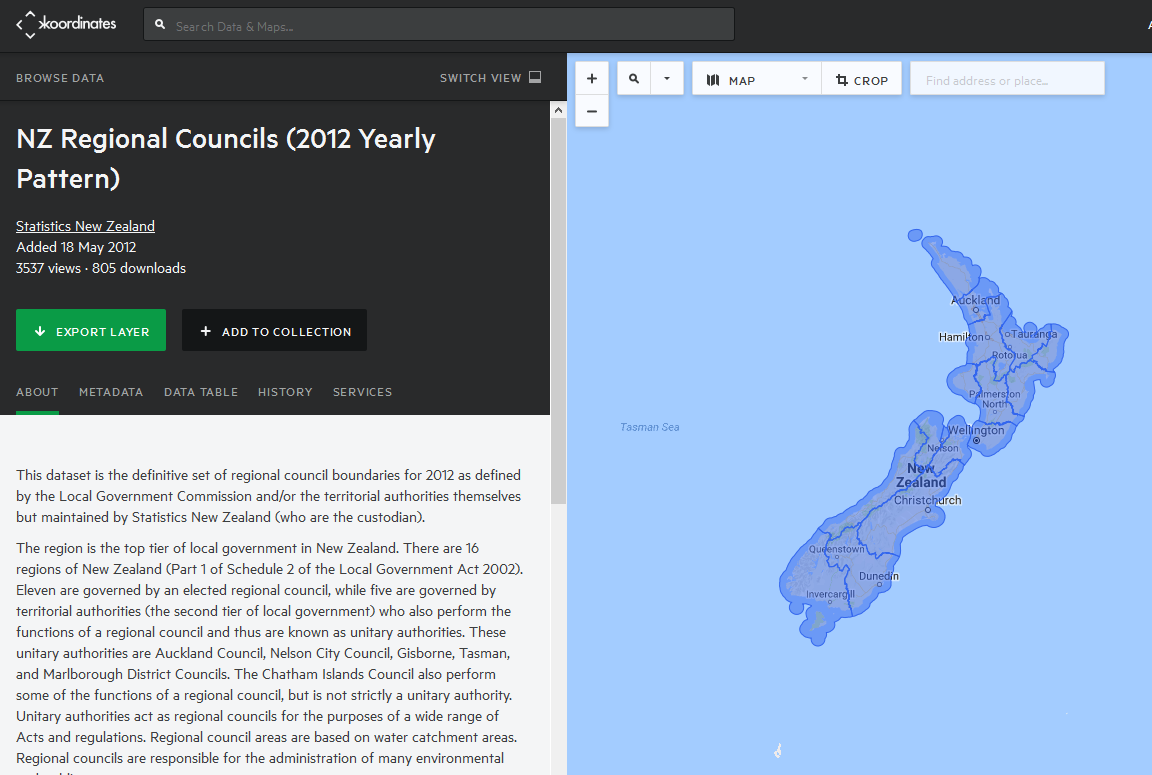
In the Koordinates.com website, you can find many other maps, and there are also heaps of other websites that give you Shape file for the map. Shape files cannot be used directly with Shape Map. Shape files are normally a zip file including a bunch of files;
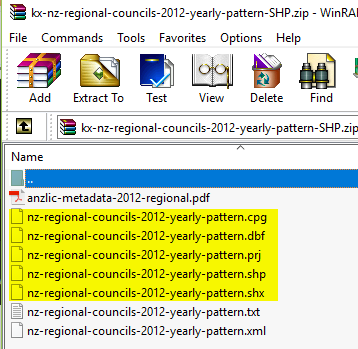
Not all files above are normally part of Shape file zipped directory, but normally .shp, .shx, and .dbf are. Once you have the shape file, you can easily convert it to TOPO JSON. there are heaps of converters for it. Here is one of them which one of students in my courses found it and works perfectly;
There are many websites that does the conversion of Shape File to TOPO JSON. as an example ShapeEscape does that perfectly;
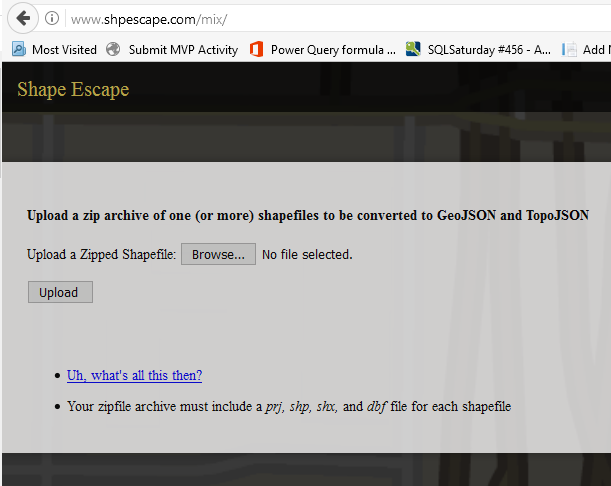
All you need to do is to upload shape file (the zip file including everything) into the website, and it will simply show you the map. make sure that you have selected TopoJSON map WITH attributes. To verify it; when you click on a region you should see a pop up text section showing name and id of that region (like screenshot below).

Maps can have variation of details, and depends on that the file size changes, you can select whatever details level you want. for this example, I took the most basic one with precision of 10,000. When you click on download, you can copy the entire JSON code into a text file, and put a .JSON extension for it.
Now you can simply add the custom map to Shape Map visual;

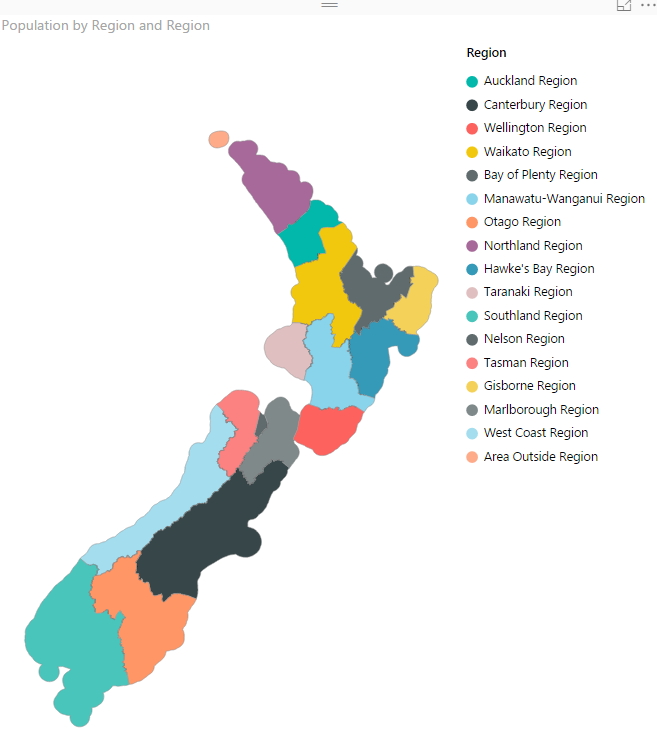
It will take few seconds for map to load, and then you will see your regional map visualized:
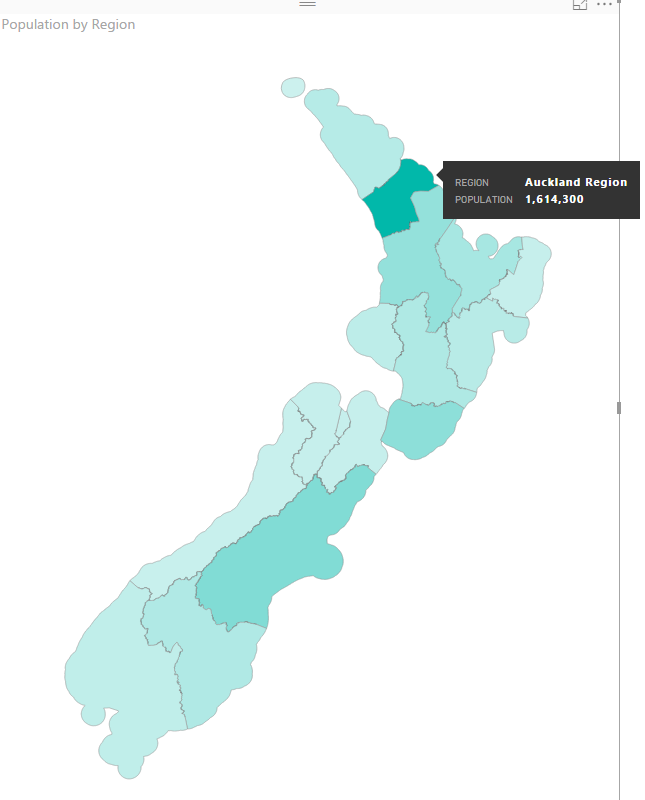
If you cannot see regions color coded, probably the attributes part of map file is missing. Verify that in Format -> Shape section with clicking on “View Map Keys”. You should see region names and their keys. If you see nothing, or names are not correctly populated, then try to convert shape file again (make sure that you get the converted file WITH attributes);

Shape Map despite its simplicity, is very powerful. Think about ability to add your own map, and that means no limit! All you need is just some tools to build your map, and convert it to Topo JSON format. There are many free or paid tools for it. There are however some limitations for this visual, which I hope get fixed before the general availability 🙂 Here are pros and cons in nutshell;
It is not common feature in Power BI map visuals, that you can add your own map. I have previously explained about SynopticPanel visual by OKviz which allows you to do that. However that is a custom visual, and this one is a built-in visual. and this one works with the Topo JSON standard of geo location.
This visual is still in preview mode, and it lacks of many features that can be available for map visuals. for example, you can specify different colors for every region through Legend. However drill down/up is not possible. You cannot add other layers of map to it (for example if you want to add heatmap, or bubbles to it).
In summary Shape map in my point of view is a powerful map visual for Power BI especially because of the feature to add your own map. Finding a map isn’t easy with help of Google and websites that does the conversion (such as ShapeEscape). This visual still has some limitations due to preview mode of it, which I believe will be sorted in next few months.
For this example I will be using an Excel file including all New Zealand regions and population of each region. Why New Zealand? Regions of New Zealand can’t fit great into filled map (I’ve explained it here), so it can be a very good example for Shape Map then. You can download all files for this demo here;
Save
Save
Save