
Published Date : September 10, 2018
Power BI is a mobile-friendly reporting solution. Every report that you generate can be viewed in the Mobile too. However, it doesn’t mean that the report is designed for mobile, or by other words; it doesn’t mean that is it a mobile report page. You have to make some changes, and take some extra considerations for your reports to be mobile reports. In this blog post, I’ll explain a few simple but very effective tips to take your Power BI report one level further for mobile devices. If you like to learn more about Power BI; read Power BI book from Rookie to Rock Star.
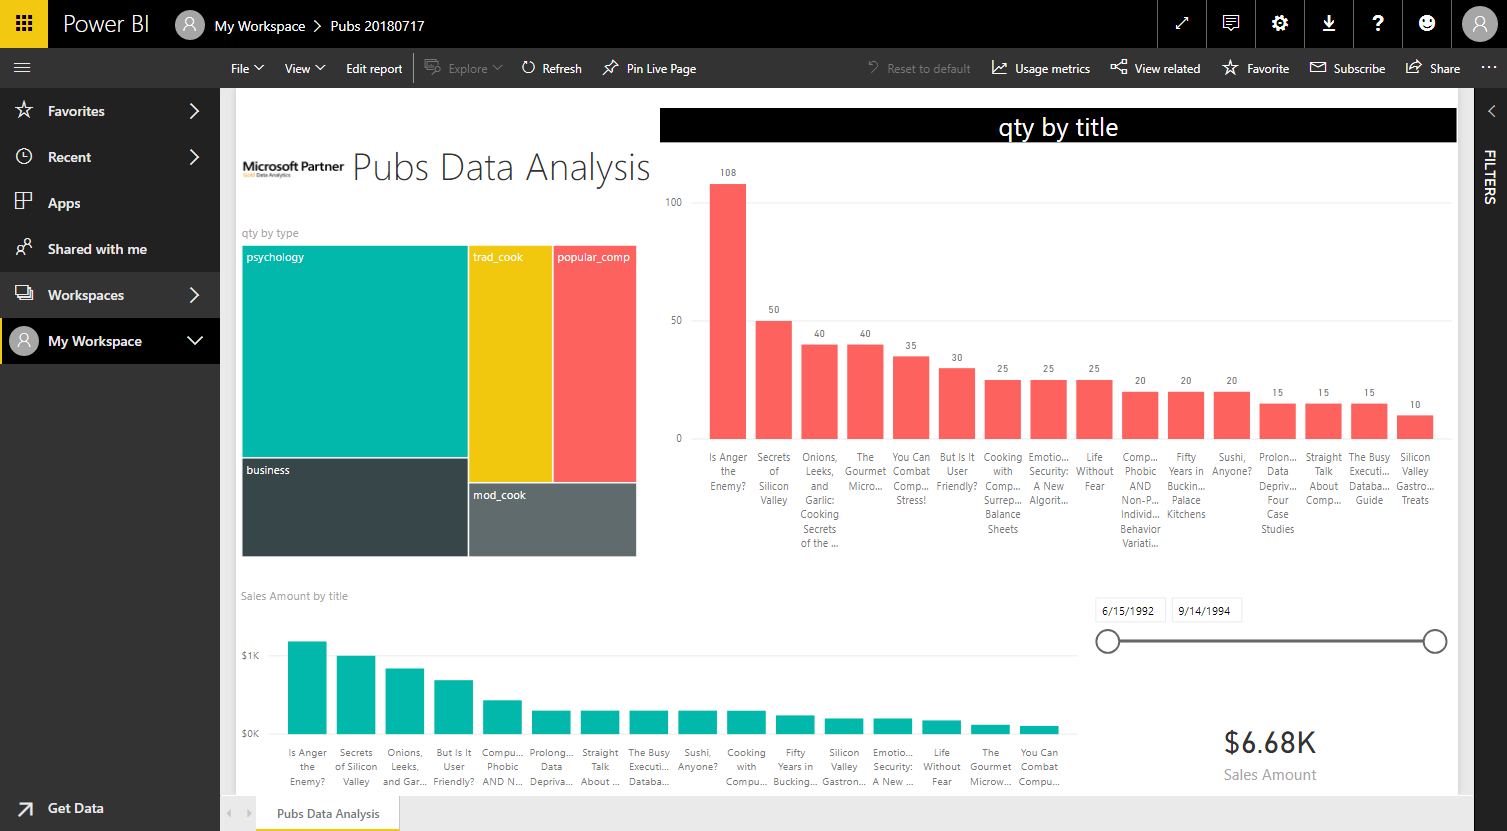
First, let’s have a look at Power BI Dashboards in a mobile device. Here I have a Power BI Dashboard, which looks like below in the web browser of a laptop;

If I look at the same report in Power BI Mobile app, I will see below;

As you can see, the layout of the mobile device for the dashboard is different than the web browser. The reason is that Power BI automatically creates a mobile layout for every dashboard. If you want to modify that layout and change it, you can go to the Power BI service (through a web browser), and click on Phone View.

Now you will be able to see what the phone view of the dashboard looks like, and change it by adding or removing items from it.

By making changes in this view, you can immediately see the impact of that in the Power BI dashboard in the mobile app.

Power BI dashboard have a default phone view, which can be adjusted with going to Phone view.
Power BI reports on mobile devices are a bit different than the dashboard. Let’s see how the experience for reports looks like. Below is the screenshot of the report in the Power BI service.
If you open this report in the mobile app of Power BI, it will look like the below screenshot;

Even if you hold your phone in upright portrait mode, it will still show the report in landscape mode. You have to turn your phone into landscape mode to see it properly. The reason is that this report is NOT designed for mobile. Power BI reports do not have a default mobile layout. Because this is the default view of the report, most of the people think that this is the mobile view of the report. In this view, as you can see, charts and slicers are smaller (it is a 6-inch small screen compared to a monitor by the way). This is not a good mobile design. You have to design your report to be more appropriate for mobile view. Here is how;
In the Power BI Desktop, Go to View tab, and select Phone Layout.

Now, you will see the Phone layout of the report, which is blank. The Power BI phone layout by default is blank, this is the reason that you have to see it in landscape mode by default. Now you will see the list of all visuals on the page in the right-hand side pane, and you can add them in the phone layout and size them as you want.

Here is a sample mobile design for this report;

After this design, you can go back to the Desktop layout, and publish the report. The newly published report will now have both views (mobile, and the desktop).
Consider creating the Phone layout for every page in the Power BI report file.
In the list of reports in the mobile app, you will see a small mobile icon, showing that this report has a mobile view too;
When you open the report in the mobile app, you will see it exactly as per design;

As you can see, the mobile design of this report looks much better than the default view. If you open the same report in a web browser or desktop, you will see the desktop view. Your report has two separate views now.
Power BI report does NOT have default mobile layout. You have to design the mobile layout of your report for every page.
Like many other visual pages, you have to consider a pattern that works best for your users. We are talking about mobile reports here, so some of the visual design hierarchies can be useful. This is not a post that we can go through all UX Design patterns. I just give you an example, Z-pattern is one of the most common designs;

A Z-Pattern design traces the route the human eye travels when they read — left to right, top to bottom:
When viewers’ eyes move in this pattern, it forms an imaginary “Z” shape like the above screenshot. It’s important to note that Z-Pattern designs are not required to conform to a traditional Z-Shape and the number of Z-Angles along the pattern can vary.
The above part about z-pattern is sourced from an article here: https://instapage.com/blog/z-pattern-layout
Here is how the z-pattern can be followed in a mobile report;

Creating mobile reports in Power BI is very simple. For the dashboard, there is a default view, which you can just adjust it to the desired layout. However, for a Power BI report, you have to create a phone layout for your report. It is recommended to create phone layout for all your report pages. With the increasing usage of mobile devices, and the number of mobile devices much more than desktop devices, this type of usage is something that you cannot overlook.