
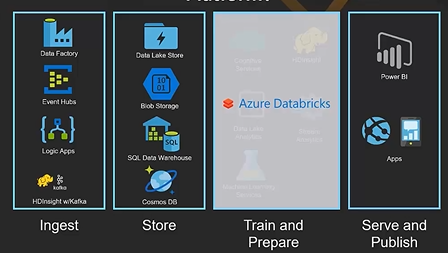
Databricks is an analytics service based on the Apache Spark open source project. Databricks has been used for ingesting a significant amount of data. In February 2018, there is integration between Azure and Databricks. This integration provides data science and data engineer team with a fast, easy and collaborative spark-based platform in Azure [1]. Azure Data bricks is a new platform for big data analytics and machine learning. The notebook in Azure Databricks enables data engineers, data scientist, and business analysts. In this post and next one, an overview of what is Azure Databricks will be provided, the environment will be shown, and how to use it for data science will be explained concisely.
Databricks Environment
Create Azure Databricks in Azure environment.Log into one of your accounts in Azure environment, create an Azure Databricks module.
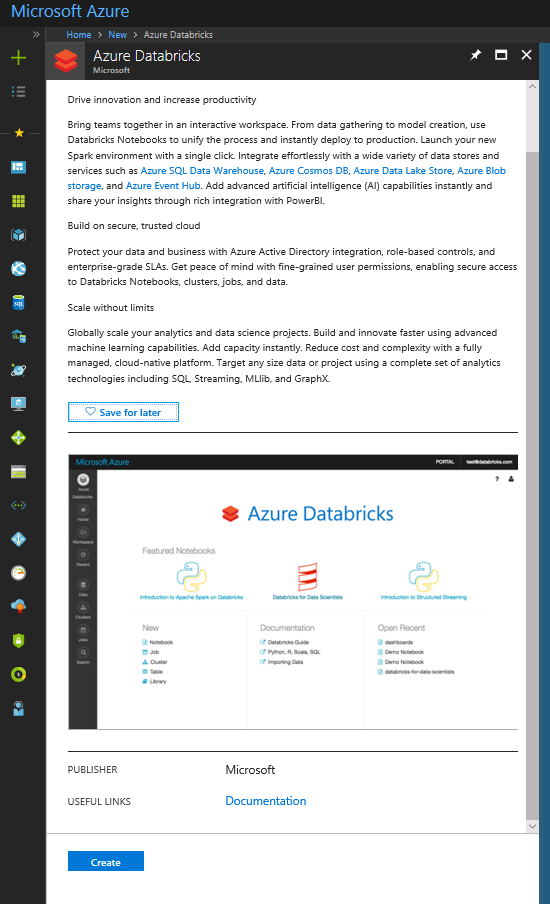
To access to the Azure Databricks click on the Launch Workspace.

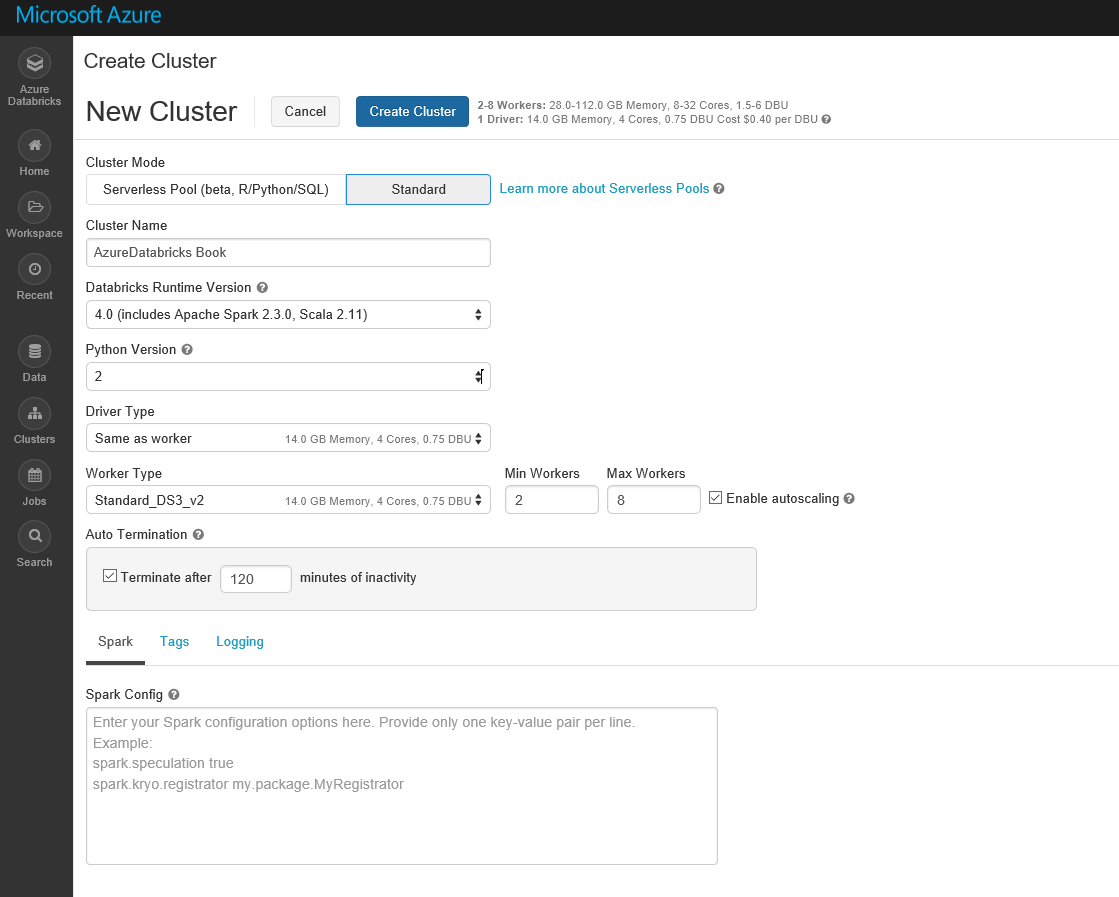
As you can see in the below picture, the Azure Databricks environment has different components. The main components are Workspace and Cluster. The first step is to create a Cluster. Clusters in Databricks provide a unified platform for ETL (Extract, transform, and load), stream analytics, and machine learning. The cluster has two types: Interactive and Job. Notebook clusters are used to analyze data collaboratively. However, Job clusters are used to run fast and robustly automated workload using API.

Cluster page may contain both cluster types. Each cluster able to have different nodes. To start you need to create a cluster. Click on the Create Cluster option. In the create cluster page, enter the information such as Cluster Name, Version (Default), Python Version, min and maximum workers and so forth.
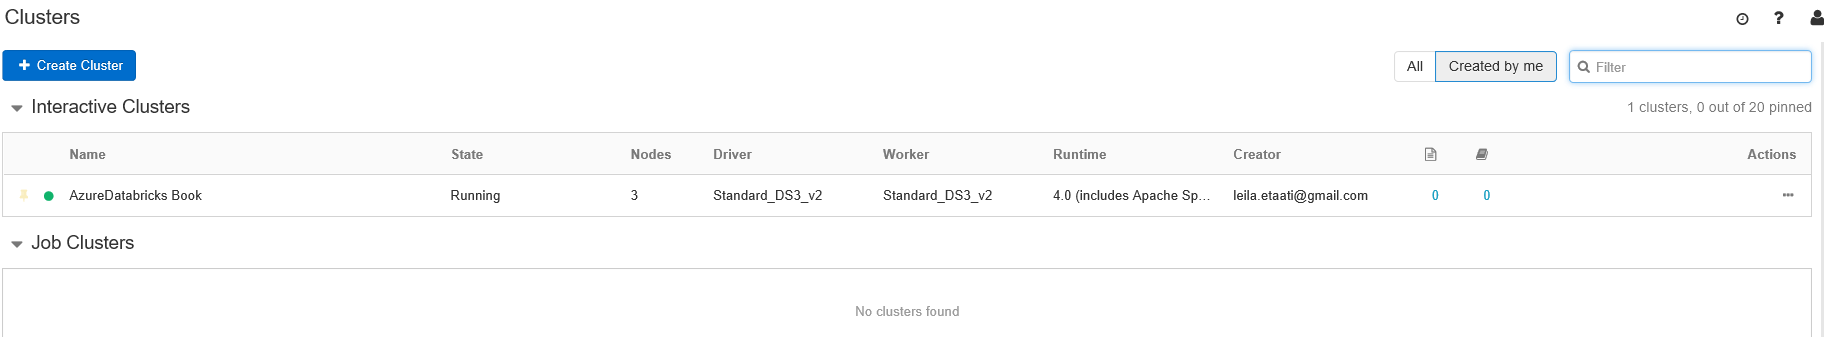
To use the Cluster, you should wait till the Status change to Running (Below picture). By creating an interactive cluster, we able to create a notebook to write the codes there and get the result quickly.
To create a notebook, click on the workspace option and create a new notebook.
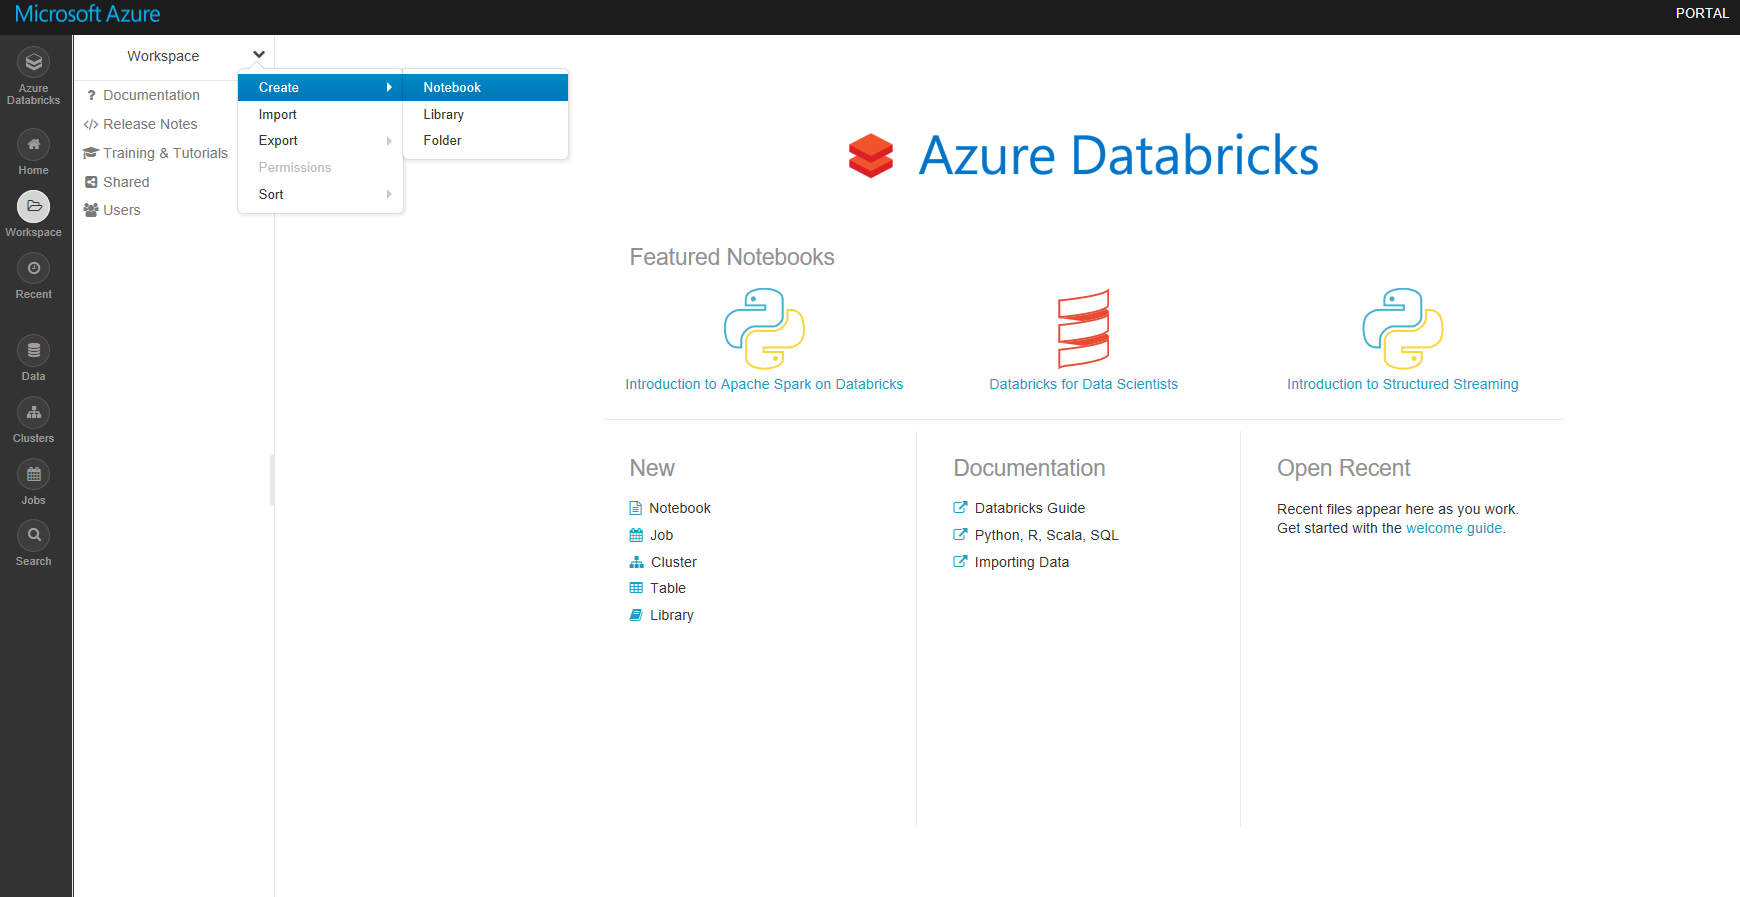
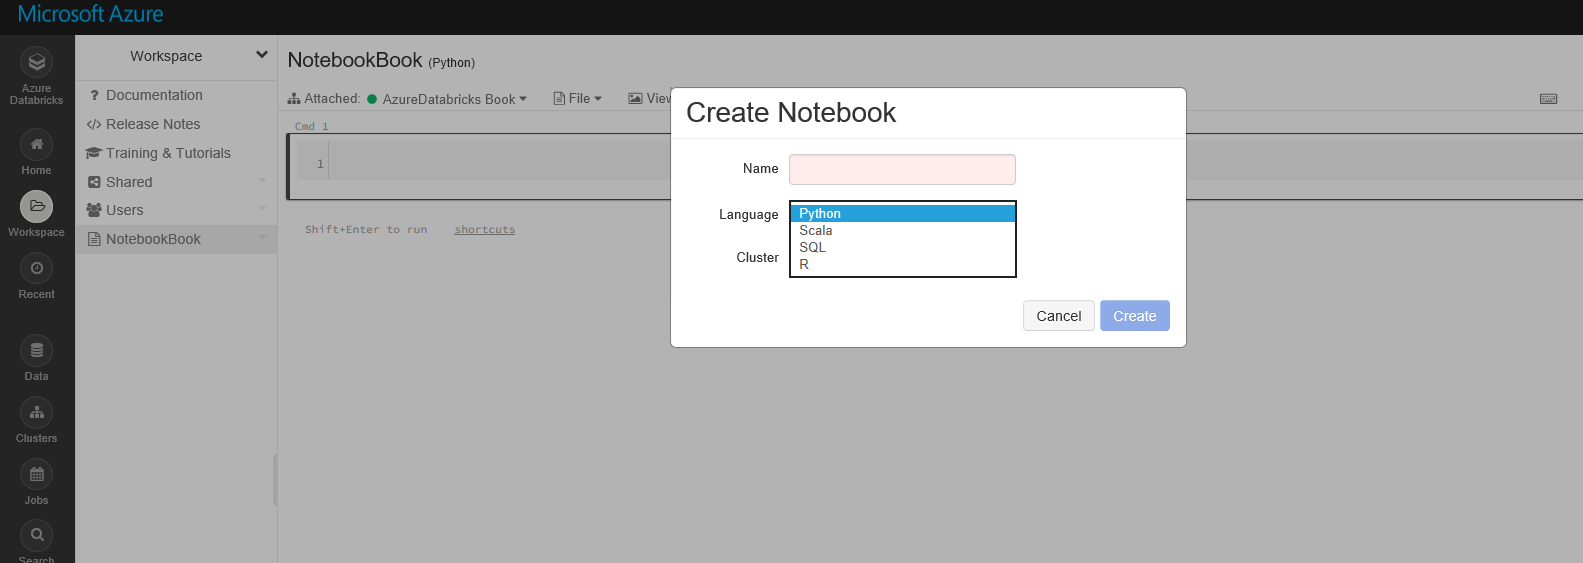
By creating a new notebook, you able to specify the notebook belong to which cluster, and what is the main language for the Notebook (Python, Scala, R, and SQL). In this example, R language has been selected as default. However, you able still to write other languages in the Notebook by writing: %scala. %python, %sql or %r before the scripts.
In the notebook by default, there is a place to write the codes. As you can see in below figure, there an editor with name cmd1 as a node to write the codes and run them all. In this example, there is only one node there and the primary language to write the code is R. In this example, we use the existing dataset in the gpplot2 package named mpg by writing below codes.
library(ggplot2)
display(mpg)
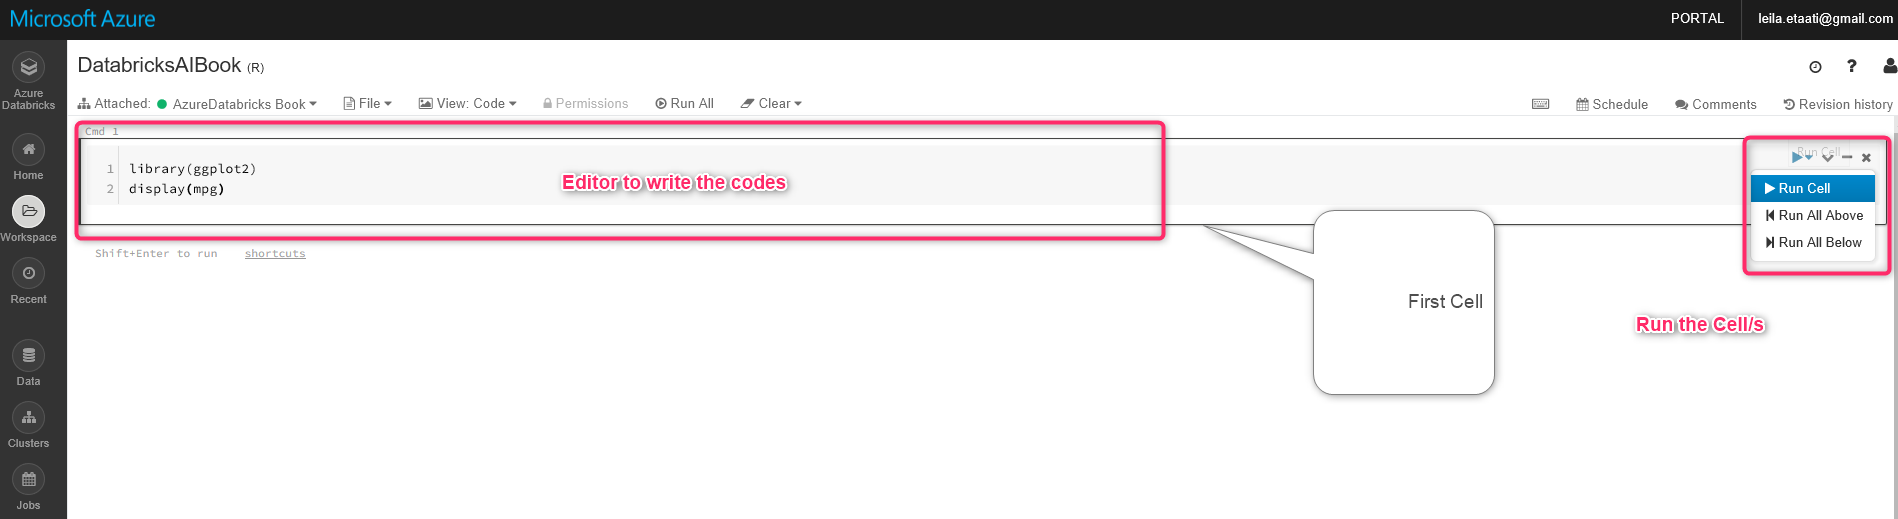
Display command, show the dataset in Databricks. To run the code, click on the arrow in the right side of the node and choose the Run Cell. After running the code, the result will appear at the end of the cell with table style.
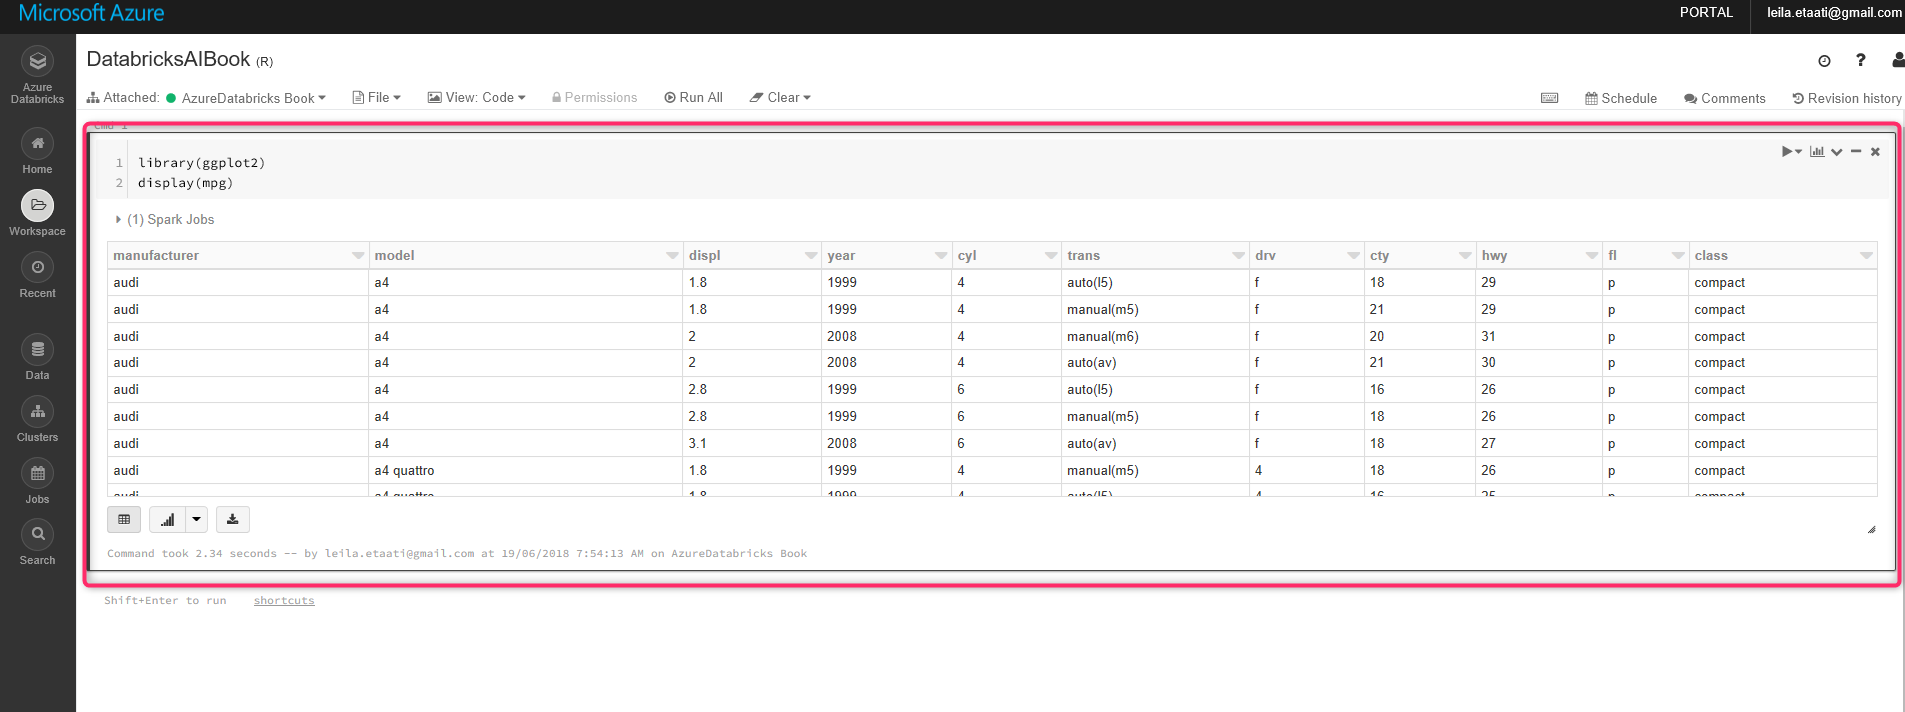
To show the chart, you need to click on the chart icon at the bottom of the cell.
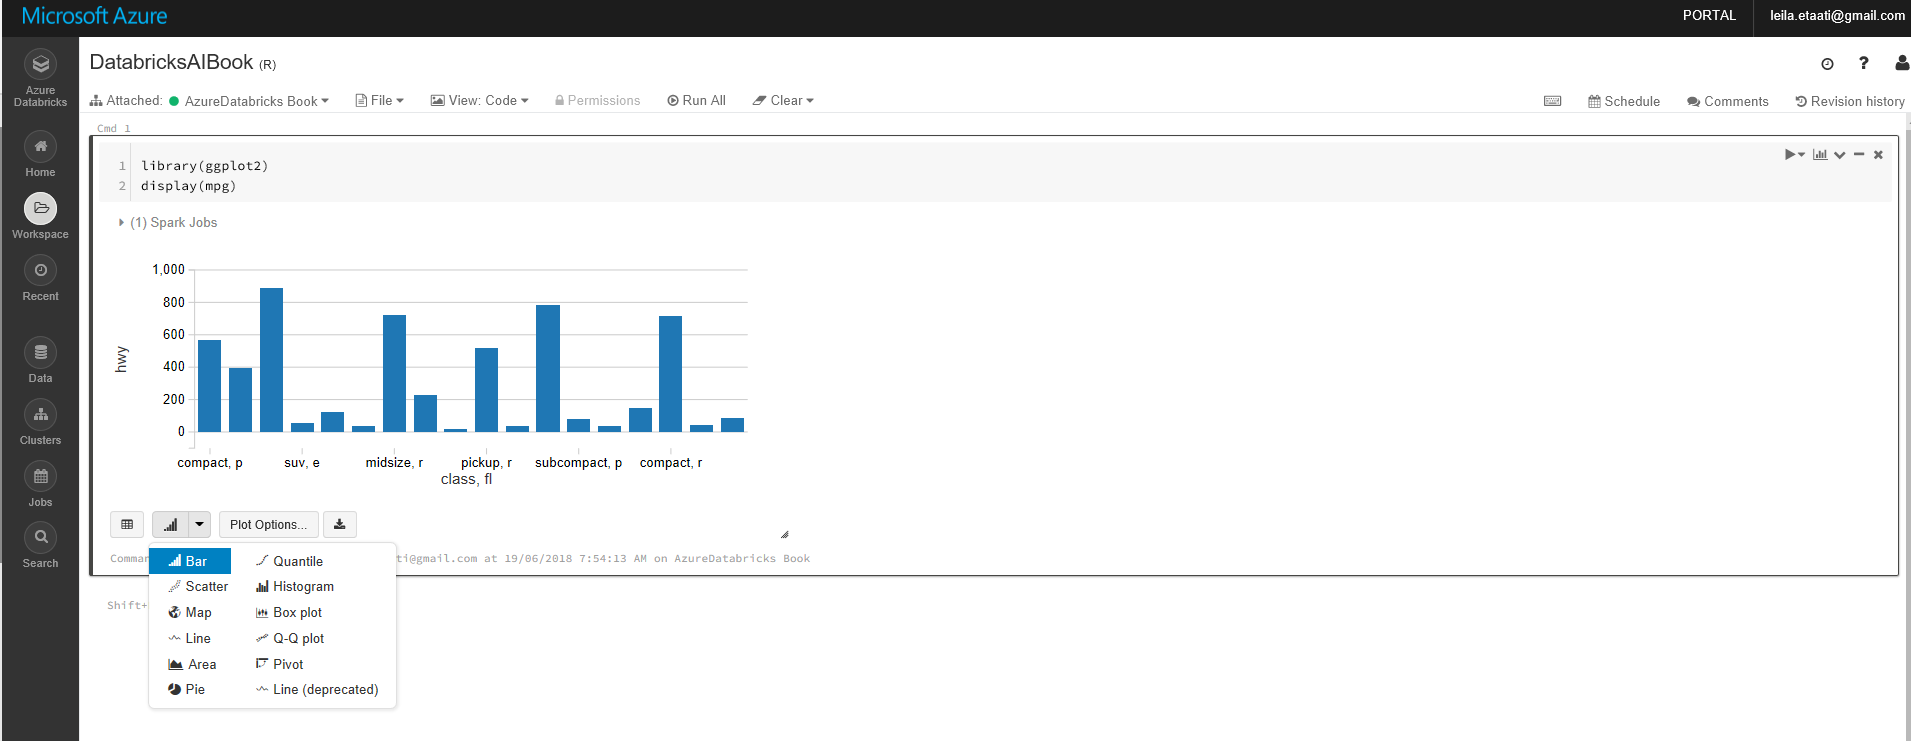
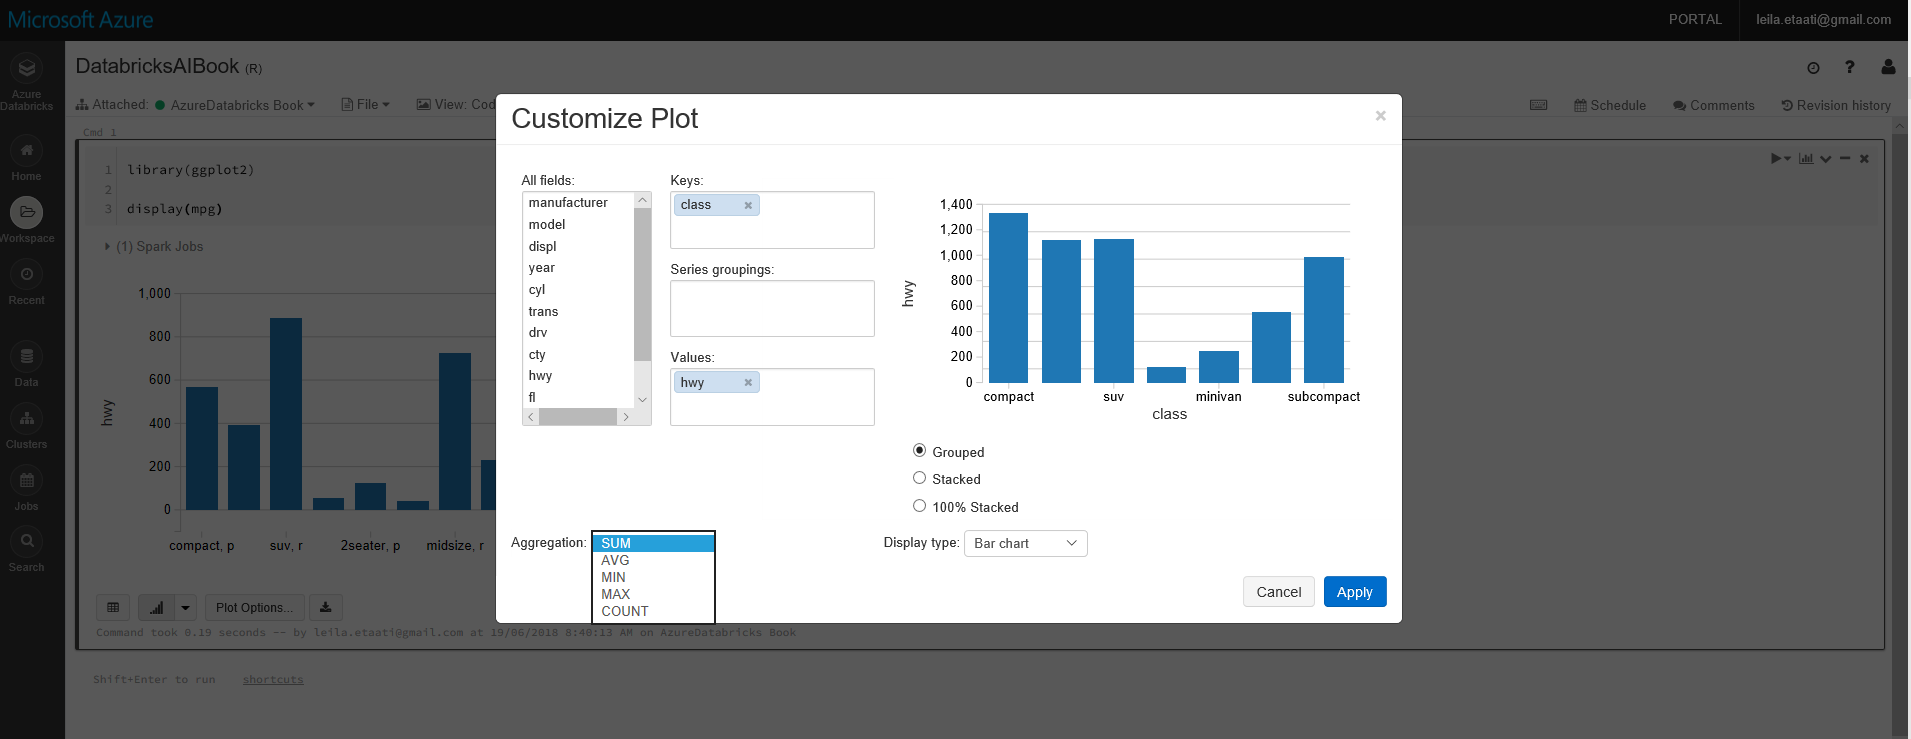
Also, you able to change the item that you want to show in the chart by clicking on the Chart Options.
This a very simple use case of Datbricks to run R scripts. In the next post I will show how to get data from Azure Data Lake Store, clean it with Scala language and then apply machine learning on it and finally show it in Power BI.


Happy to see and learn more about BI related topics.