
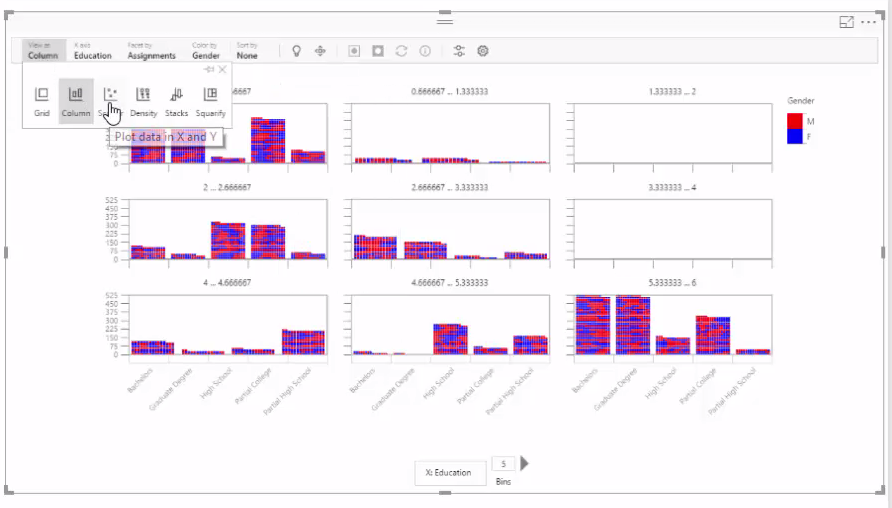
You’ve seen a number of custom visualizations of Power BI that we’ve used in Power BI online book previously. In this post you will learn through a quick video how SandDance custom visualization of Power BI can be used to visualize clustering result set of an Azure Machine Learning model. In this video I’ll start by using a clustering model in Machine Learning, and then the result set of this model will be feed into Power BI. Power BI SandDance visualization is a dynamic visualization that can demonstrate this data in multiple way. Watch the video to see this wonderful custom visual in action;


Trainer, Consultant, Mentor
Leila is the first Microsoft AI MVP in New Zealand and Australia, She has Ph.D. in Information System from the University Of Auckland. She is the Co-director and data scientist in RADACAD Company with more than 100 clients in around the world. She is the co-organizer of Microsoft Business Intelligence and Power BI Use group (meetup) in Auckland with more than 1200 members, She is the co-organizer of three main conferences in Auckland: SQL Saturday Auckland (2015 till now) with more than 400 registrations, Difinity (2017 till now) with more than 200 registrations and Global AI Bootcamp 2018. She is a Data Scientist, BI Consultant, Trainer, and Speaker. She is a well-known International Speakers to many conferences such as Microsoft ignite, SQL pass, Data Platform Summit, SQL Saturday, Power BI world Tour and so forth in Europe, USA, Asia, Australia, and New Zealand. She has over ten years’ experience working with databases and software systems. She was involved in many large-scale projects for big-sized companies. She also AI and Data Platform Microsoft MVP. Leila is an active Technical Microsoft AI blogger for RADACAD.
1 thought on “Azure Machine Learning with Power BI SandDance Visualization”