
In the last posts, I have explained how to install Azure ML workbench and how to run a sample and check the accuracy.
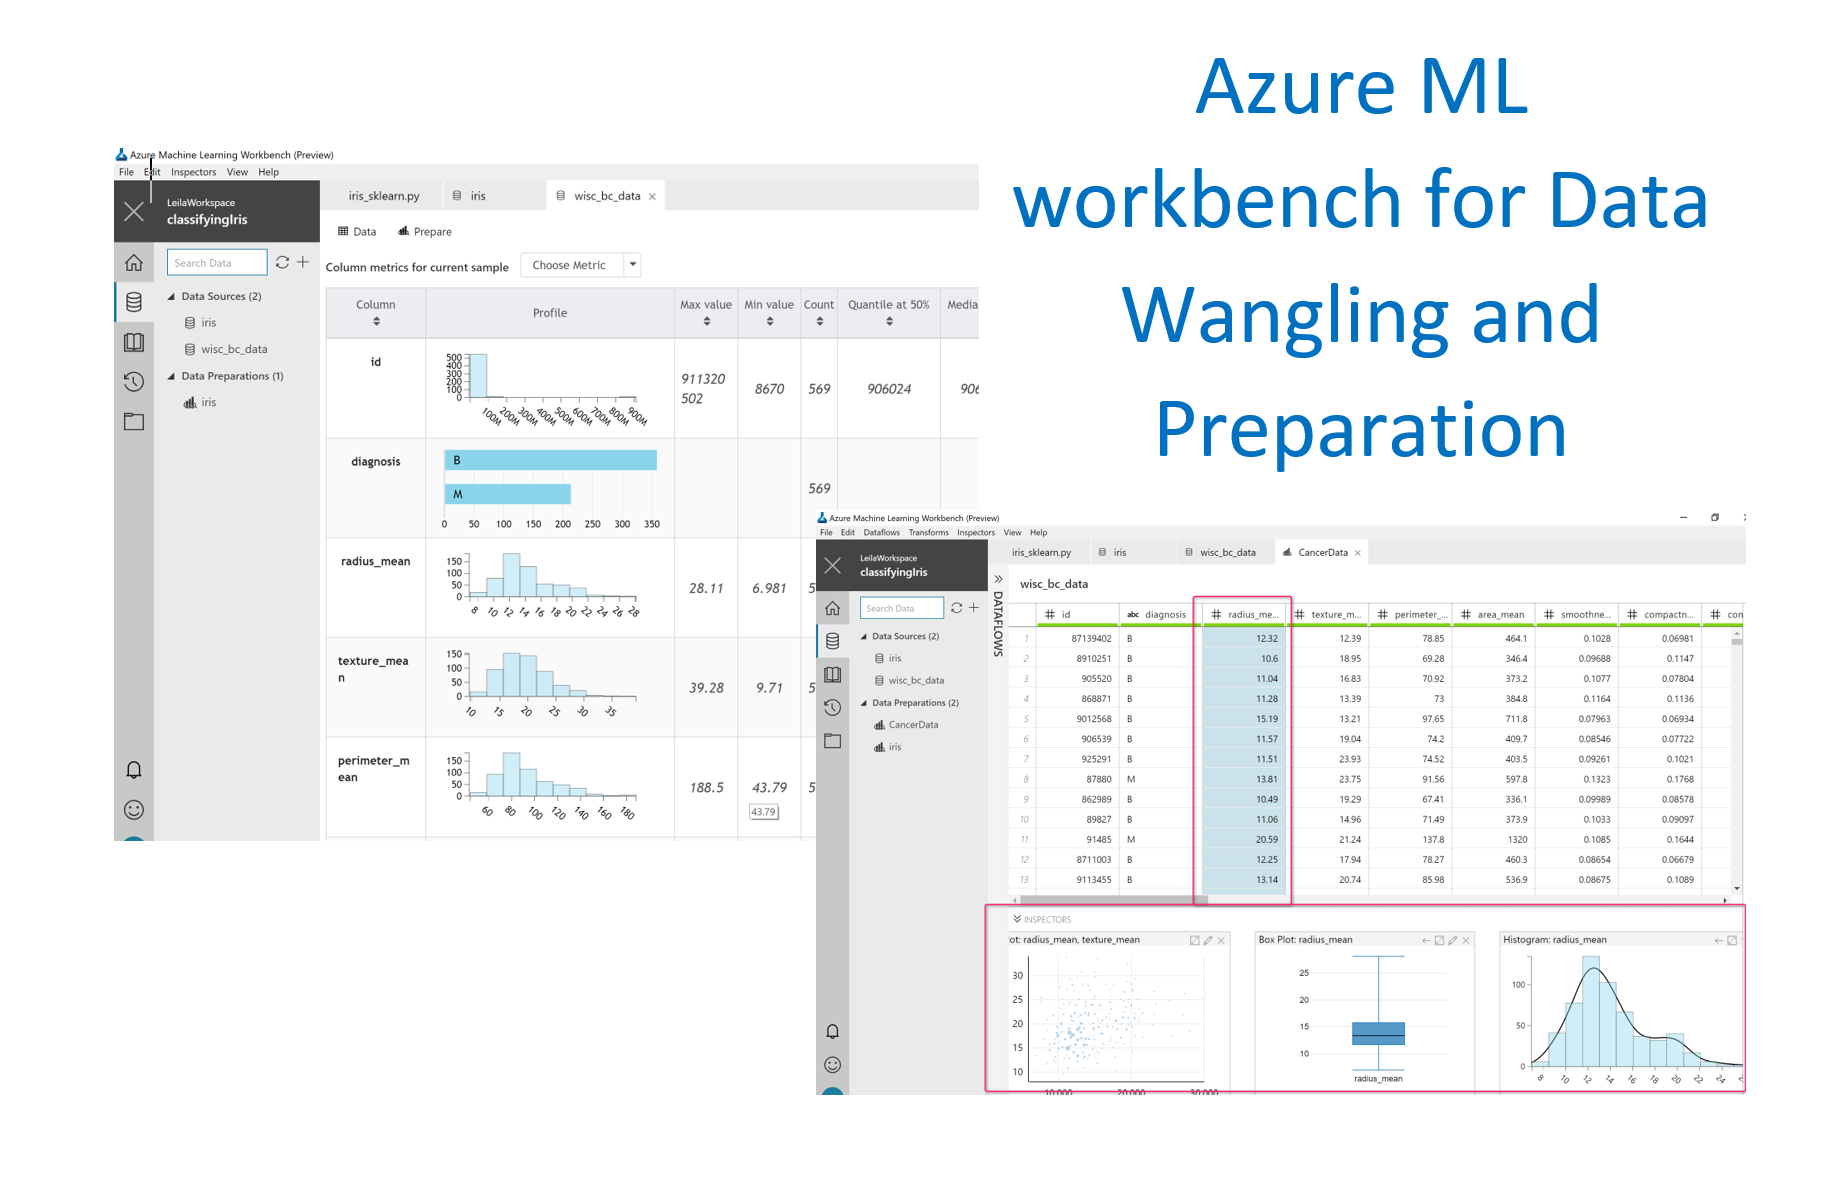
In this post, I am going to show how to do data wrangling using Azure ML workbench.
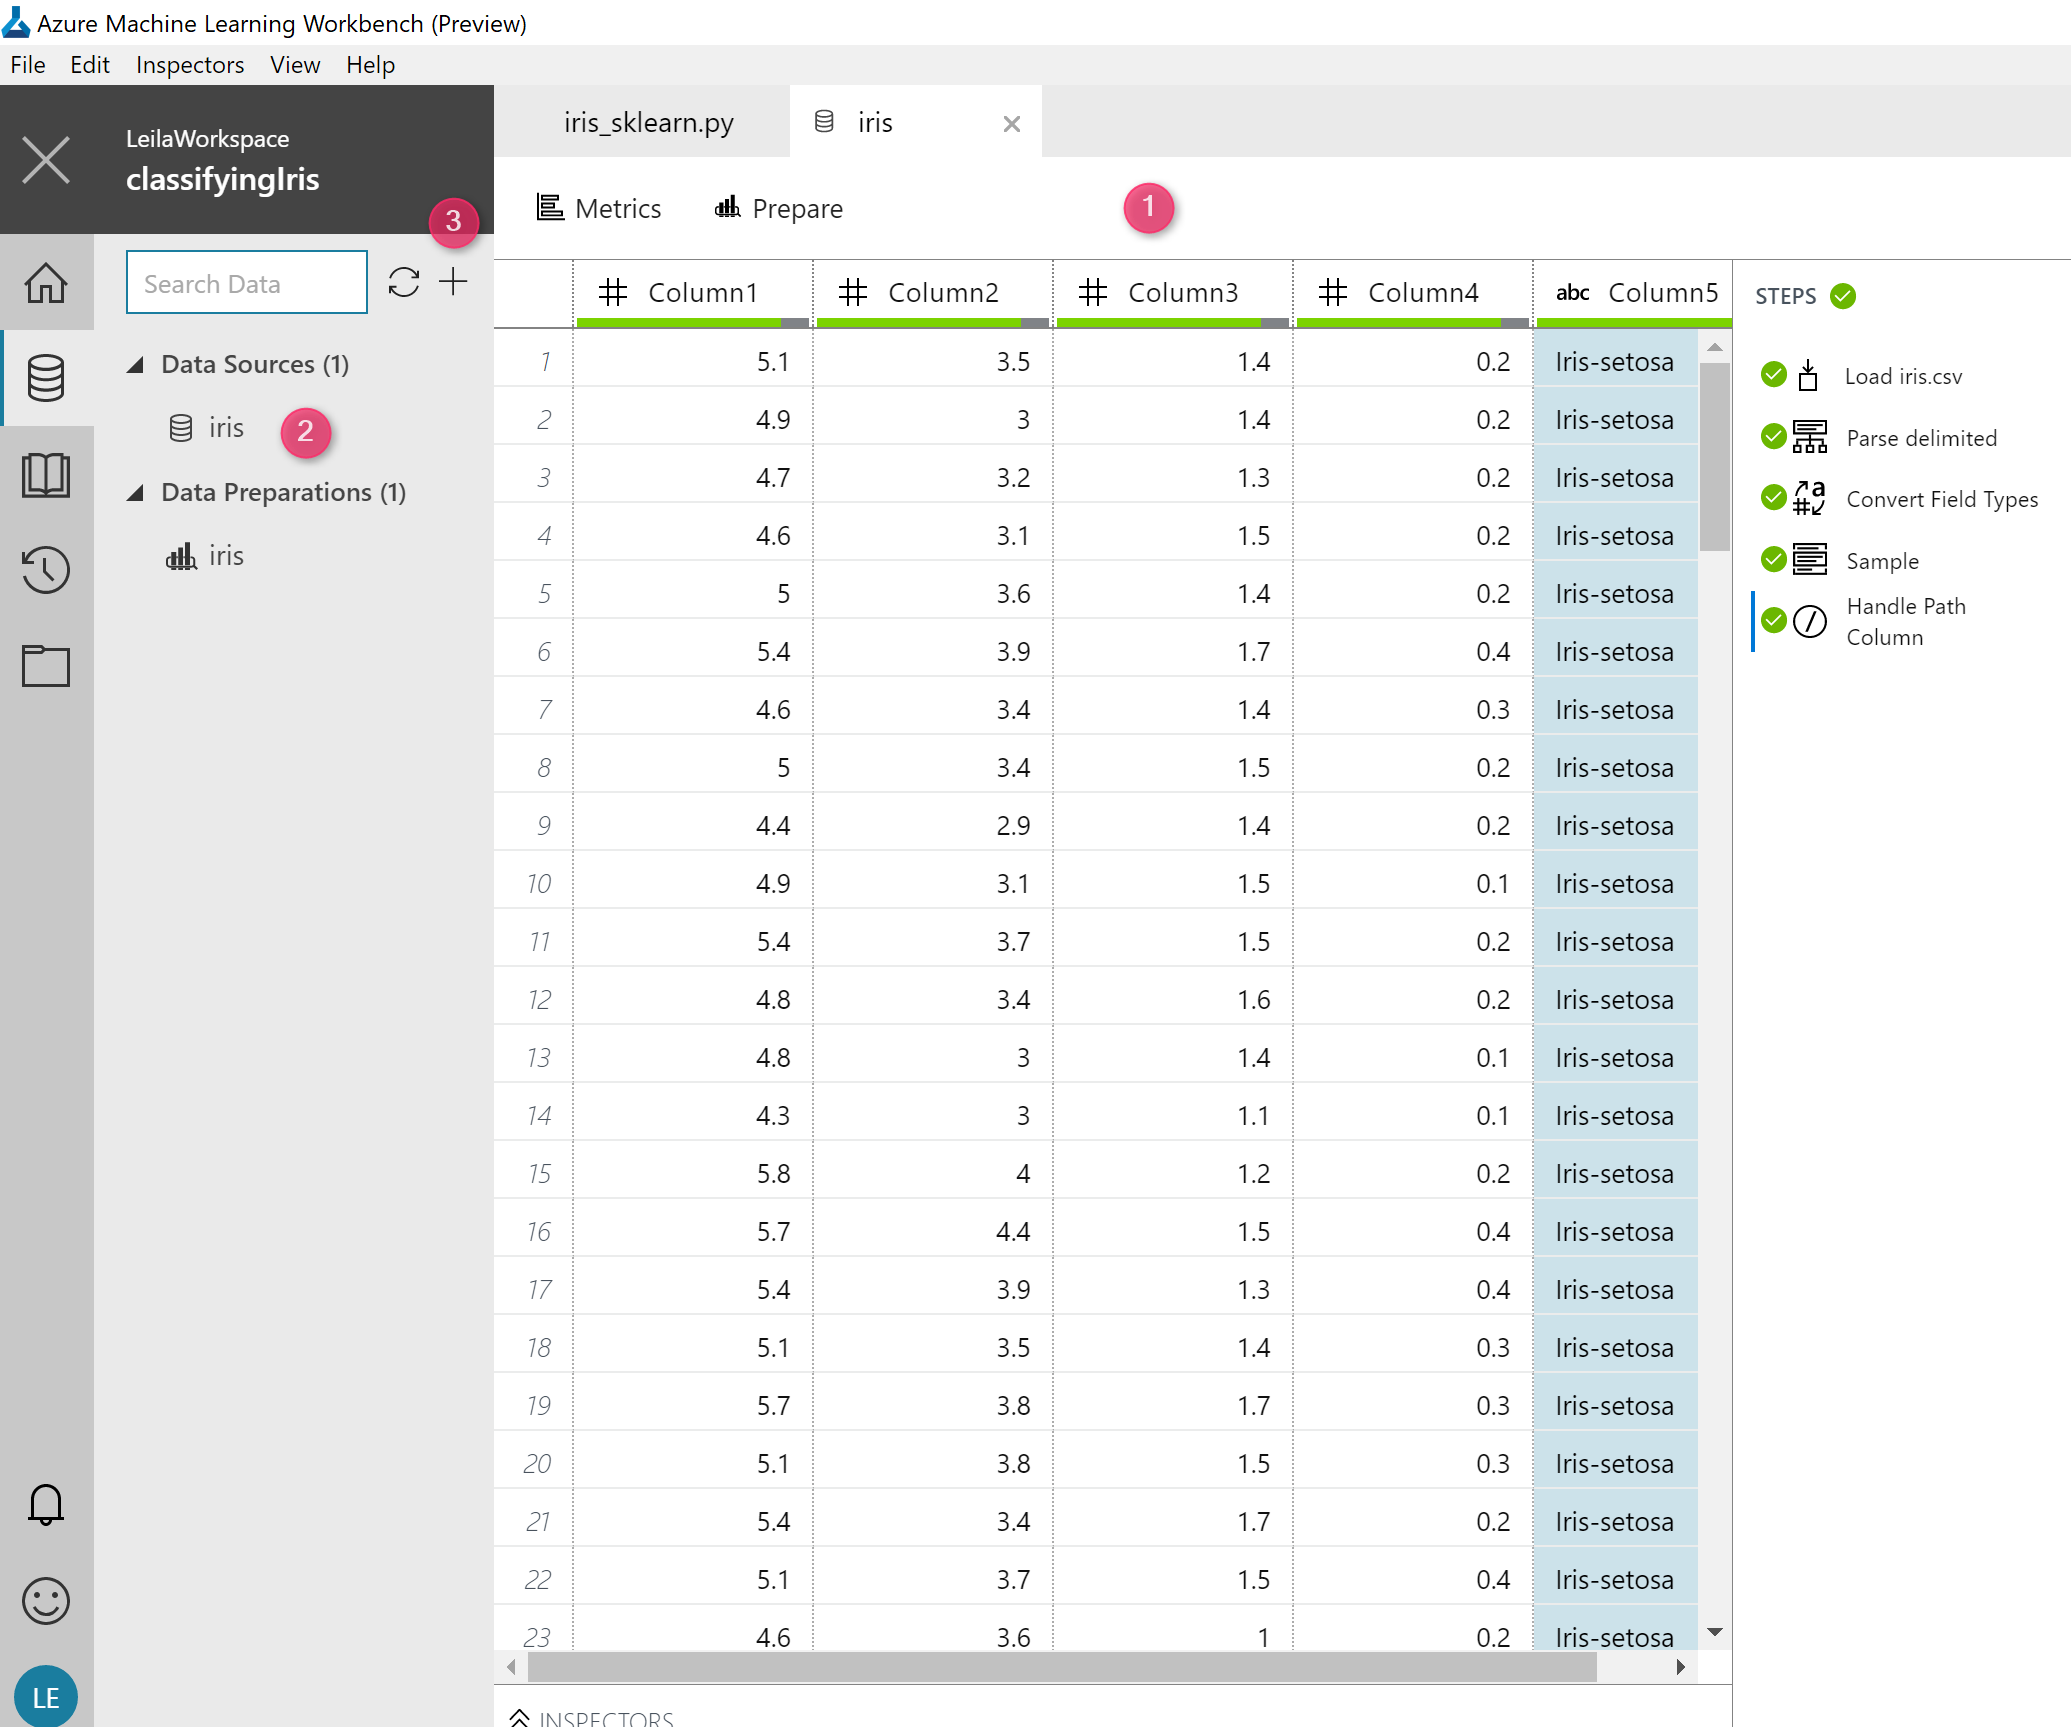
Just click on the left menu, on the database icon. There are 2 separate groups there: one for original data sources and the other for the Data preparations. as I just run the sample of classification for iris data, you can see the initial dataset of the iris in “Data sources” section and also iris for “data Preparation” sections (see below picture)
I am going to explore it and see what we have there. But with new data sources that I am going to upload.
to start, click on the Database icon, there is a plus icon for adding a new Data source, just click on it.
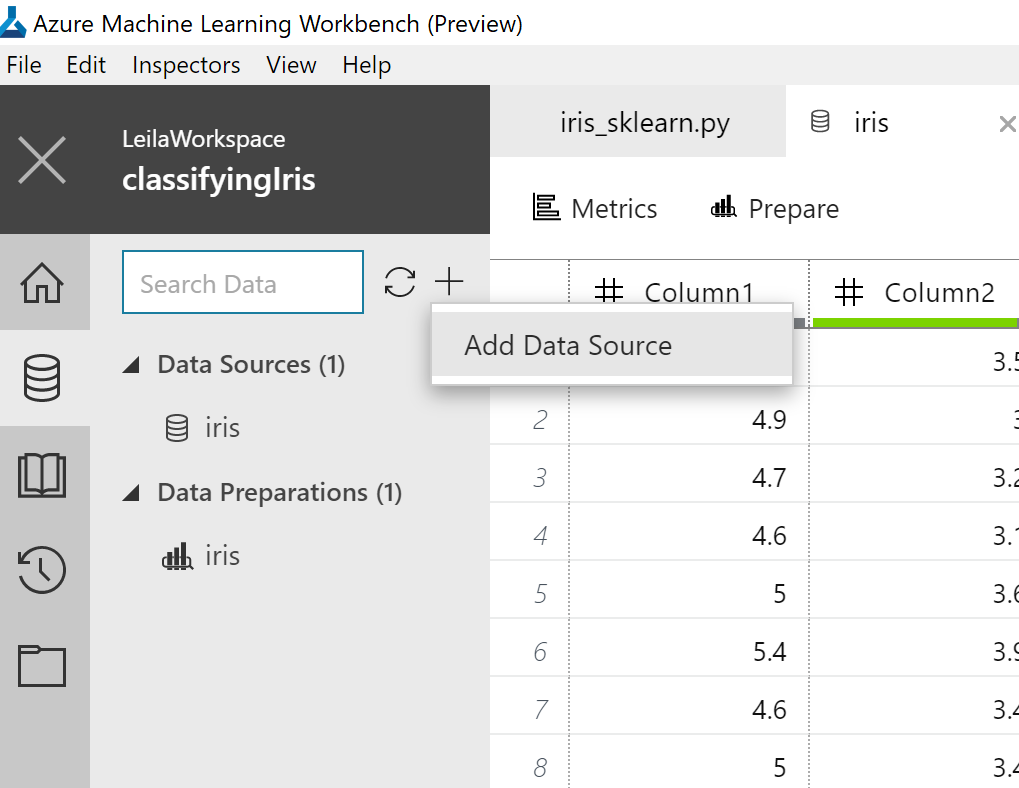
There is a possibility to add data source from different resources. as you see in the below picture, there are already four main options for it. We able to upload data from directory or specific files, from Parquet, from Excel, and connecting to Database.
I am going to a simple connection to a csv file through the first option.
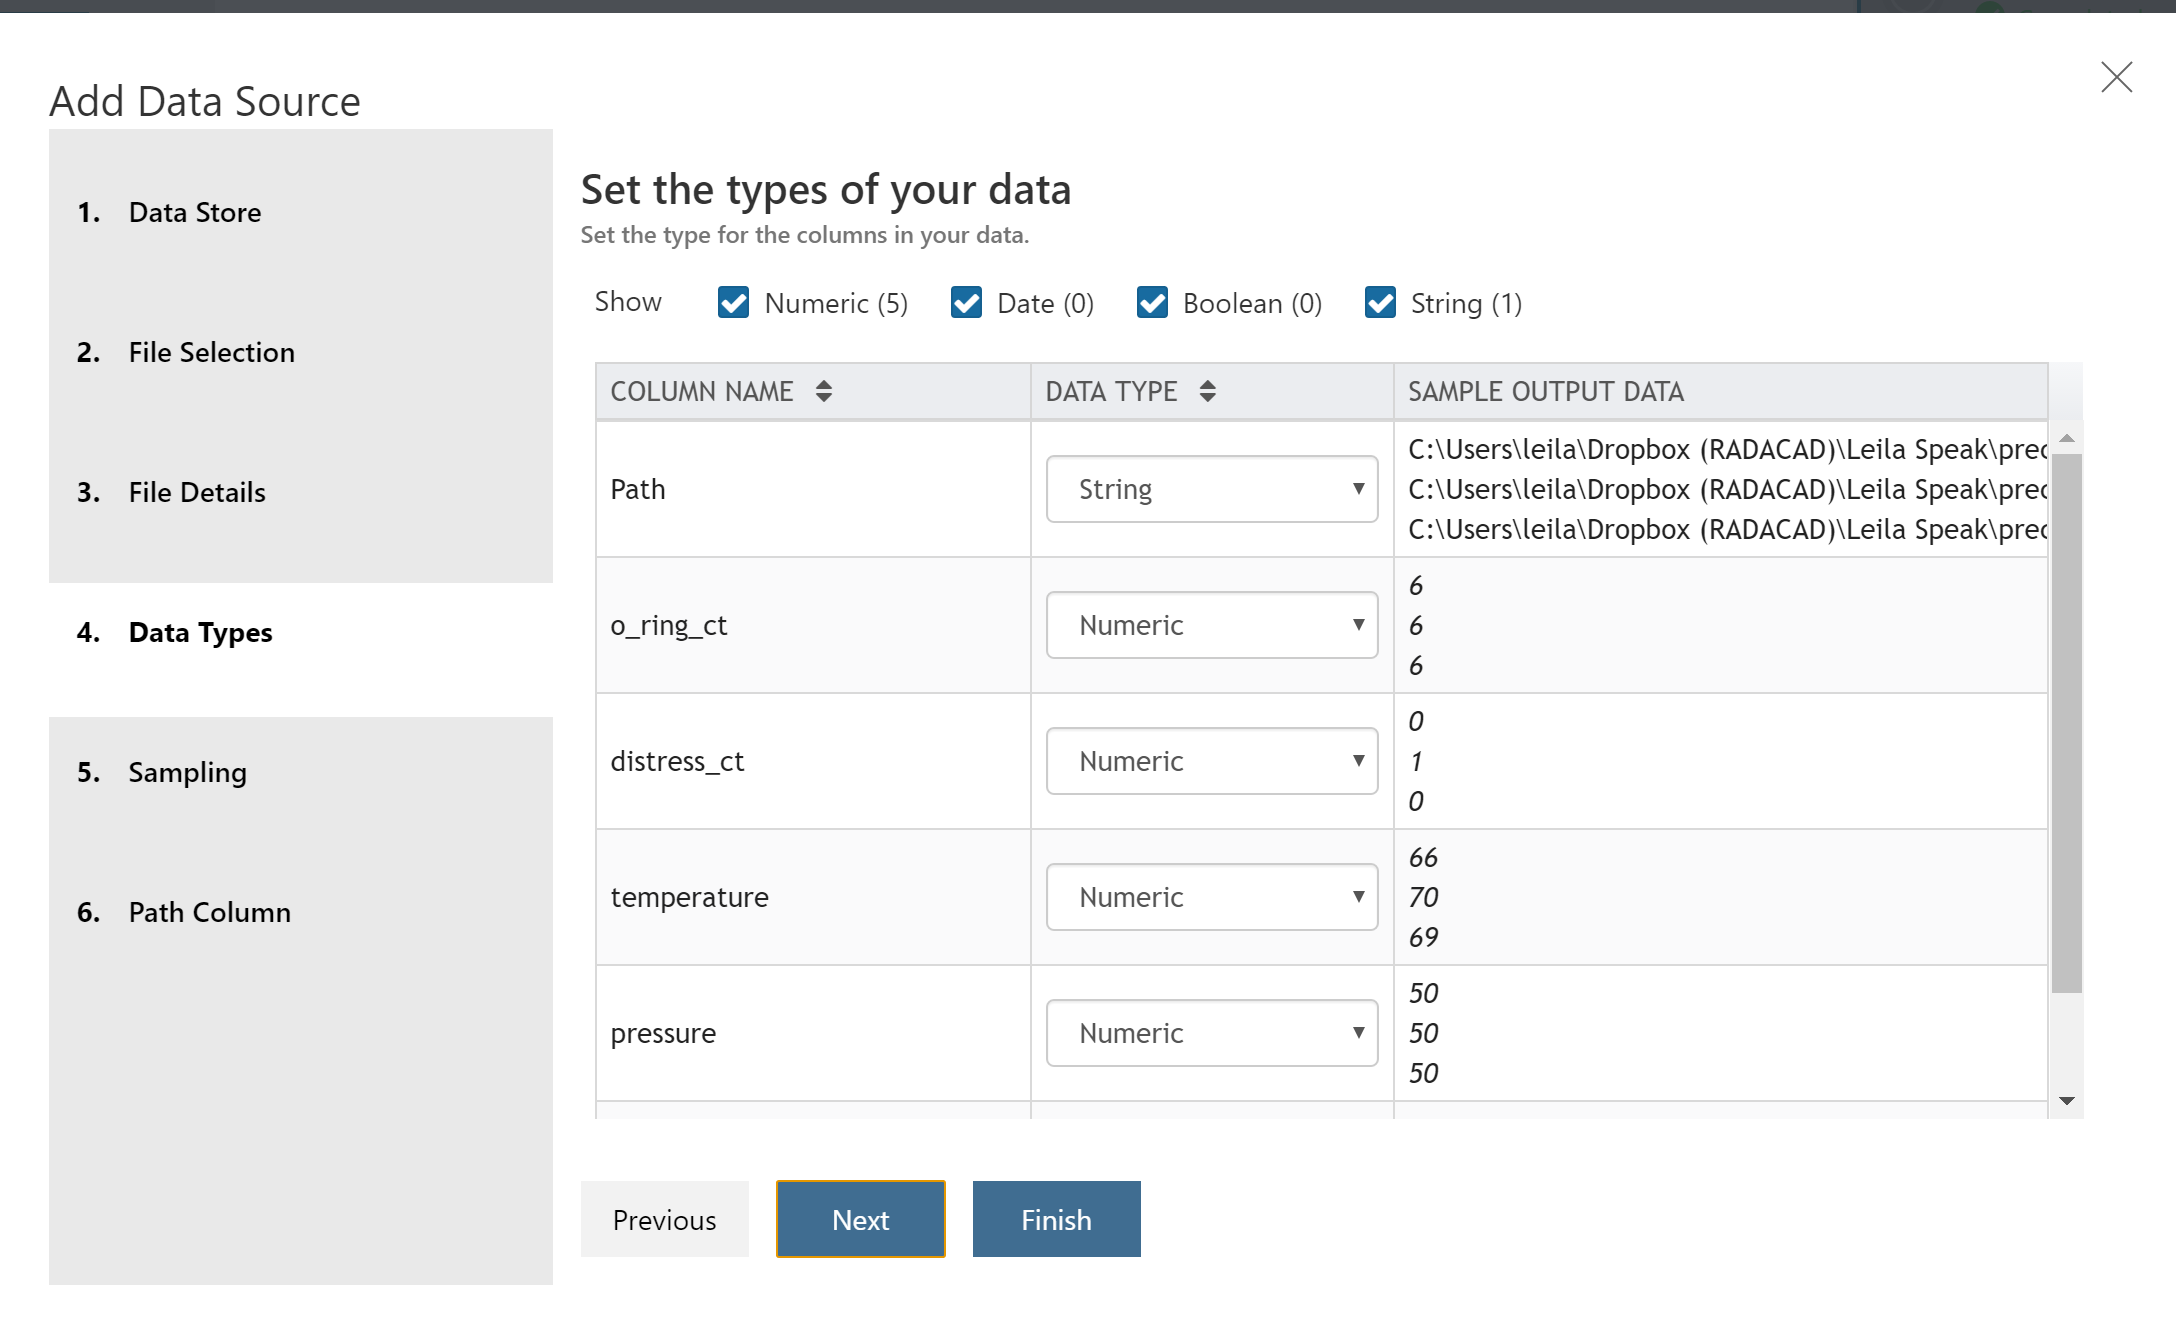
just follow the instructions to upload an Excel file, as you can see in the below there is a possibility to change the data type, Sampling and file selection.
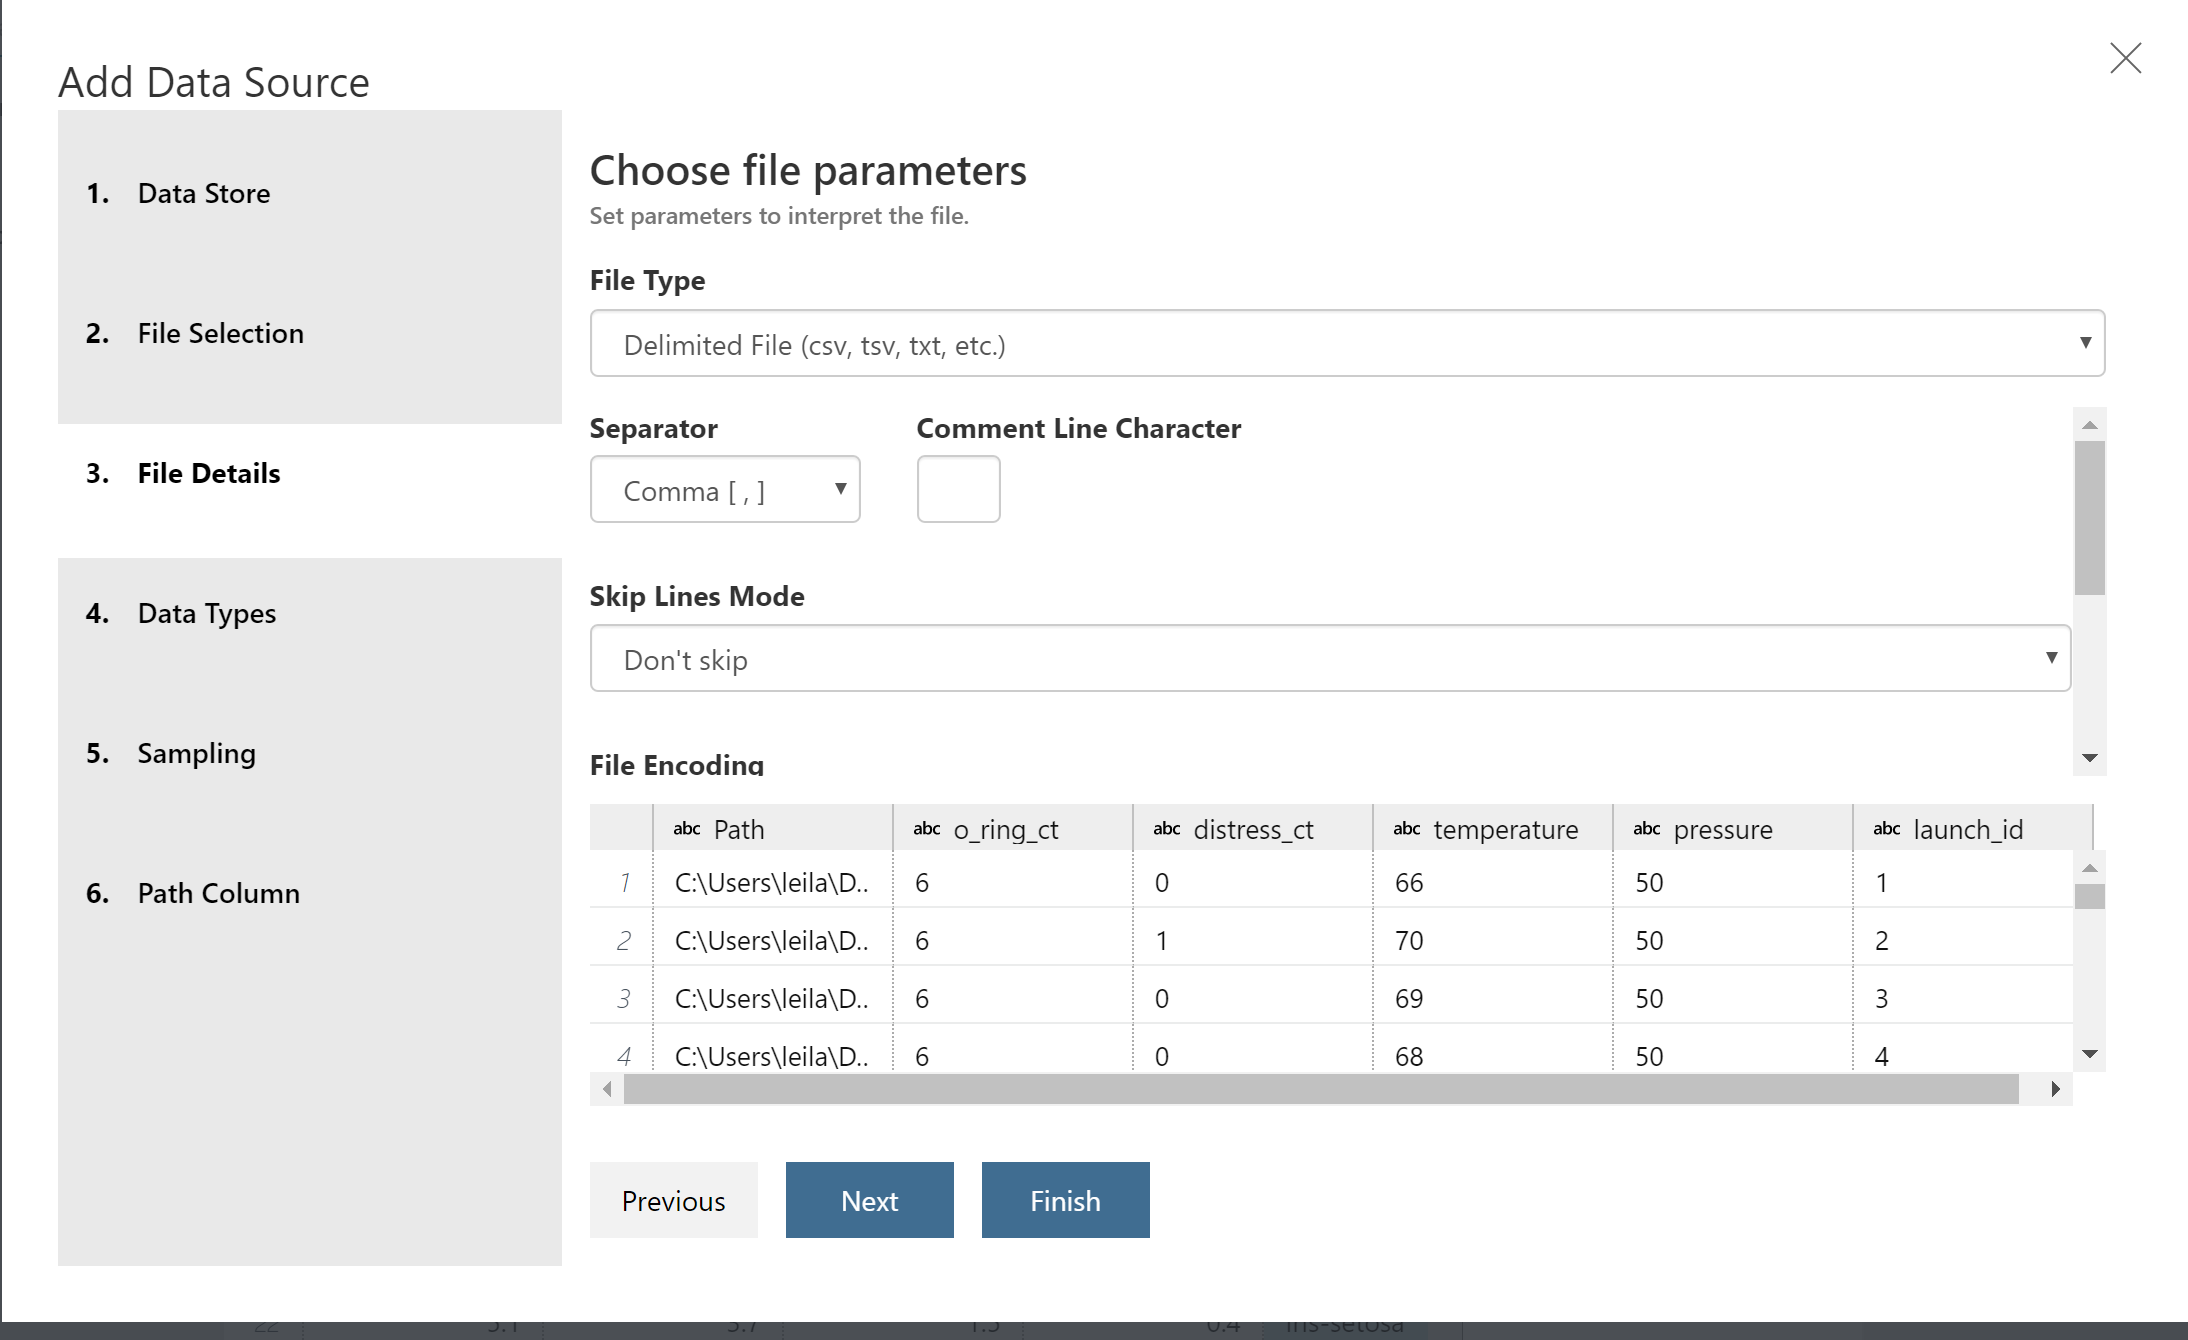
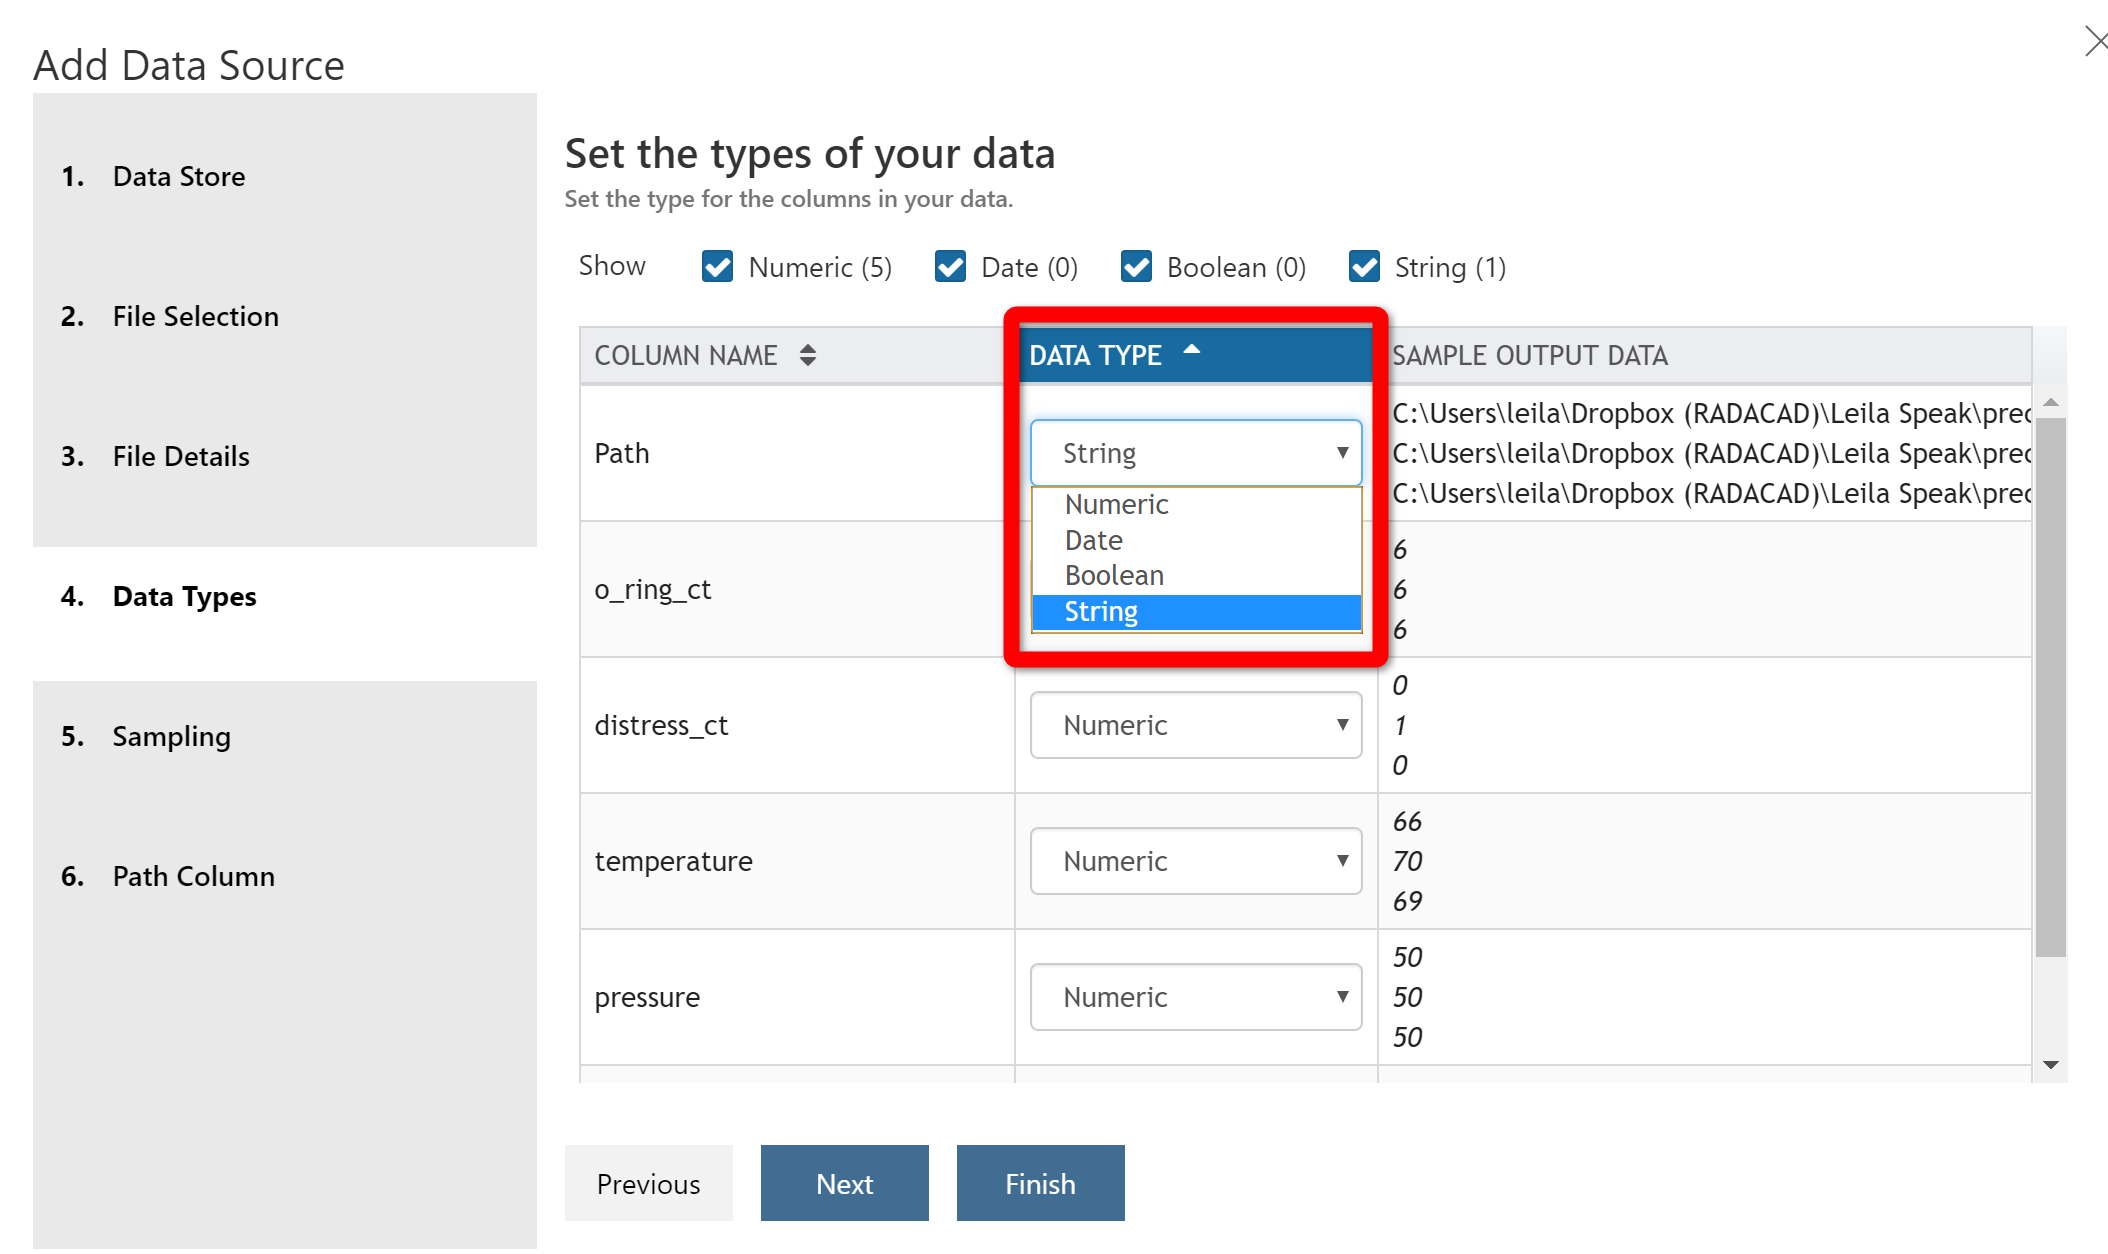
for instance, for each column, I am able to change it to string, numeric or Datatype as below.
and it is easy to change the type as below
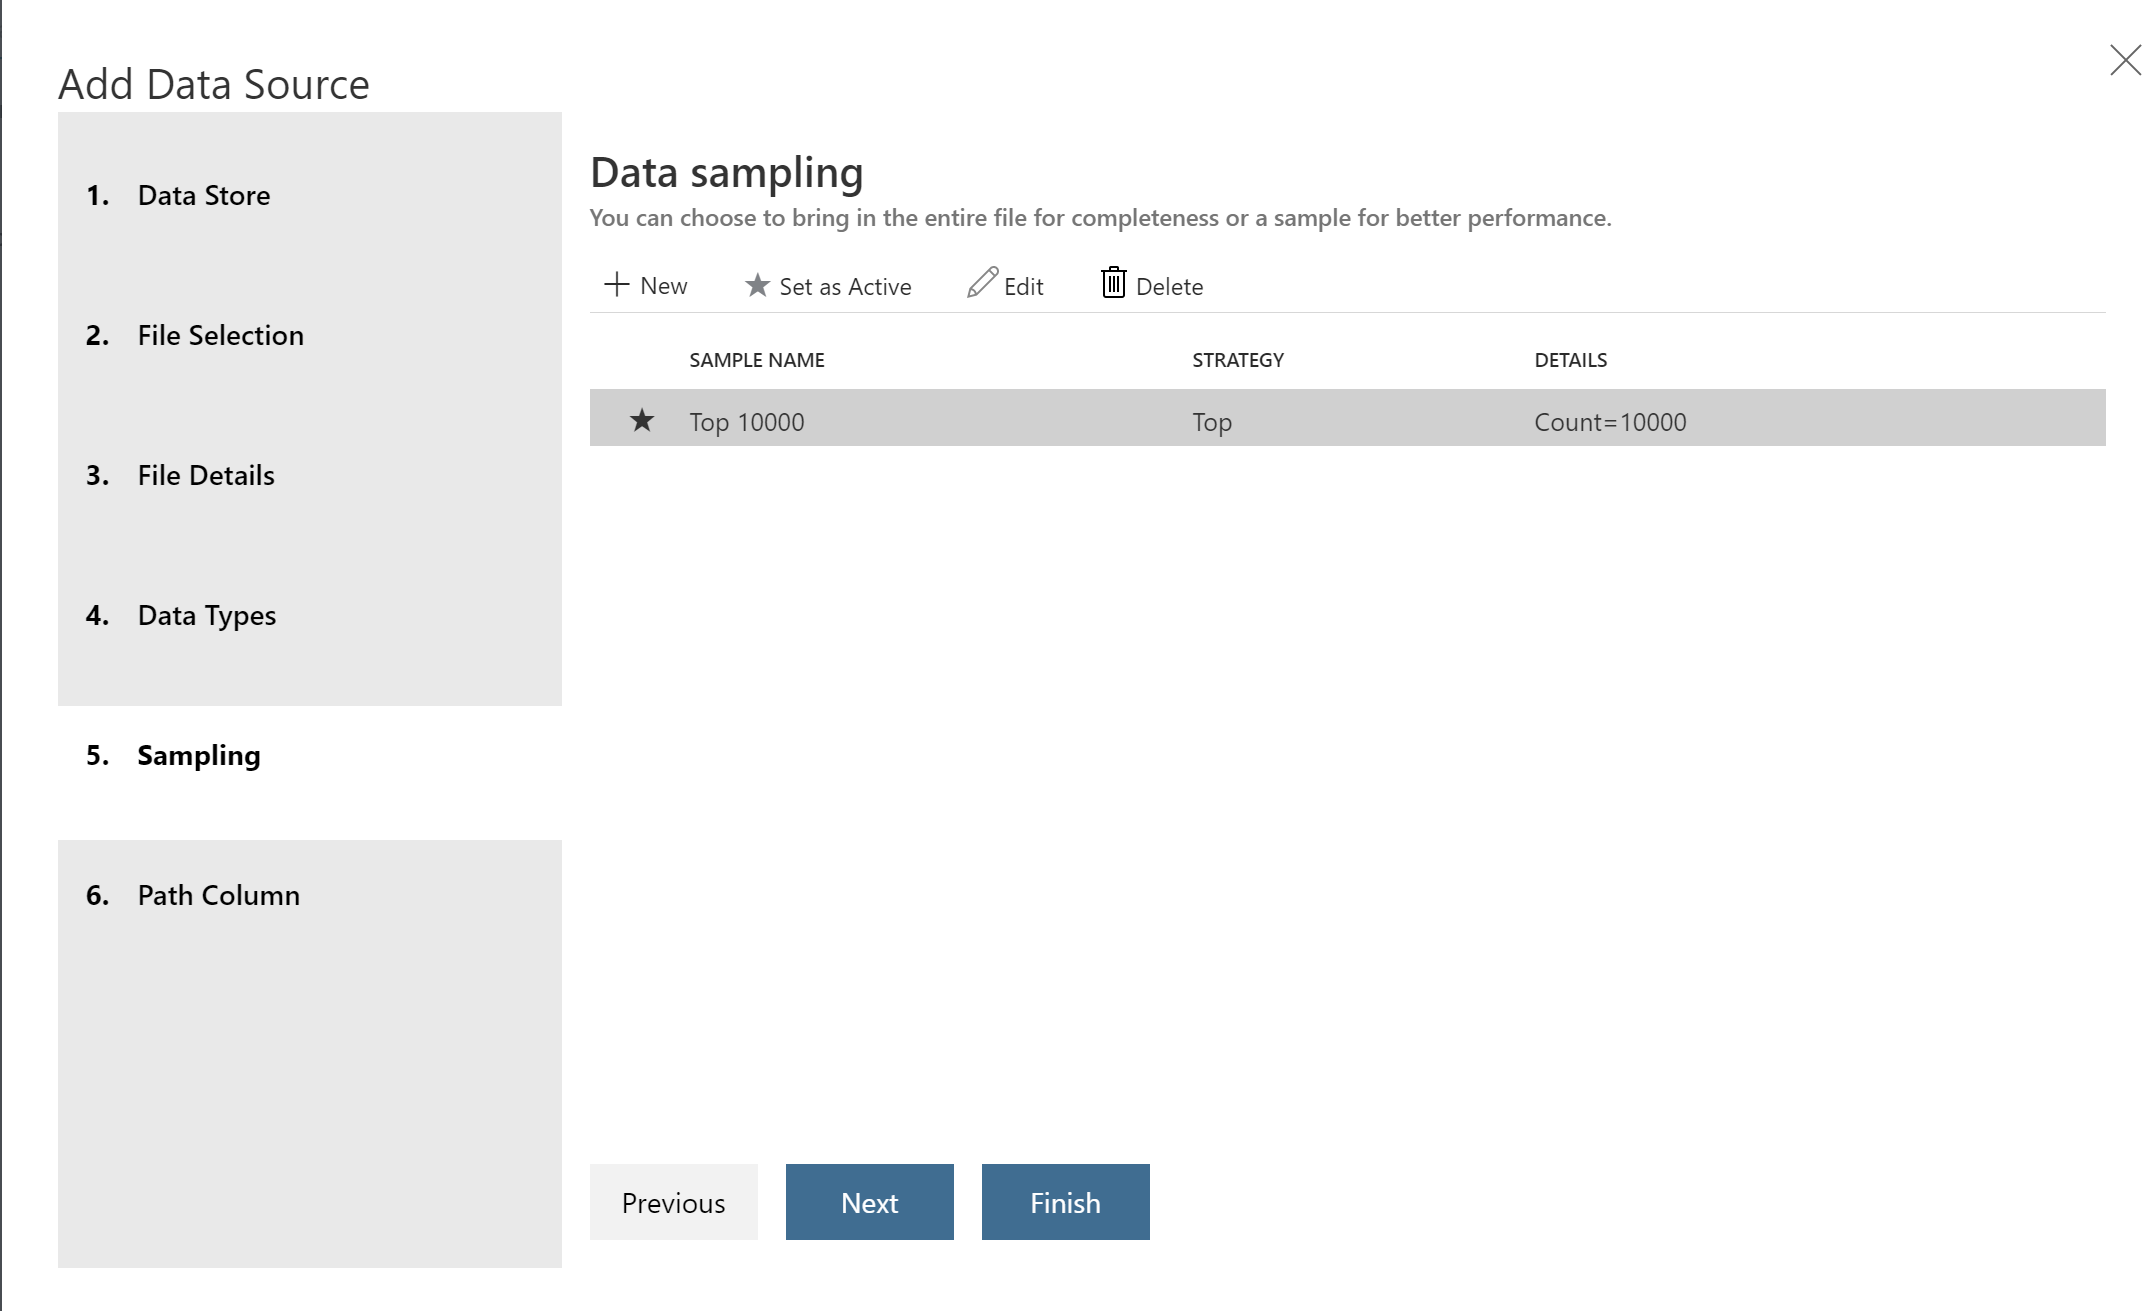
Also, you able to do data sampling and get data from there.
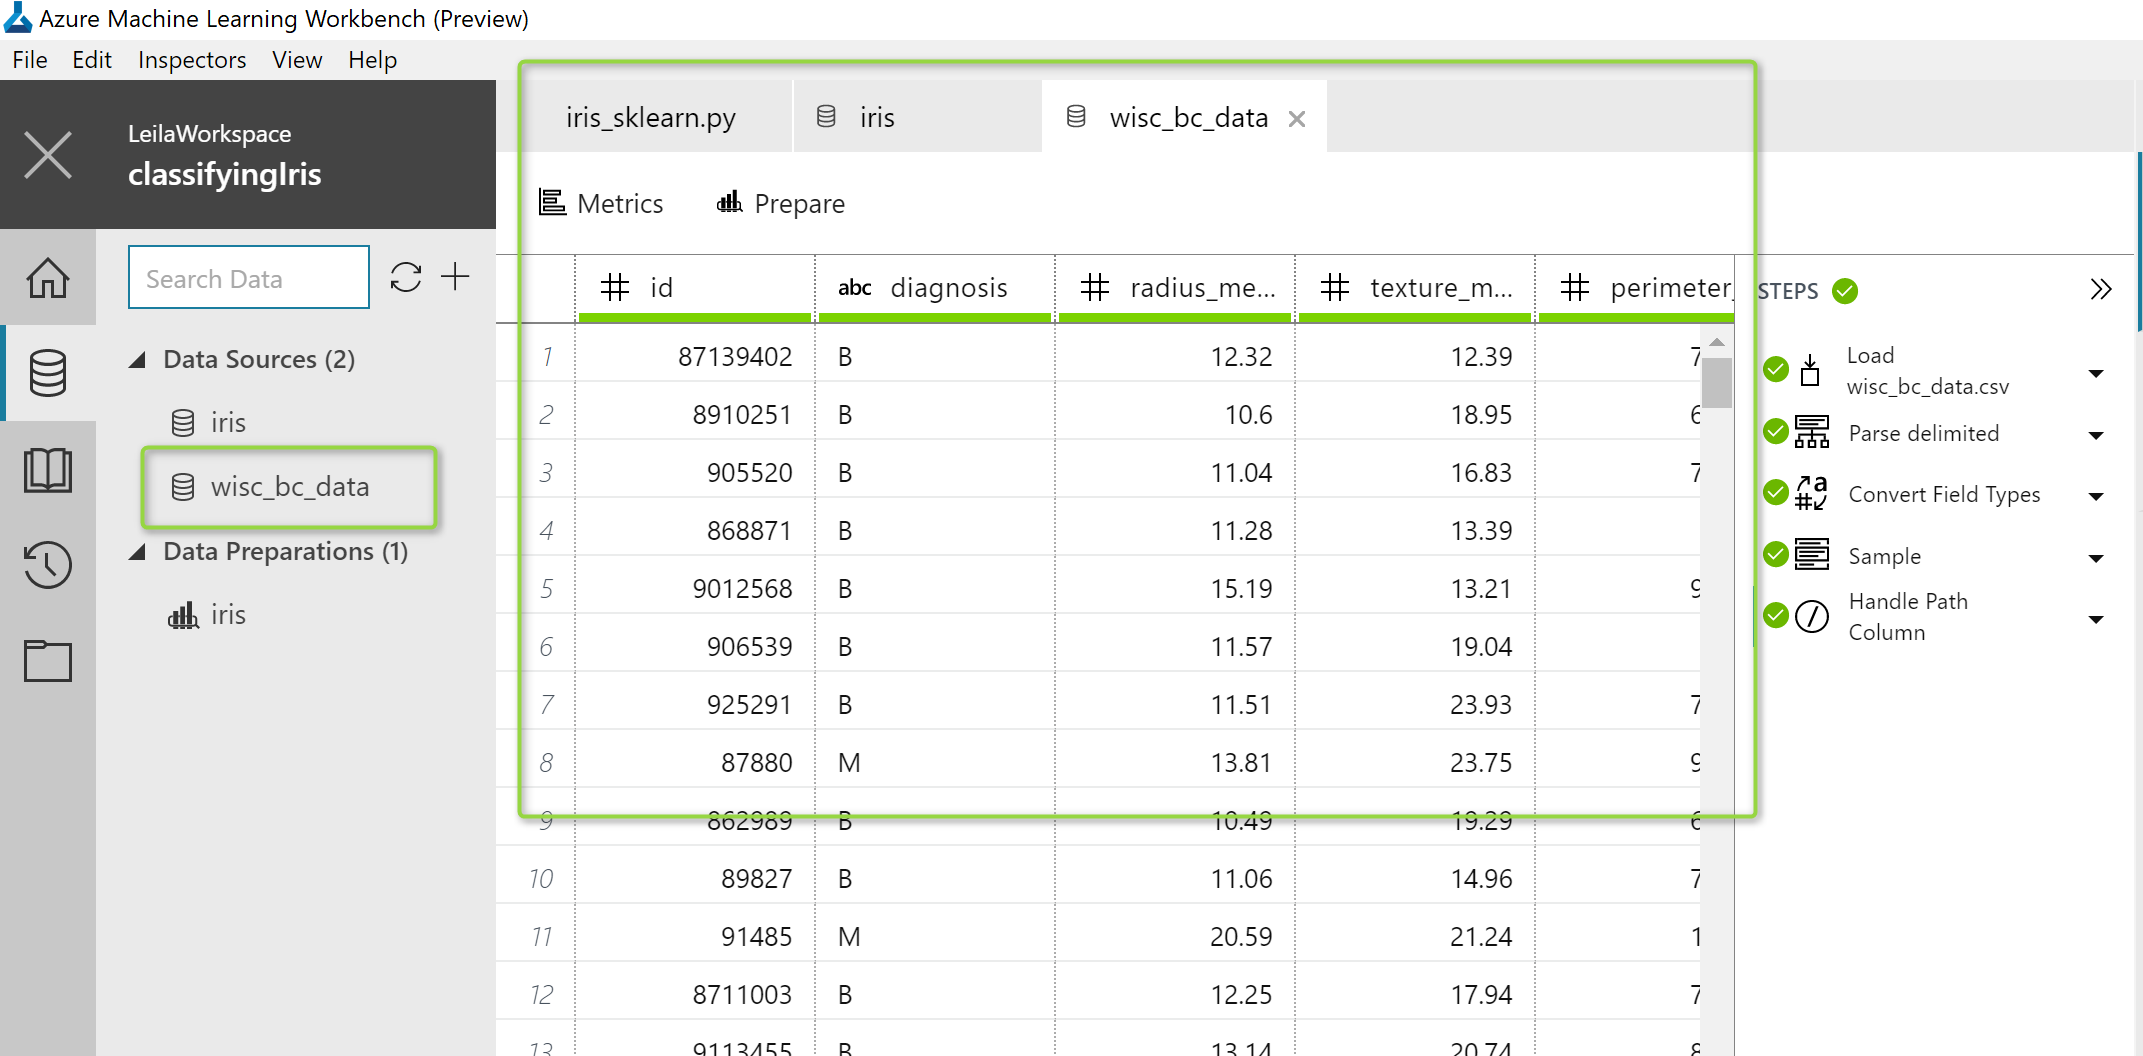
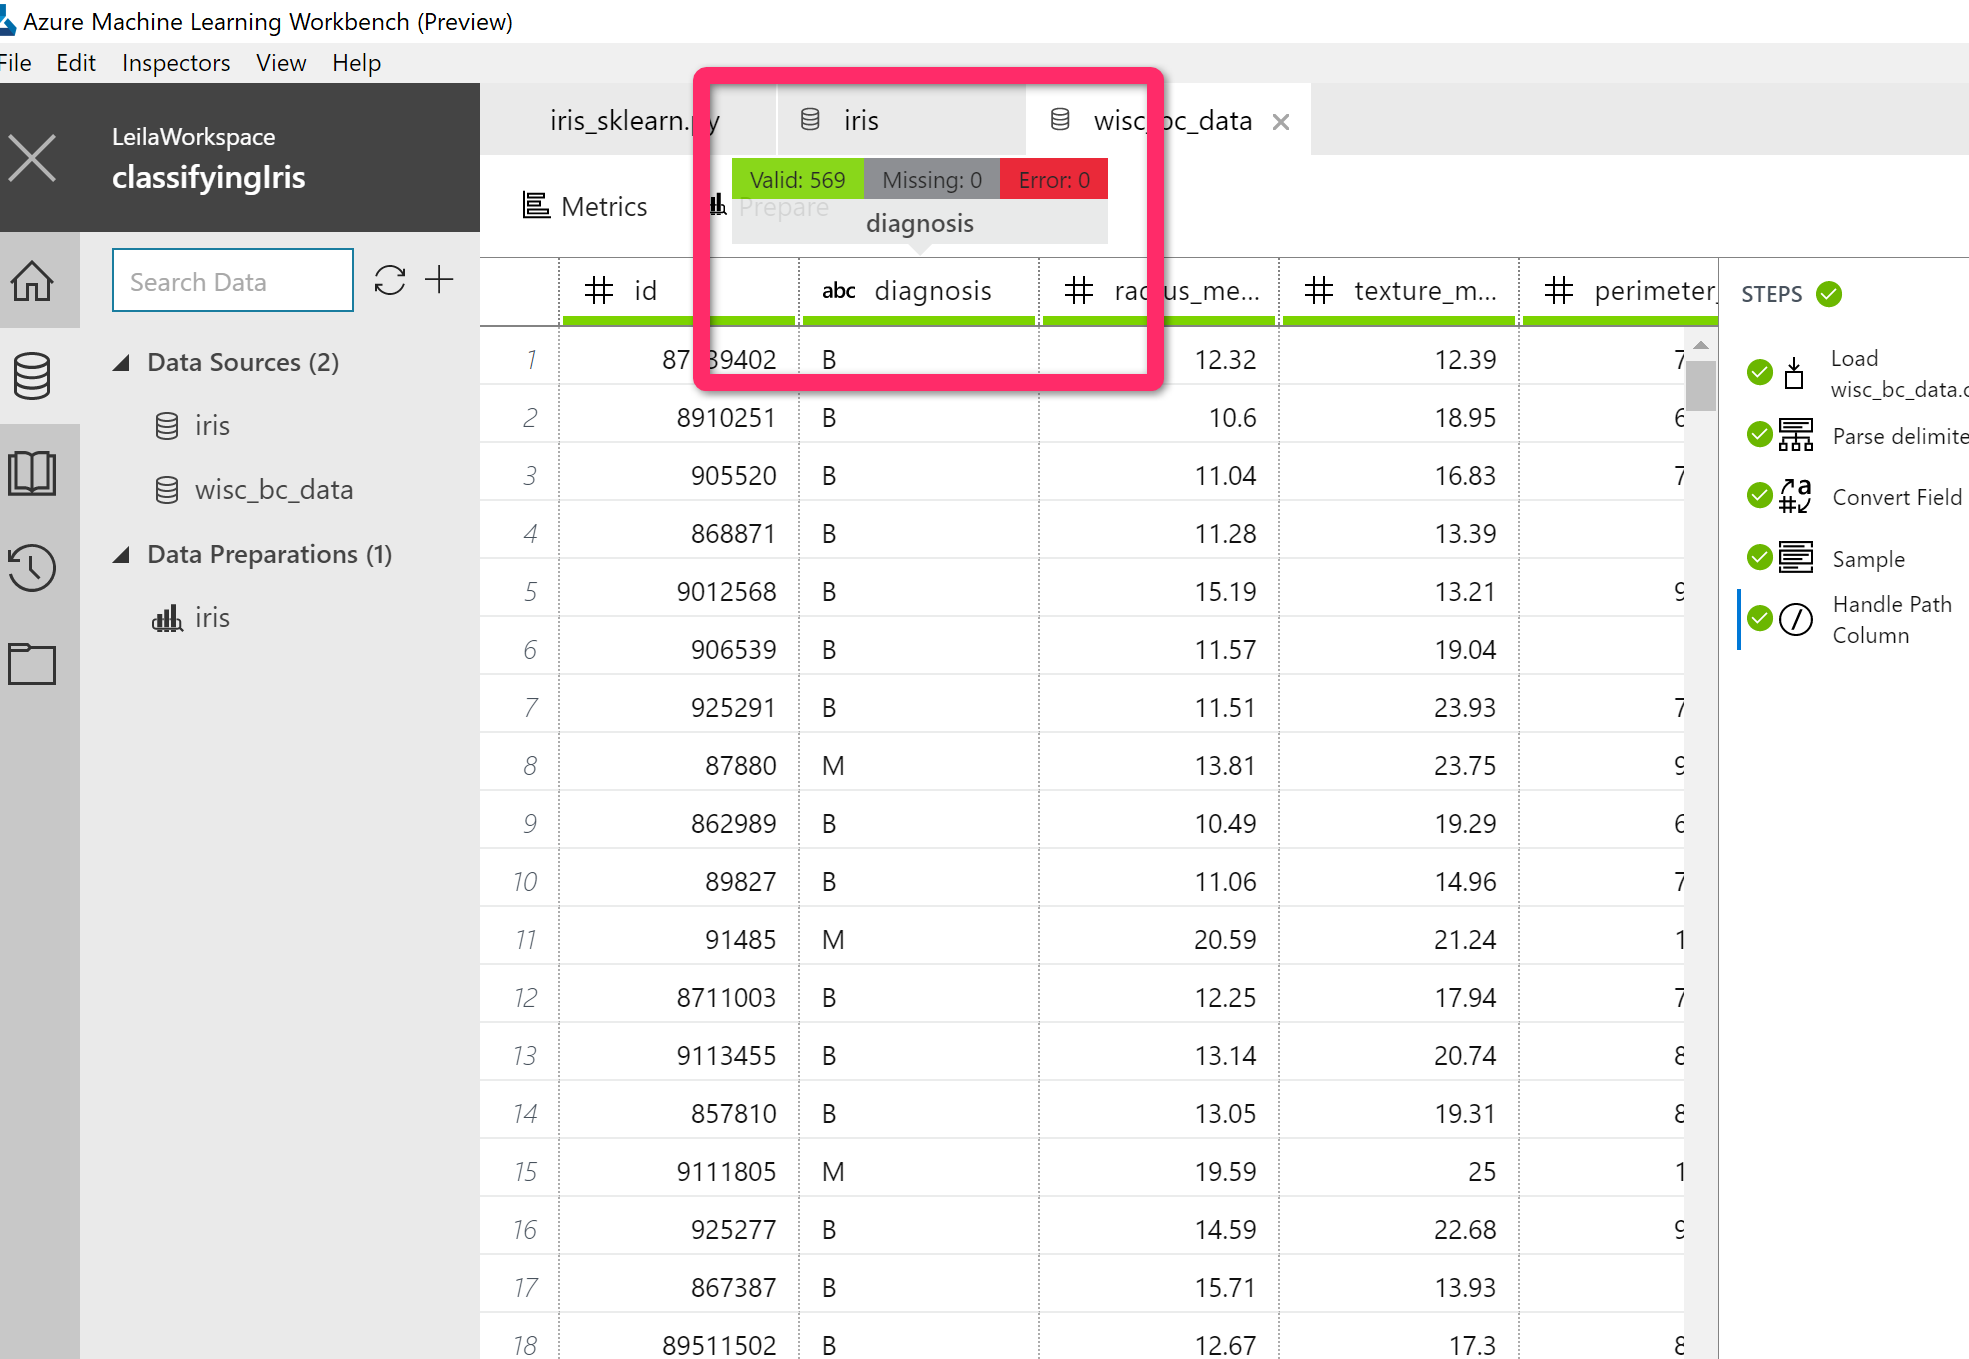
Now, this is my data for Cancer prediction, as you can see in the below picture, the dataset has a Patient ID, diagnosis, and some other laboratory measure results that all are numeric (see the below picture).
Now I am going to do some data preparation on this dataset.
so just one note, that the original dataset will still be kept and untouched in the “Data Source” category.
Also, you will get some information and statistics about the data like how much of the data has been missed, how many errors we have, and how much of the data is valid. Actually, the below dataset is quite nice and clean so I have 0 for missing and error and all rows are valid.
just click on the “Metrics” icon to switch to the summary page of the data.

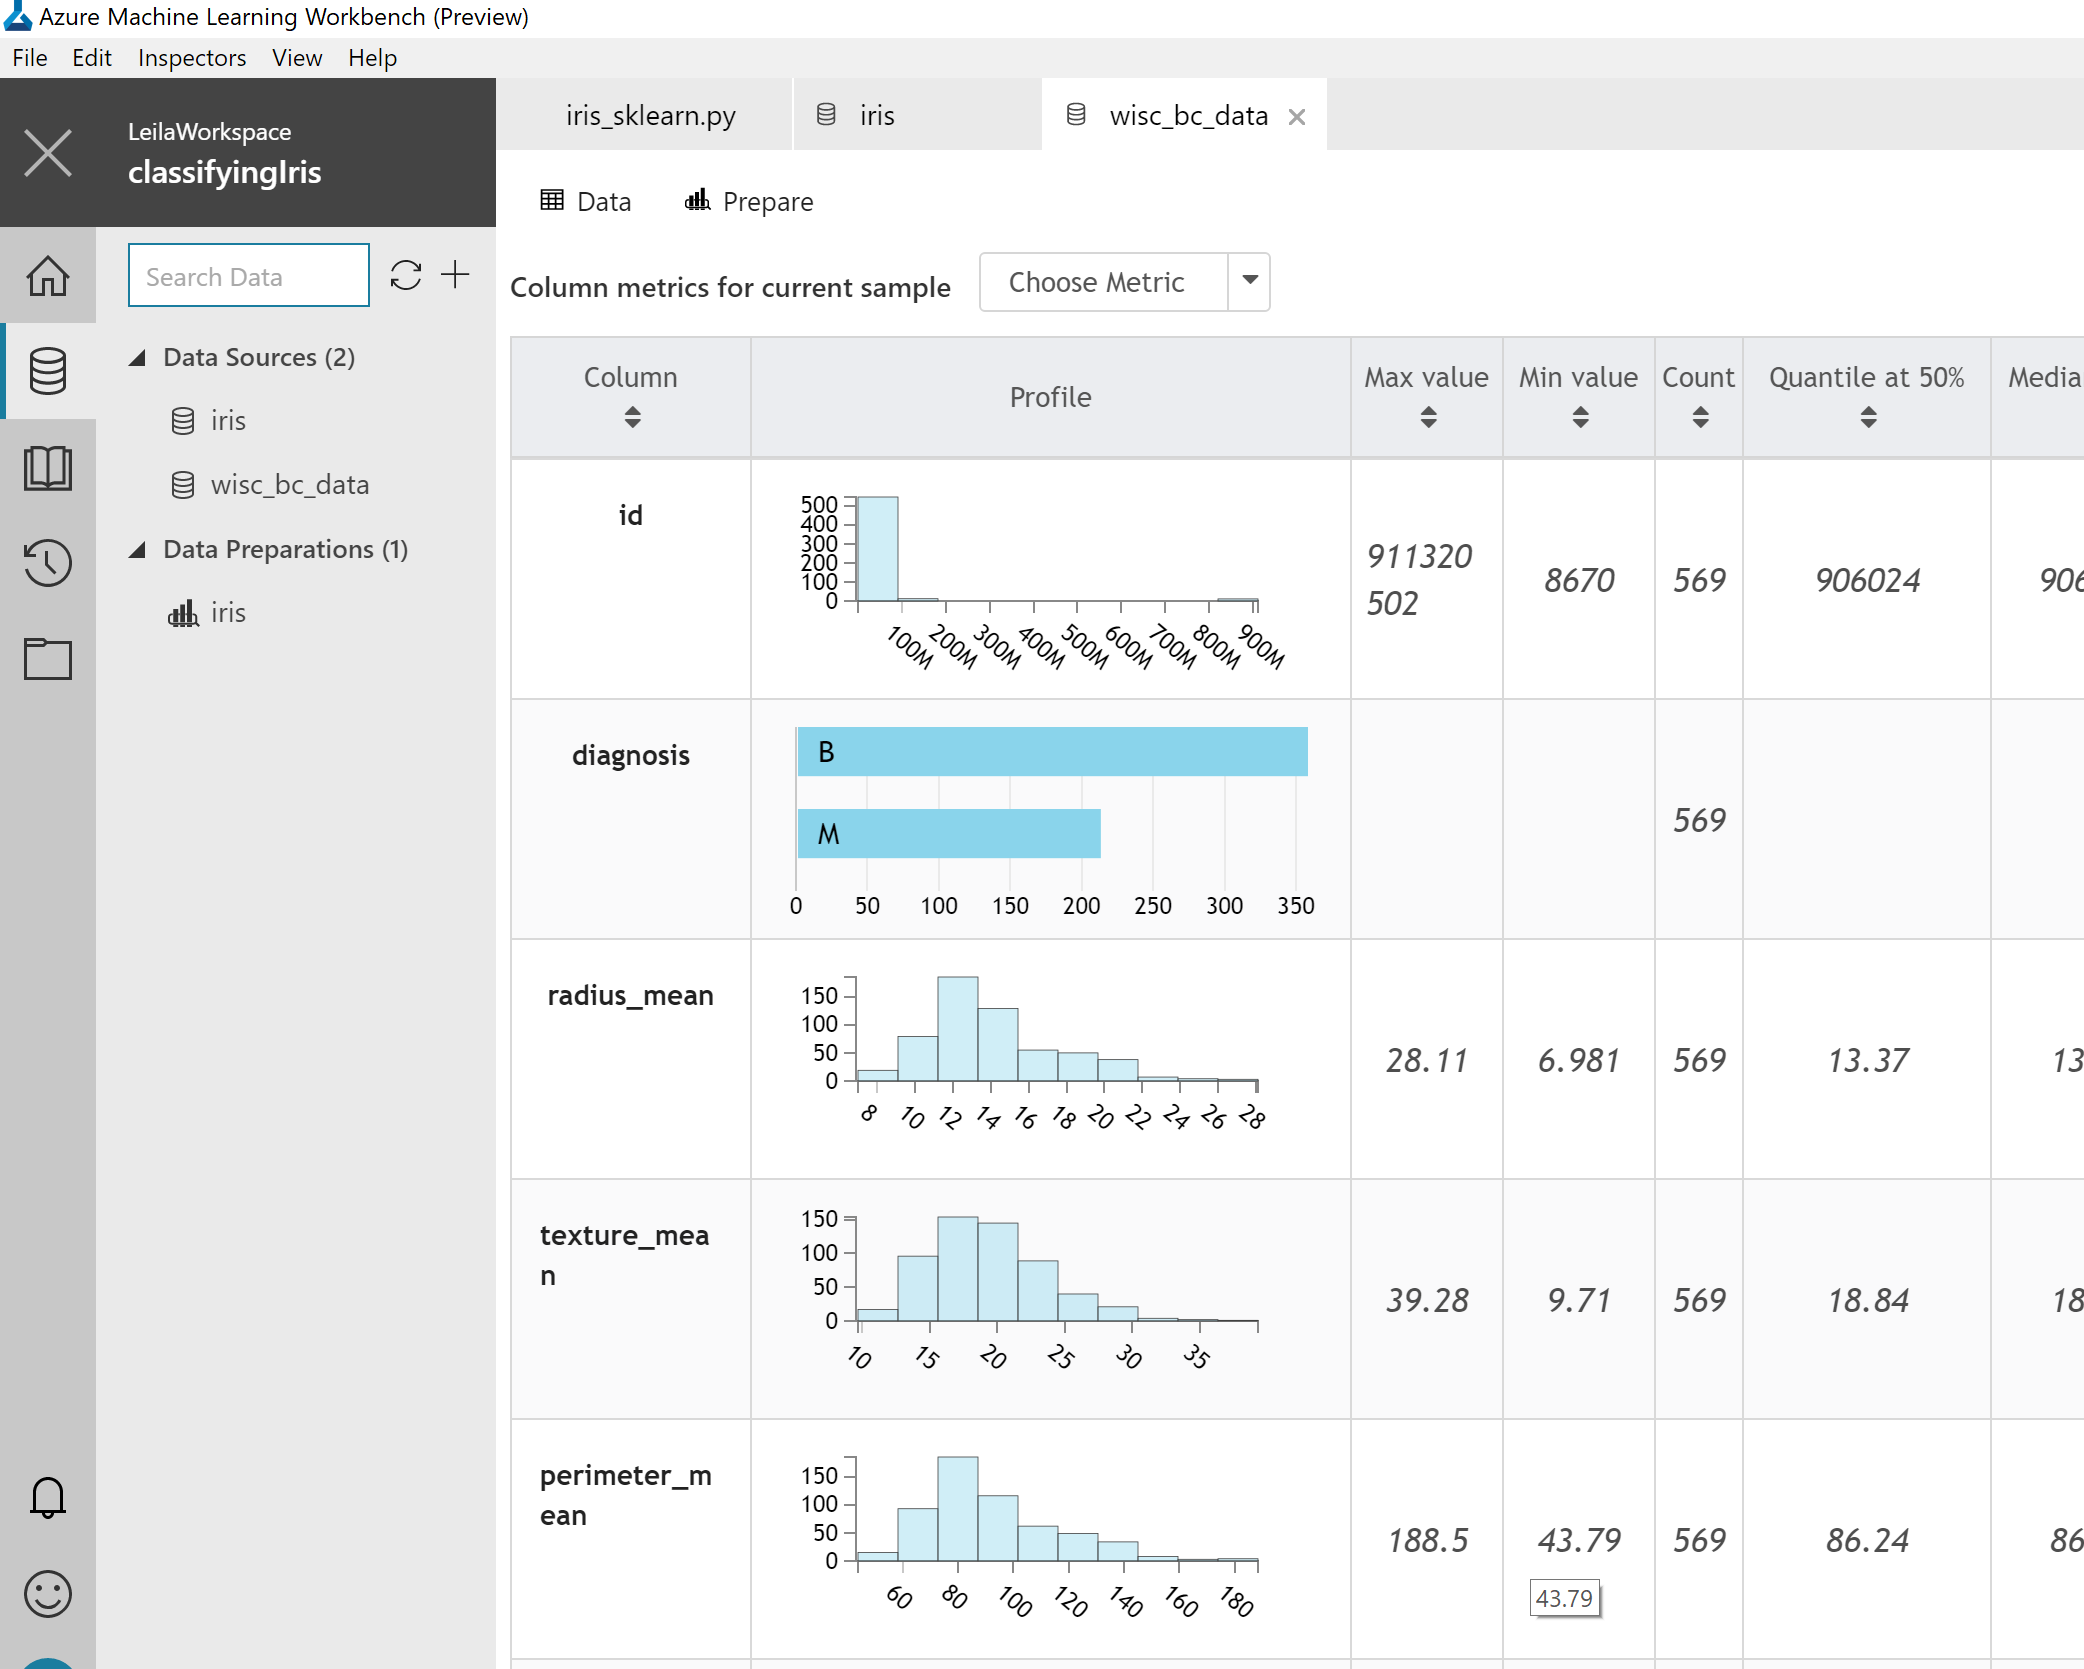
After that, you will see some statistics about each column as below picture.
for instance, in the “diagnosis” column, first, a histogram has been shown that shows the diversity f the people who are B (Benign) or M (Malignant). then in other columns, you will see some more statistics about the min, max, count, median and so forth.
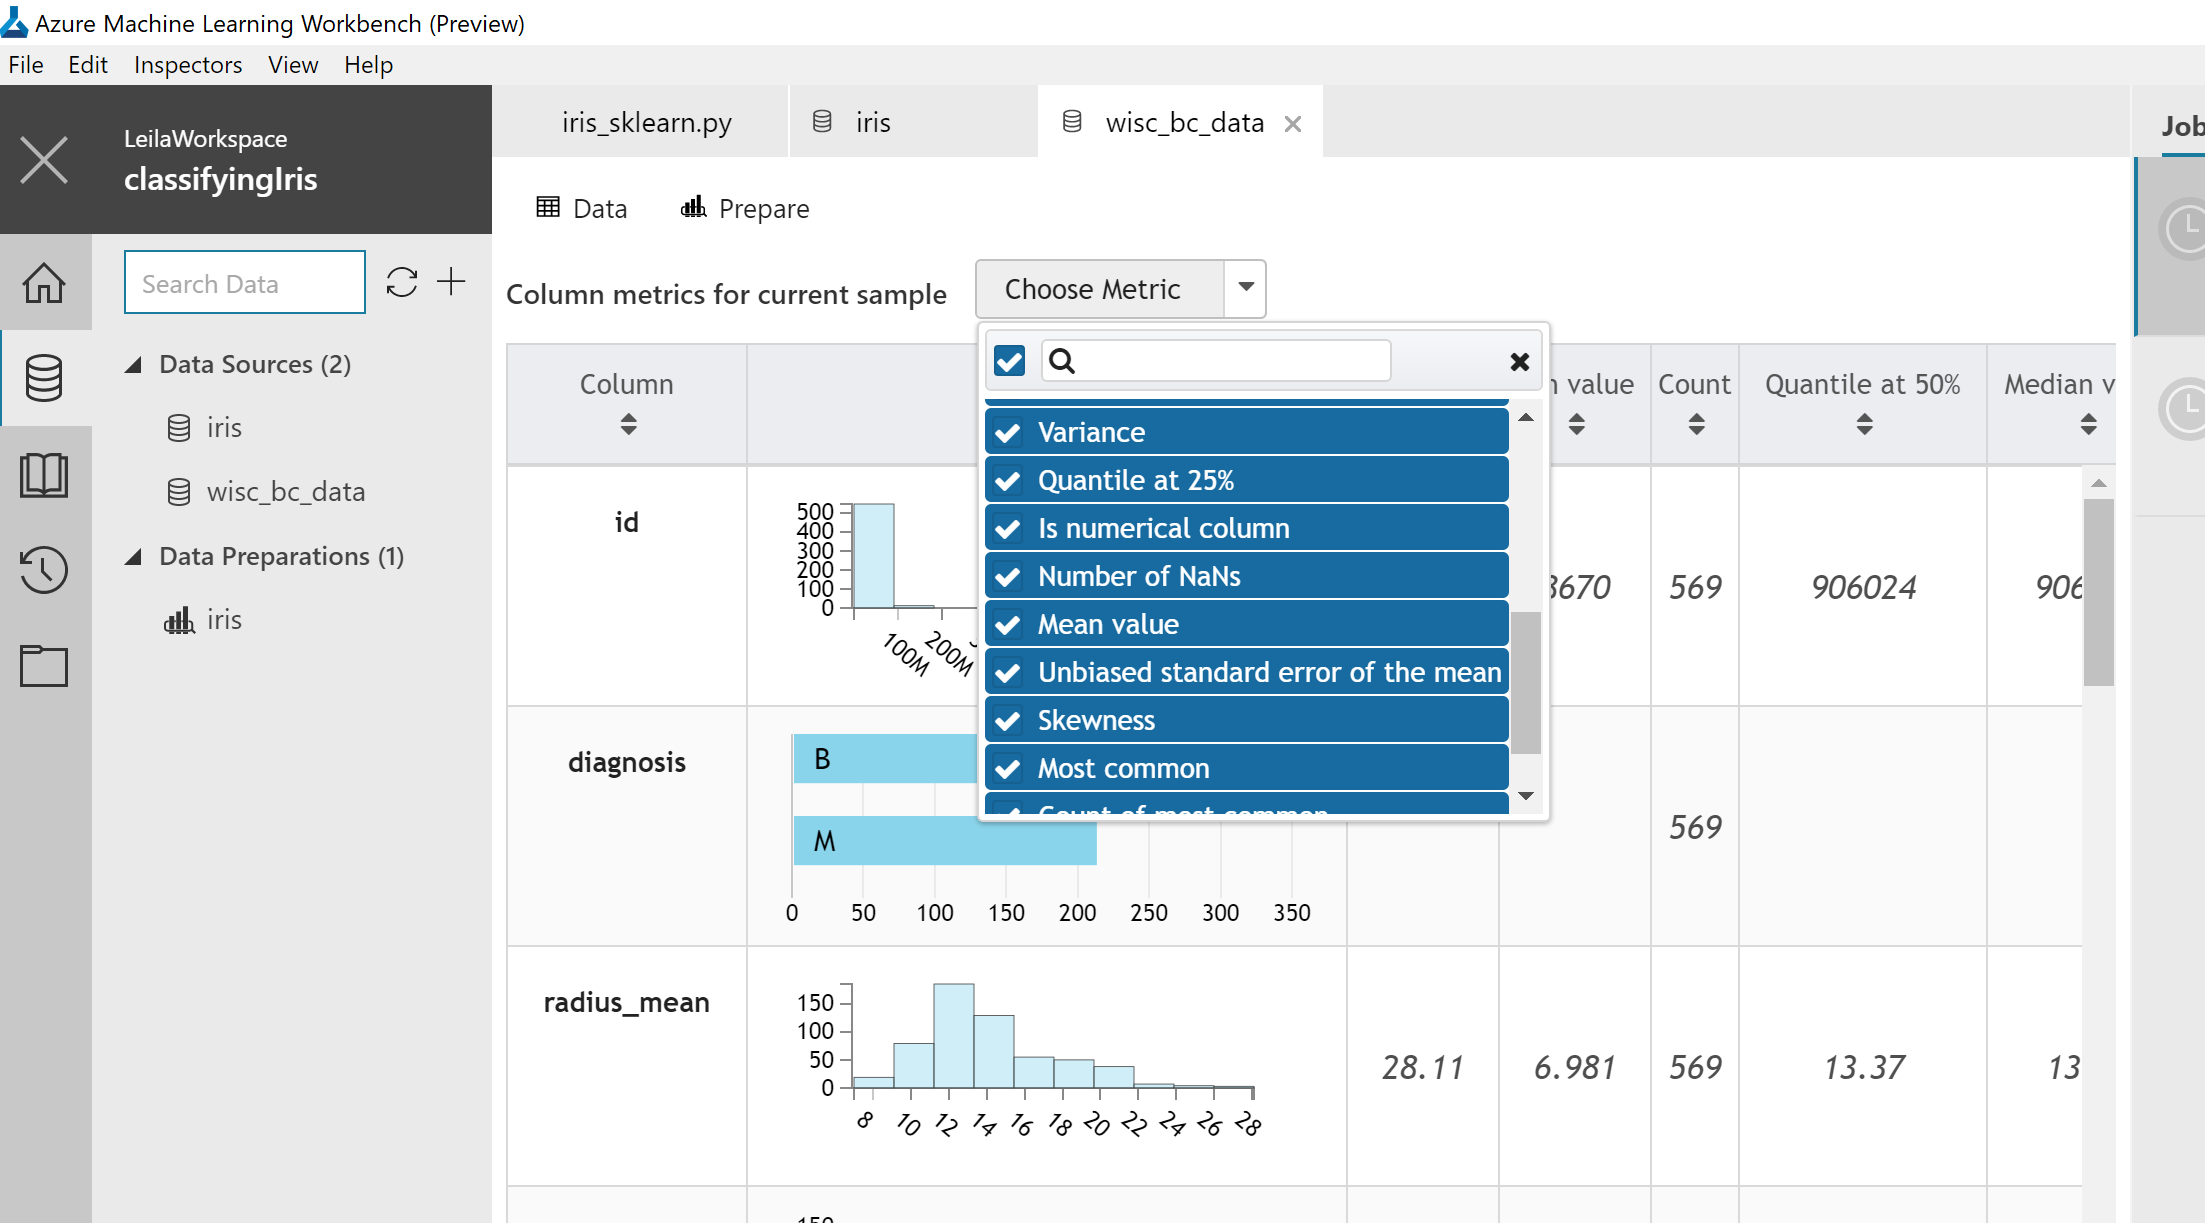
However you able to specify which metrics to be shown in page by clicking on the “column metrics for current sample” as below
Now, I want to do data preparation, so I just click on the “prepare” icon to go to the prepare section.
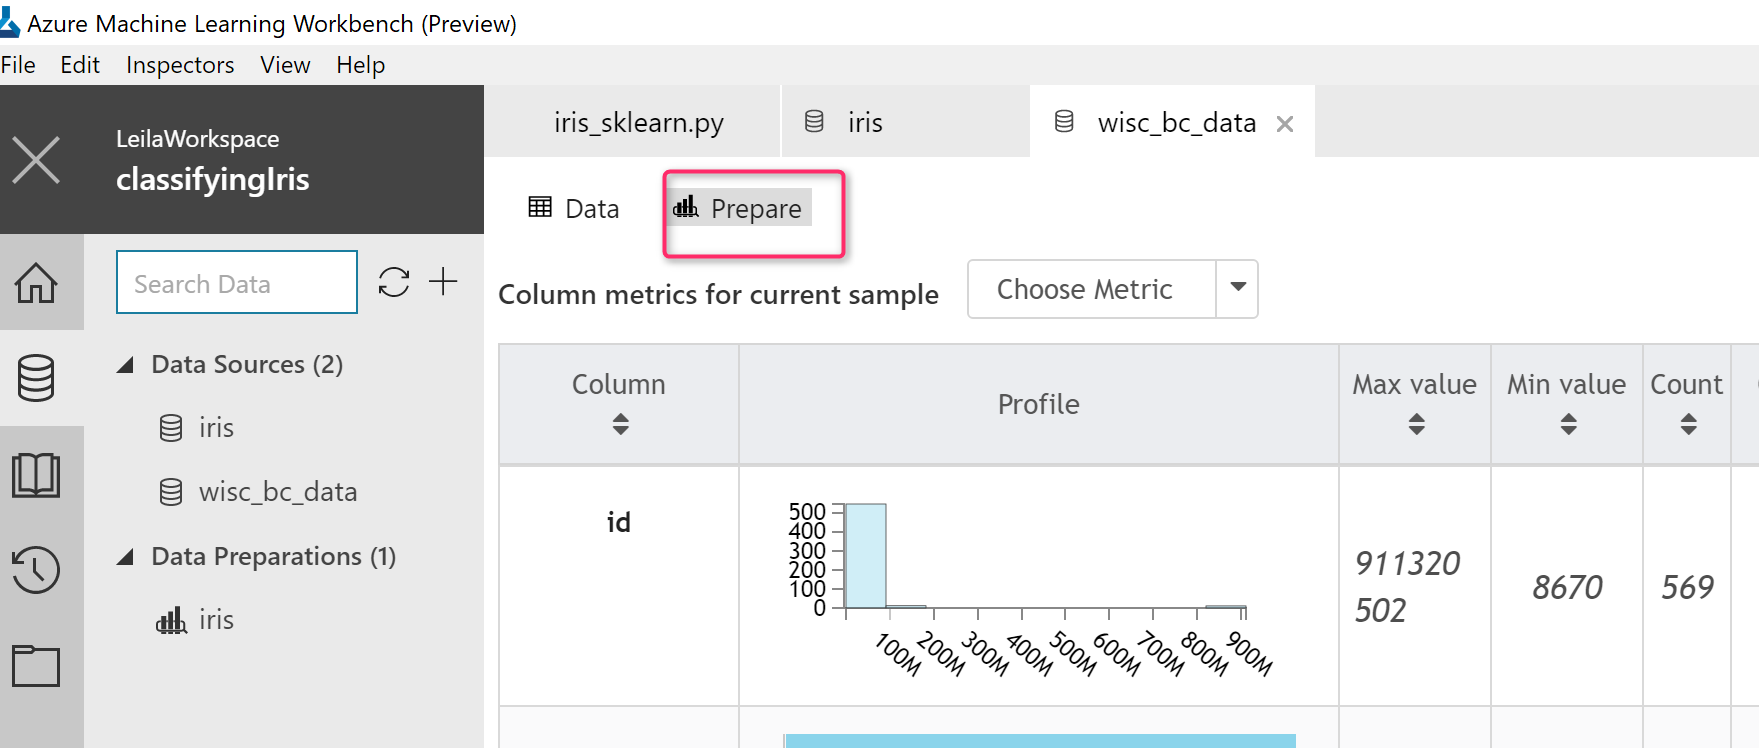
By clicking on the “prepare” icon, I will guide to the page for data wrangling. As you can see in the below picture, a new dataset has been created in Data Preparations section with new name “Cancer data” that I allocate. 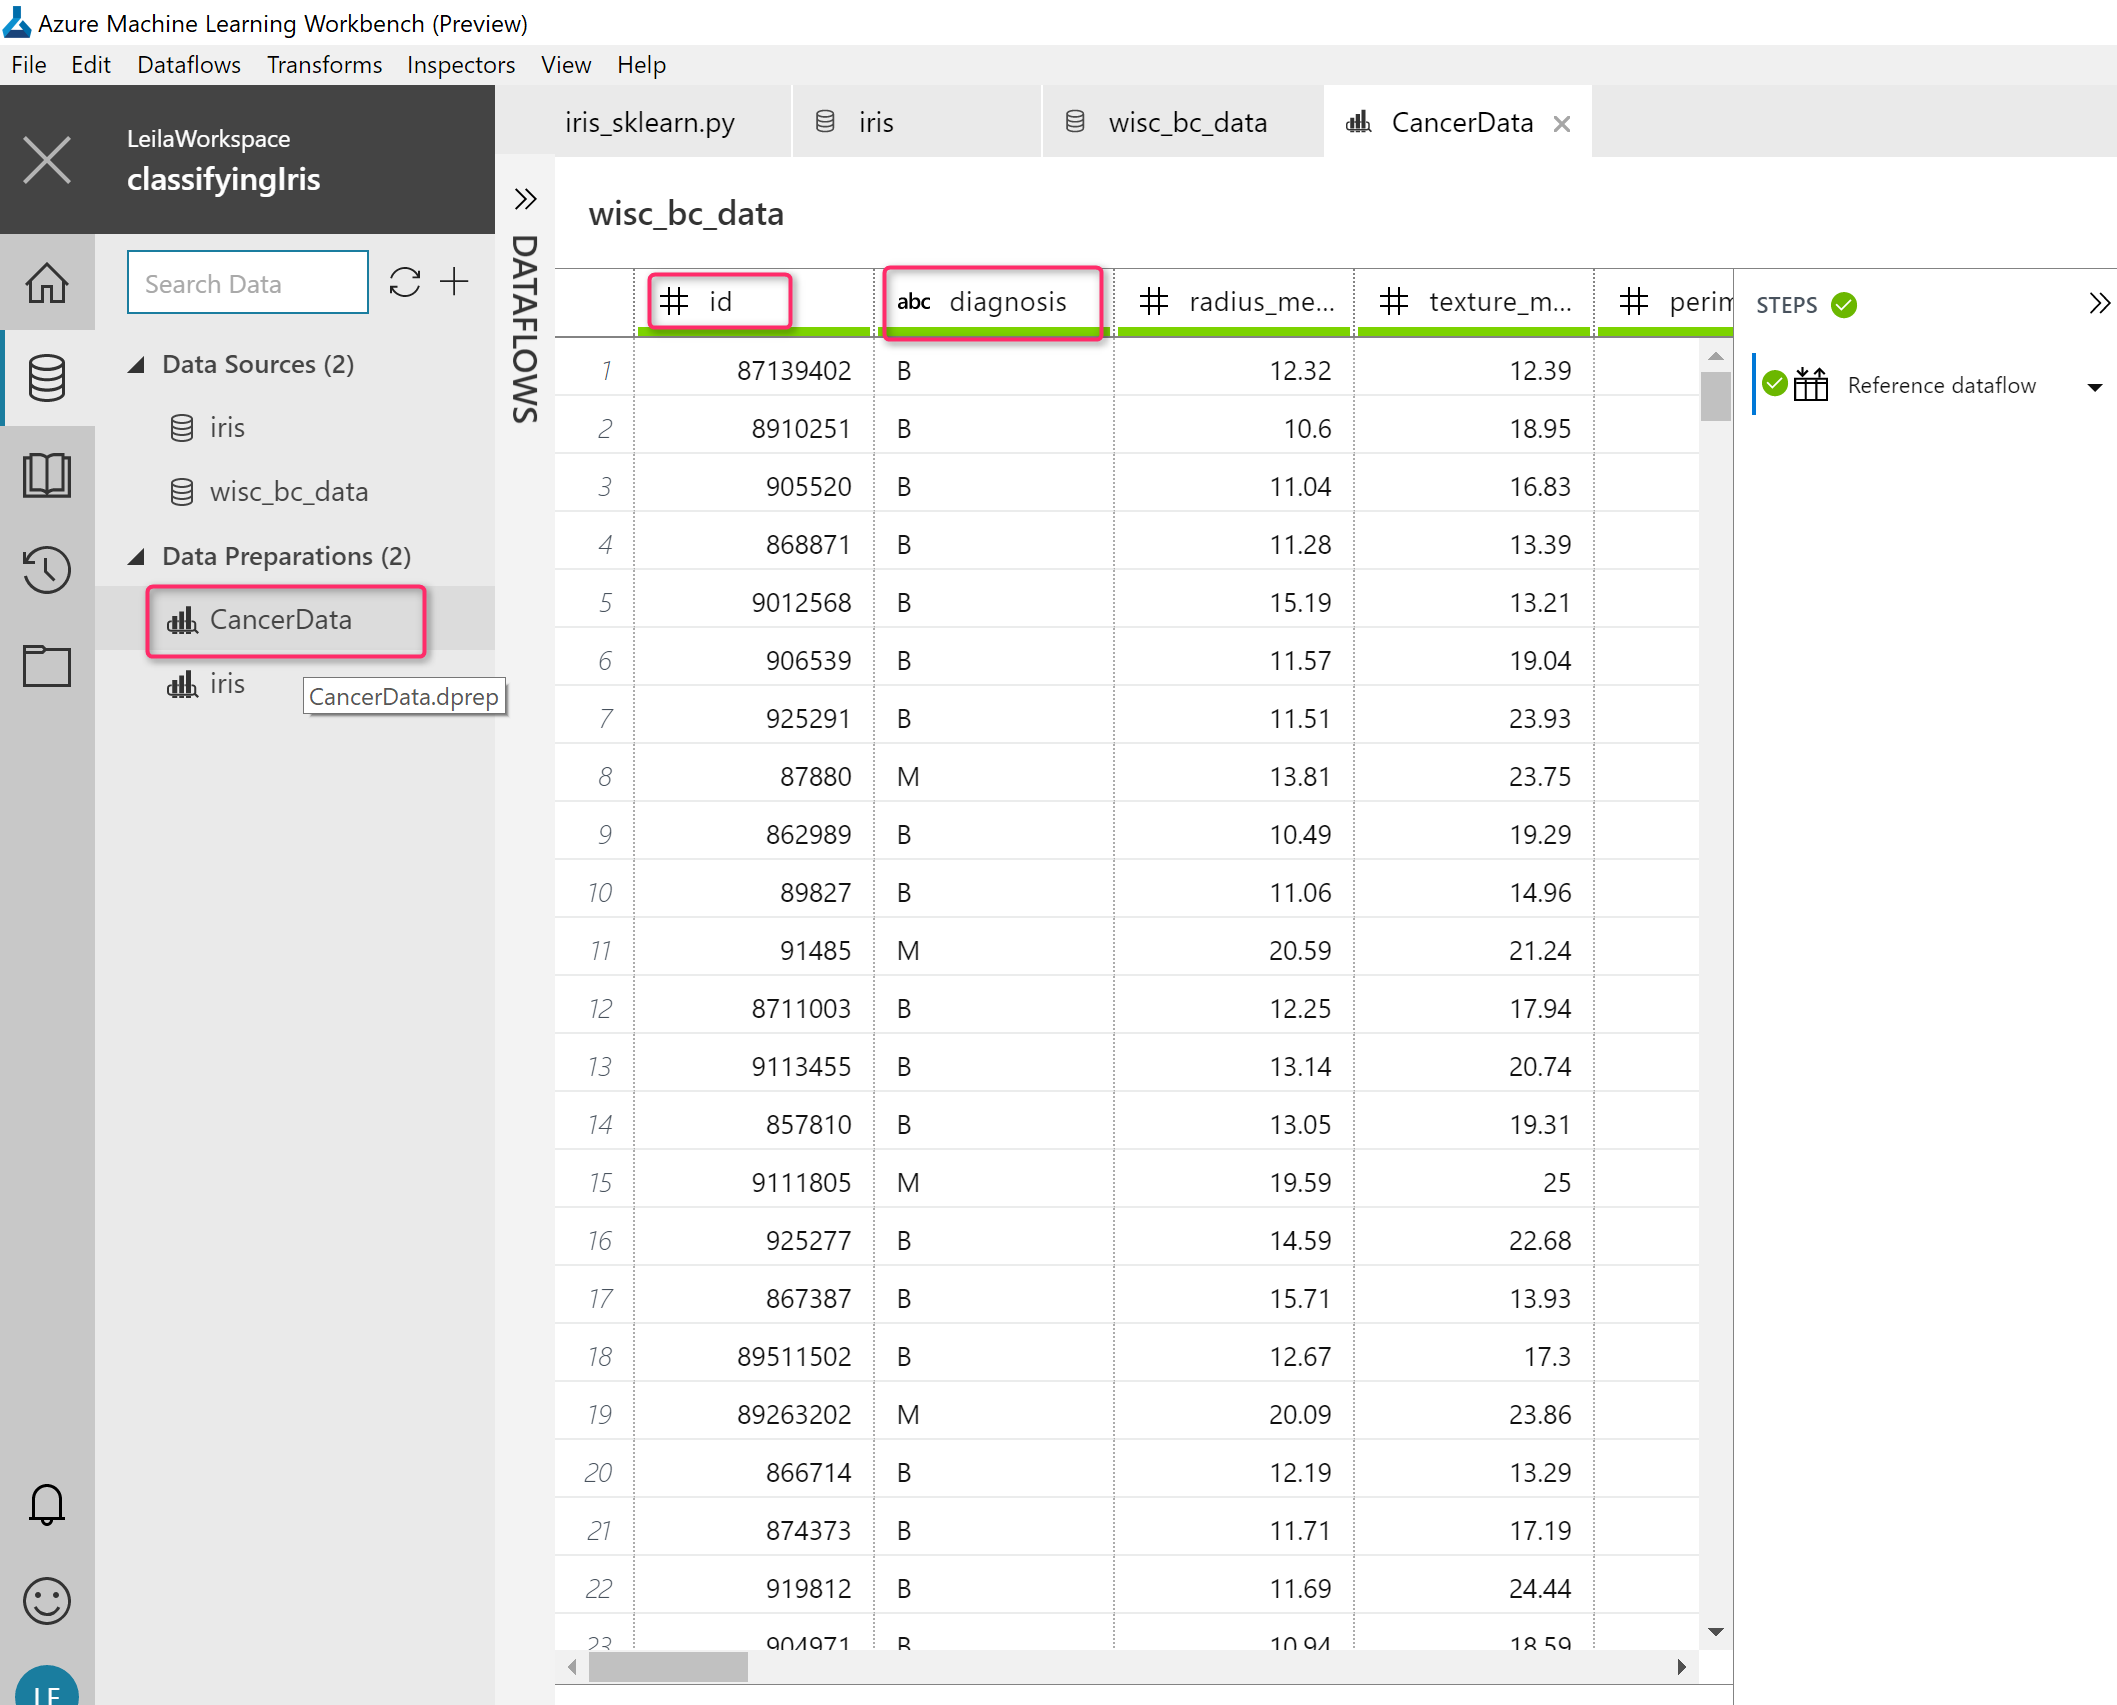
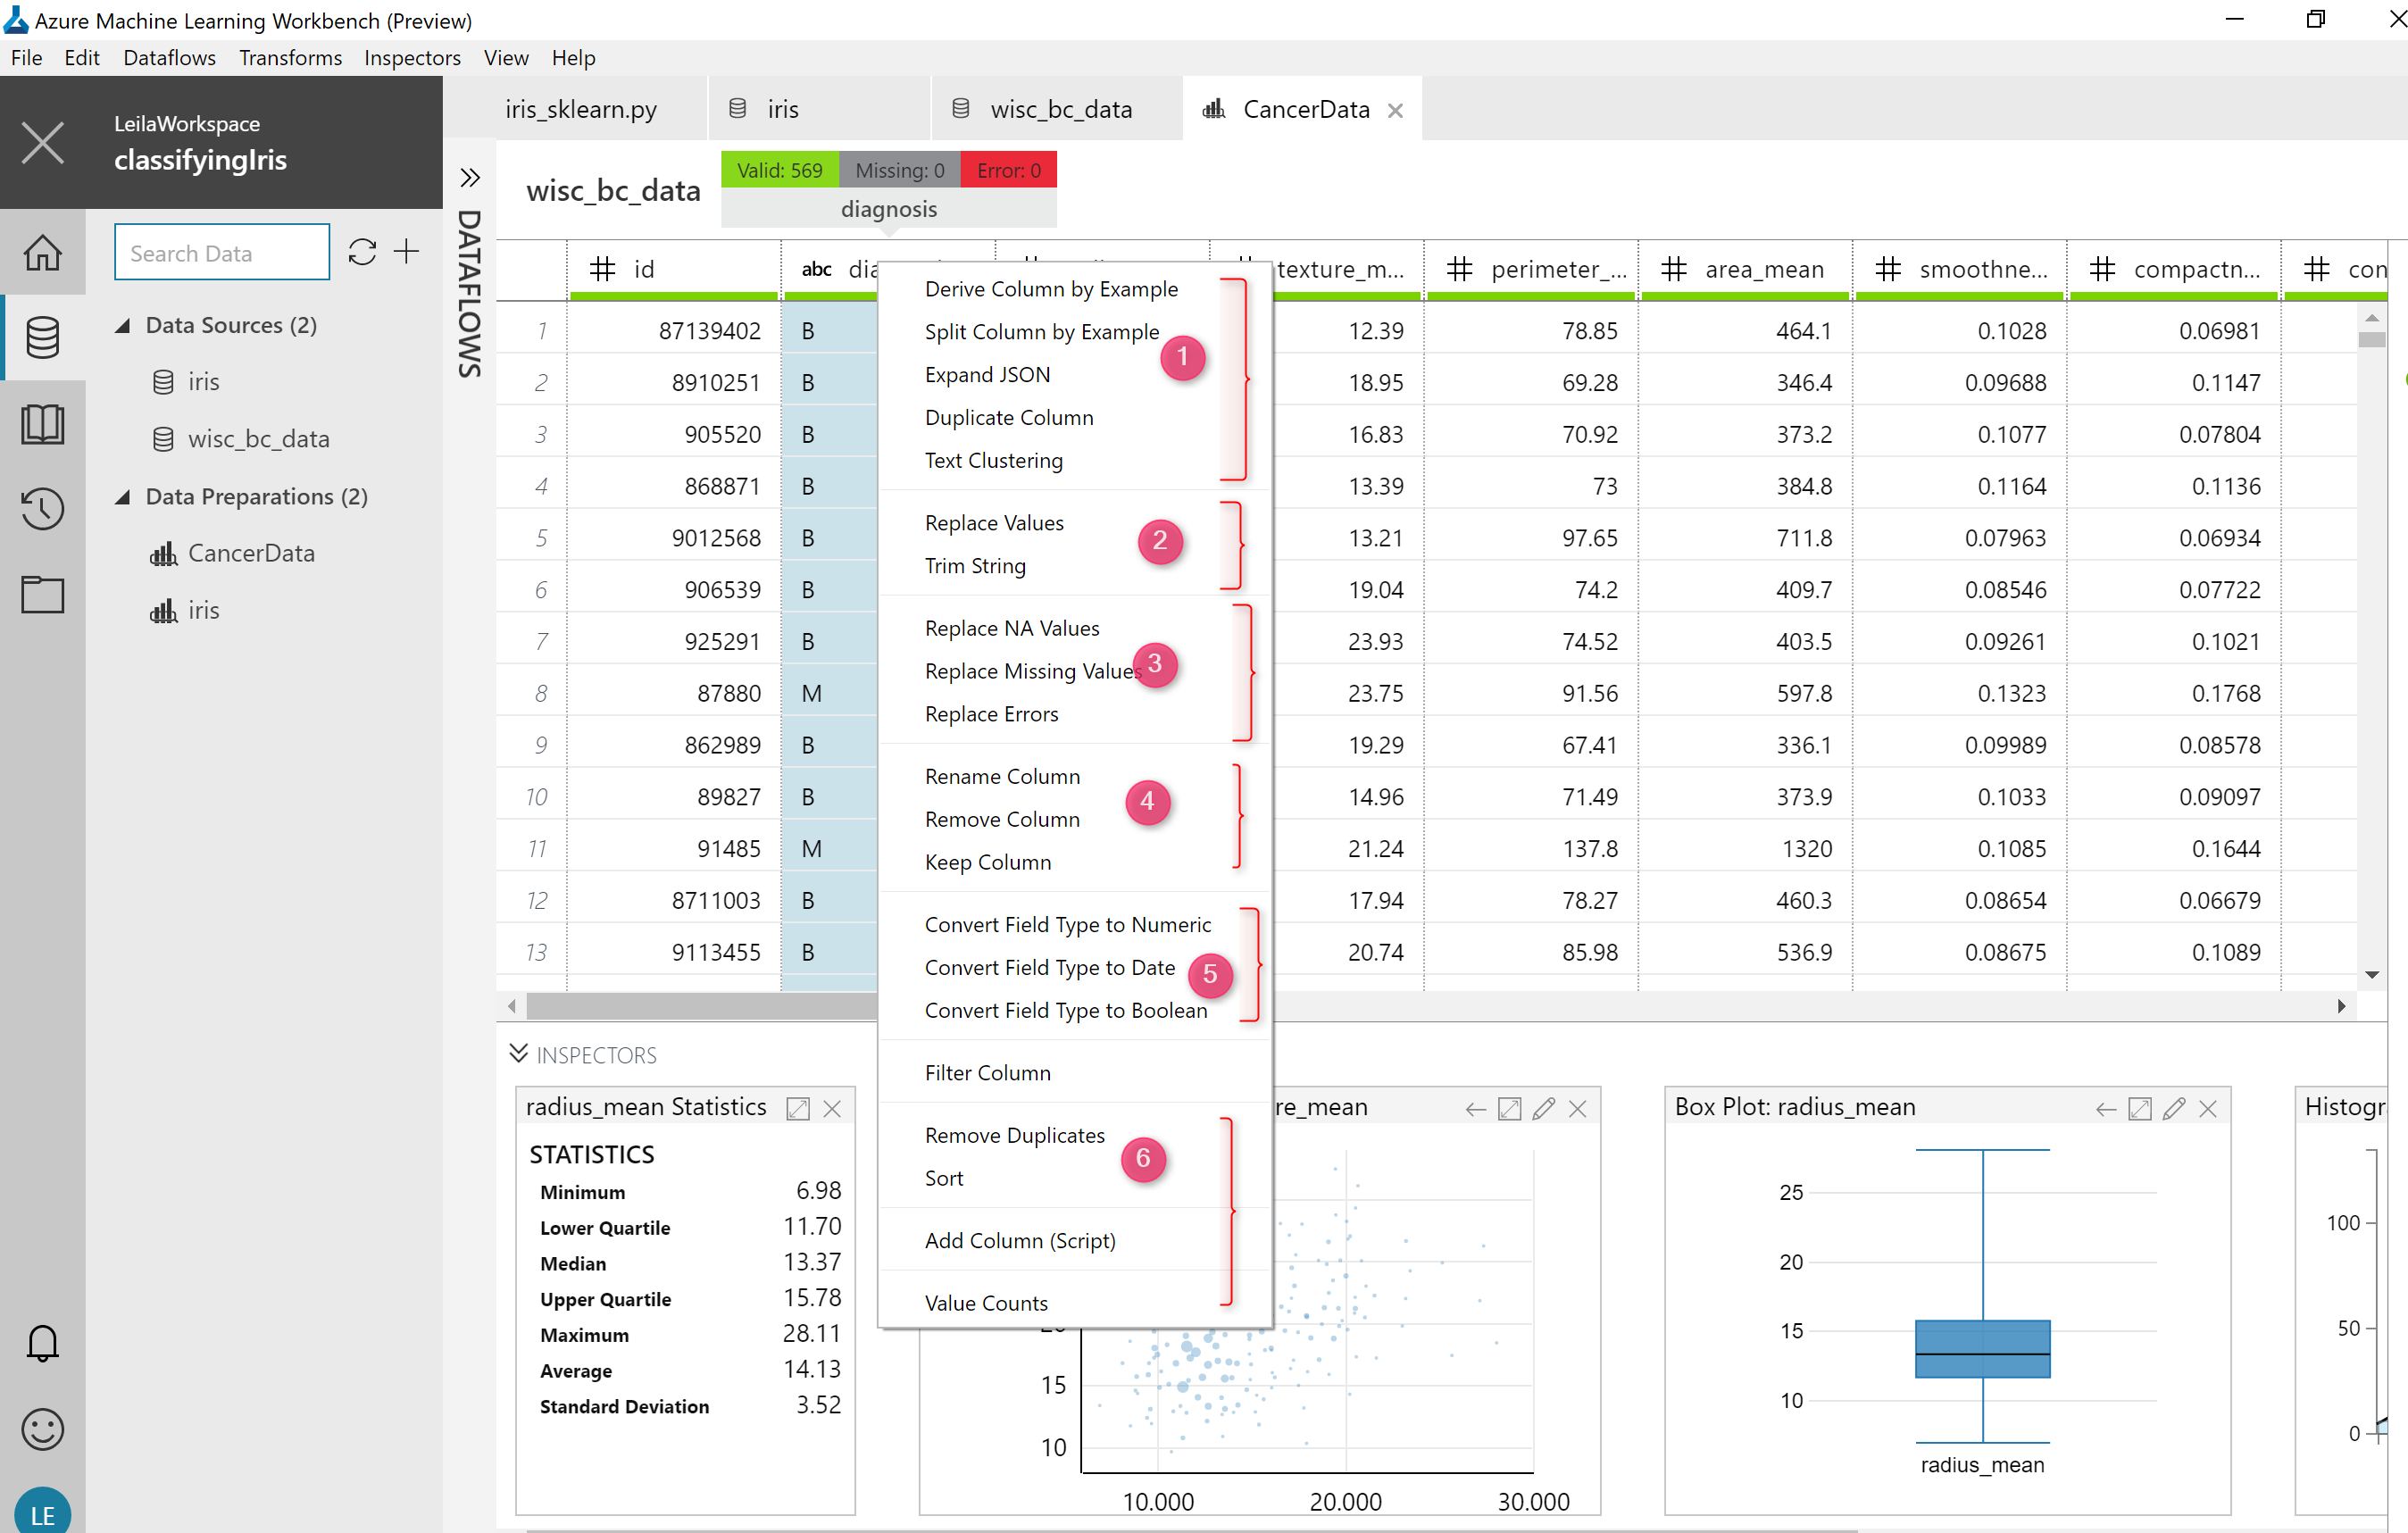
I just right-click on a numeric column, and there are many options for data cleaning there.
I able to replace “NZ” values, replace missing values, replace errors, rename or remove columns, convert the field to the string, remove duplicate, sort data.
However, one the interesting and exciting option for adding the diagrams. I am able to add some great diagram to the data preparation section.

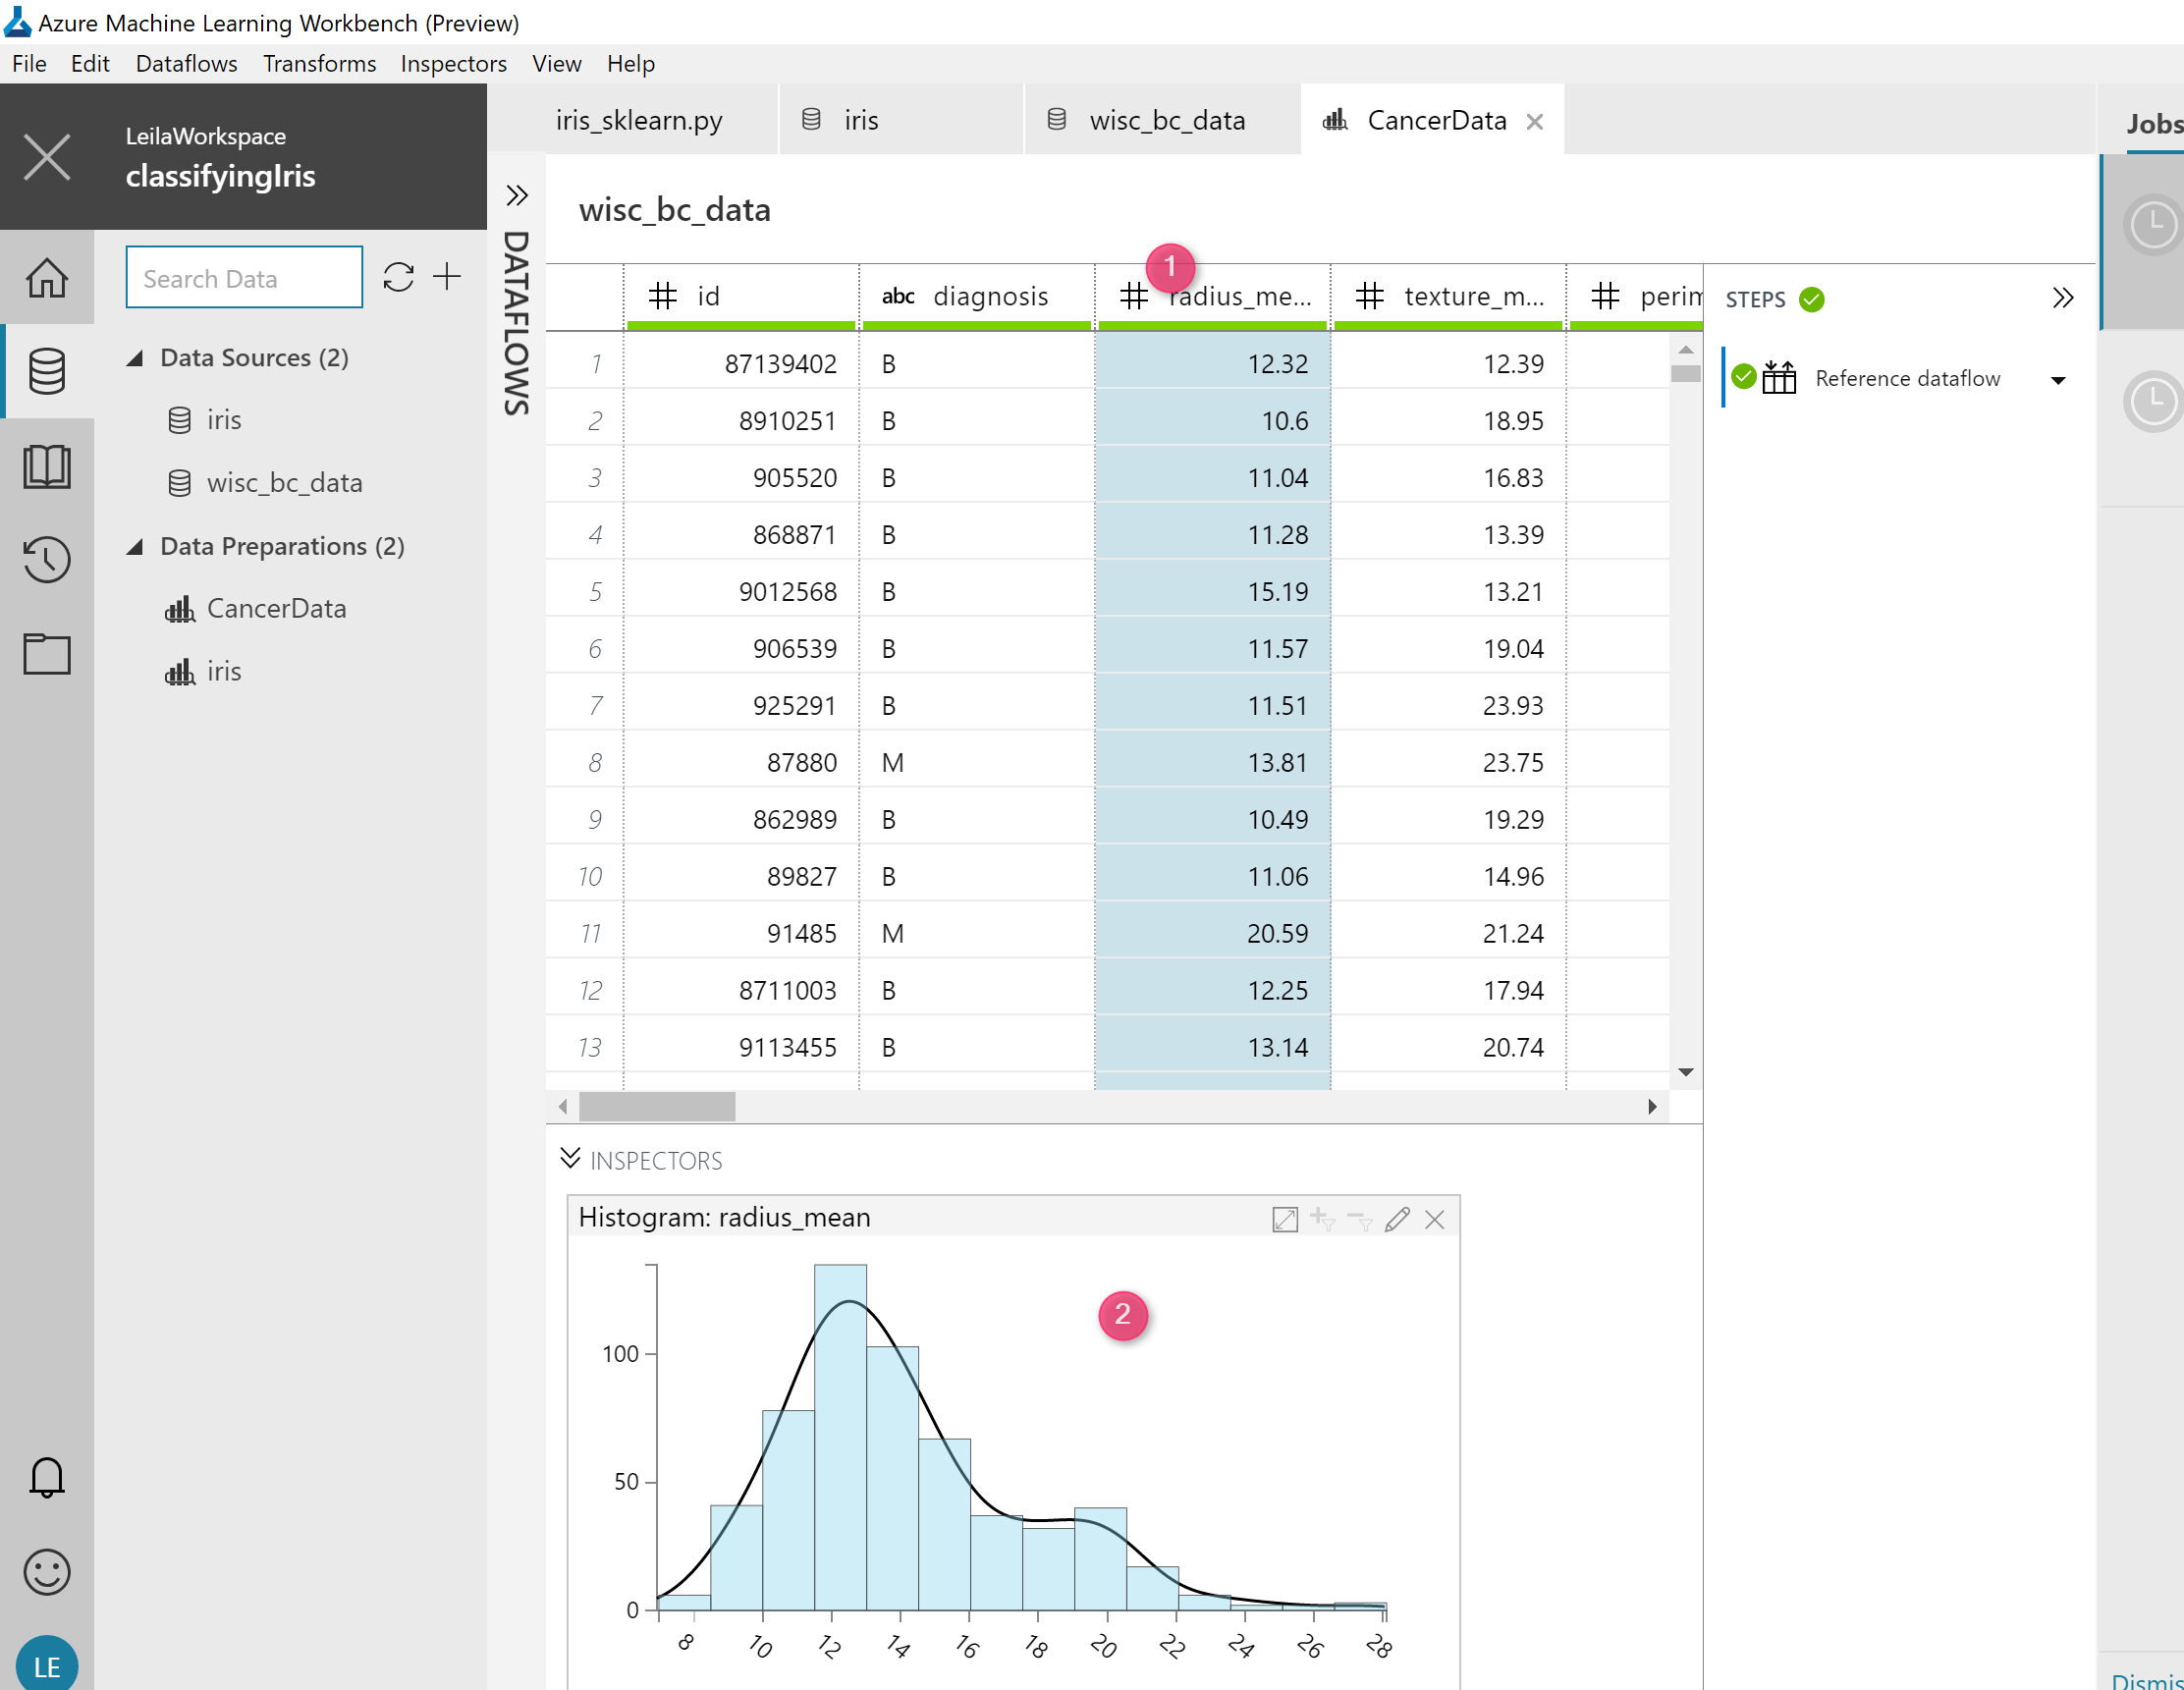
for instance, I am able to see the histogram of my columns as below.
or other charts such as scatter chart to compare the data to other columns, boxplot to see min, max, median, and outliers,

for each data type, we have specific data transformation. for instance for string data type we able to split column or expand it by JSON
This an overview about what we can do for data preparation before doing machine learning.
in the next post, I am going to show how to create a classification example using current dataset.


