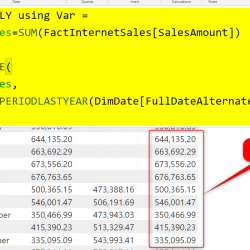
Slicer with AND condition in Power BI

The default behaviour of the slicer in Power BI is that it shows the result of OR when you select multiple items. For example, if you have a slicer for product colour, and then you select both “Black”, and “Blue” the result would be all records that have “Black”, OR “Blue”. Of course, you won’t Read more about Slicer with AND condition in Power BI[…]

Change the Source of Power BI Datasets Dynamically Using Power Query Parameters

Parameters in Power Query are useful for many scenarios when you want to do something dynamic in the data transformation process. I have previously explained how helpful they are in creating a custom function. In this article, I am showing you another useful way of using Parameters to create dynamic datasets, that you can change Read more about Change the Source of Power BI Datasets Dynamically Using Power Query Parameters[…]

Enhance the Card Visual in Power BI with Conditional Formatting

The conditional formatting can be used in many visuals in Power BI, and I have explained an example of doing it in table visual. This feature is also available in the Card Visual in Power BI, However, I have seen a very few people using it. In this short blog article, I’ll explain how this Read more about Enhance the Card Visual in Power BI with Conditional Formatting[…]

Calculating Total, and Percentages in a Row-Level Security Power BI Model

I have written dozens of articles about row-level security so far and explained in all of them explained different methods in which you can reduce the amount of data rows that a user can see based on their roles. However, in my presentations, I still get this question that: What if I want to compare Read more about Calculating Total, and Percentages in a Row-Level Security Power BI Model[…]

Get The Error Count with the Profiling Data of Power BI Data Table using Power Query

I have explained previously how you can use the Table.Profile Power Query function to fetch the profiling data of a table, such as minimum value, maximum value, null count etc, and use it in a report page to inform the user about the quality of the data. However, that function doesn’t provide you with one Read more about Get The Error Count with the Profiling Data of Power BI Data Table using Power Query[…]

Find The Data Value using LookupValue DAX Function in Power BI; Simple and Useful

LookupValue function is neither a new function in DAX nor a complex one. However, I figured out in my training courses and presentations, that there are still a few people aware of this function. This is a very simple, yet powerful function in DAX which is particularly helpful whenever you are looking to find a Read more about Find The Data Value using LookupValue DAX Function in Power BI; Simple and Useful[…]

What is Common Data Service (CDS) and why it is important for you if you use Power Apps or Power BI?

For the world of Power Apps users, the Common Data Services (CDS) might be more understandable, however, in the world of Power BI users, we still have many who don’t know what it is and what is the use cases of it. So I thought better to write about it in this article, and explain Read more about What is Common Data Service (CDS) and why it is important for you if you use Power Apps or Power BI?[…]

Learning About Power BI at Microsoft Ignite 2019 North America: Reza’s Sessions

If you are at Microsoft Ignite 2019 in Orlando, I have five streams of Power BI for you to watch; three sessions, and two podcasts. All on Power BI subject. If you are attending Ignite in person, I am more than happy to see you there. Otherwise, you can watch these sessions via live streaming. Read more about Learning About Power BI at Microsoft Ignite 2019 North America: Reza’s Sessions[…]

Key Influences Visual: Expand By Fields

  In the previous article, I have explained what is the key influencers visual and how it works. Later the count and impact have been explained in the other Post. Initially, Key Influencers visual just has two data fields: Analyze and Explained by the Analyze fields, analyse the data based on row by row, so Read more about Key Influences Visual: Expand By Fields[…]