
Sometimes we just need to see the natural trend and behaviour of data without doing any predictions. we just want to check how our business data can be naturally grouped.
According to the Wikipedia , Cluster analysis or clustering is the task of grouping a set of objects in such a way that objects in the same group (called a cluster) are more similar (in some sense or another) to each other than to those in other groups (clusters).
For instance, we are interested in grouping our customers based on their purchase behaviour, demographic information [1]. Or in science example, we want to cluster the number and severity of earth quick happened in New Zealand for the past 10 years, or for medical purpose, we want to classify our patients with cancer based on their laboratory results.
Clustering is non supervised learning that means we are not going to assign any label for algorithm.
In this post, I am going to explain the main concepts behind the k-mean clustering and then in next post I will show you how I am able to use clustering to classify my Fitbit data using Power BI report.

Fitbit is an activity tracker, wireless-enable wearable technology device that measures data such as: number of steps, heart rate, quality of sleep, steps climbed, calorie burned and so forth.
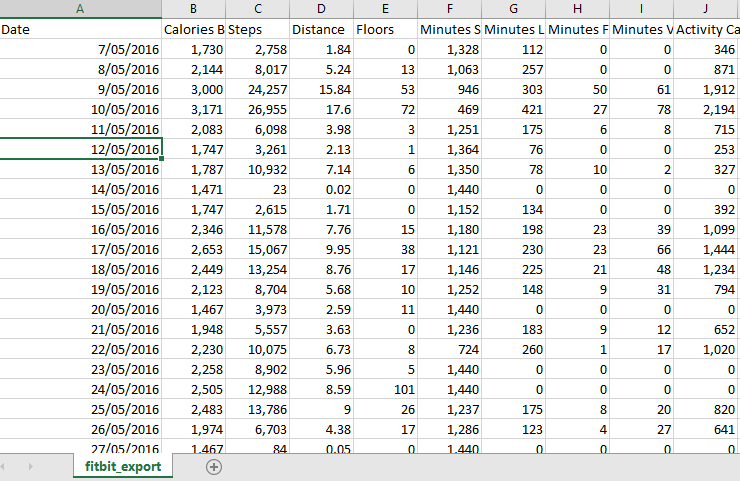
I have downloaded my history of my activities in Excel format from Fitbit website (see below page)
as you can see, information such as calories burned, number of steps, distance, Floors, minute activities and so forth have been recorded.
as you can see, information such as calories burned, number of steps, distance, Floors, minute activities and so forth were recorded.
Now, I imported these data into the Power BI desktop to do some data transformation to remove unnecessary columns . Finally, I came up with the below table!
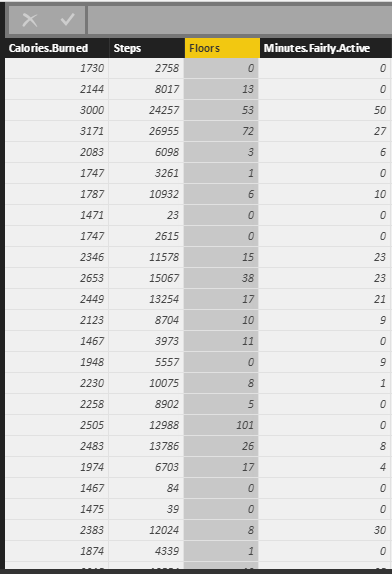
My aim is to see grouped data based on calories burn, step number, floors and active minute. This helps me to see while I have high calories burned, did I have also high number of steps or just because of number of activities have high calories burnt.
Before explaining how I am going to use k-mean clustering to group my Fitbit data, first in this post, let me show an example on how k-mean clustering works. I will explain the concepts by using the good example provided by this blog [2].
There are different clustering approaches that proposed by different researchers. One of the popular ones is k-mean clustering. In K-mean clustering, K stands for number of clusters that we want to have from data. Mean is the mean of the clusters (centroid). That means we classify the data based on their average distance to the centre of each cluster.
Imagining that we have a series of data as below, each individual with two set of value :A and B
| Individuals | Value A | Value B |
| 1 | 1 | 1 |
| 2 | 1.5 | 2 |
| 3 | 3 | 4 |
| 4 | 5 | 7 |
| 5 | 3.5 | 5 |
| 6 | 4.5 | 5 |
| 7 | 3.5 | 4.5 |
to cluster this dataset, we decided to have just two clusters, so it is a 2-mean (k-mean). first I created 2 clusters based on the smallest and largest values. The smallest value is individual 1 with A & B (1,1). and the largest one is individual 4 with (5 ,7). we consider individual one is cluster one and individual 4 is cluster 2.
Then, we have two clusters with the below specifications
| Cluster | Individuals | Mean Vector (centroid) |
| 1 | 1 | (1,1) |
| 2 | 4 | (5,7) |
Next step is to find the distance of other each individual from each of the two clusters. for example, for individual 2 we have to calculate its distance to cluster 1 (which currently just has individual one) and also calculate individual 2 distance value to cluster 2 (which has individual 4). I am using Euclidean distance to calculate distances.
| Cluster | distance to cluster | |
| 1 | sqrt ((1-1.5)^2+(1-2)^2)=1.11 | |
| 2 | sqrt ((5-1.5)^2+(7-2)^2)=6.11 |
So we choose the cluster 1(1.11) because it has the closet distance to the individual 2 than cluster 2 (6.11). At the beginning, the mean of cluster 1 was (1,1) since it only included individual 1. Now by adding individual 2 to cluster 1 we need a new “mean value” for cluster 1. we call the mean value of cluster as “centroid”.
The mean (centroid) cluster 1 is the average of vectors for individual 1 and 2, so the new centroid for cluster 1 can be calculated via ( (1+1.5)/2, (1+2)/2)=(1.2,1.5).
We did all of the above processes for all individuals, and came up with the below table of results. If I want to explain the process, it will be as below:
In step one, subject 1 compared with subject 1 (itself), so the centroid is individual value (1 1) and we have just one element in cluster 1.
the same for subject 4 in step 1.the centroid in cluster 2 will be the individual 4 value.
in step 2 we found that subject 3 has closet distance with subject 1 than 4. so we updated the centroid for cluster 1 (mean of the subject 1 and 3), we came up with the new centroid as (1.2, 1.5). and in the cluster 1 we have 2 elements and in the cluster 2 just one.
We followed the steps till all subjects were allocated to a cluster. In the step 6, which is final step, we have 3 elements in the cluster 1, and 4 elements in the cluster 2.
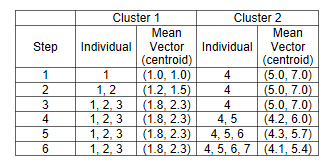
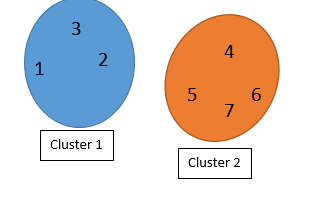
So we can say individuals 1,2, and 3 belong to cluster 1 and individuals 4,5,6,7 belongs to cluster 2.
The best clustering result is when each individual has the closet distance to its cluster’s mean (centroid). In our example the individual 1,2,3 should have the closet distance to their centroid which is (1.8,2.3). also they should have the longest distance to other cluster’s centroid.
However,
the clustering is not finished! We should find the distance between each element with its cluster centroid (step 6 in above table) and also with other cluster centroid. Maybe some elements belong to other clusters.
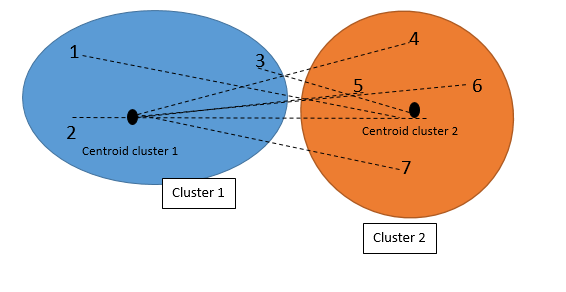
So first we check the distance with other Clusters (see first picture). Then we calculate the distance with other cluster centroid
The below picture shows the distance of each individual to the centroid of the other clusters (not their own):
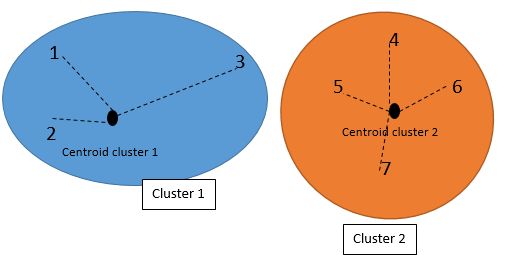
The below picture shows the distance of each individual with their own cluster’s centroid.
Finally we came out with the below numbers. as you can see in below tables, the individual 3 now has closet distance to the cluster 2 than Cluster 1.
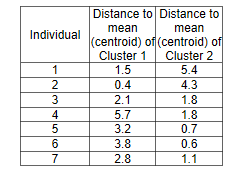
So, now we have to rearrange the clustering as below.
Individual 1 and 2 belong to cluster 1, and individual 3,4,5,6,7 belongs to cluster 2.
This example tries to explain the overall process of clustering. So, Now I am able to show you how I applied clustering algorithm on my fit bit data in the Power BI in the next post.
[1] http://blogs.sas.com/content/subconsciousmusings/2016/05/26/data-mining-clustering/#prettyPhoto/0/
[2] http://mnemstudio.org/clustering-k-means-example-1.htm


