
In the last post, I have explained how we can create a function with the aim of parametrising the machine learning process. In this post, I am going to explain how we able to create a Development and Production environment.

Create Different Environment in Power Query
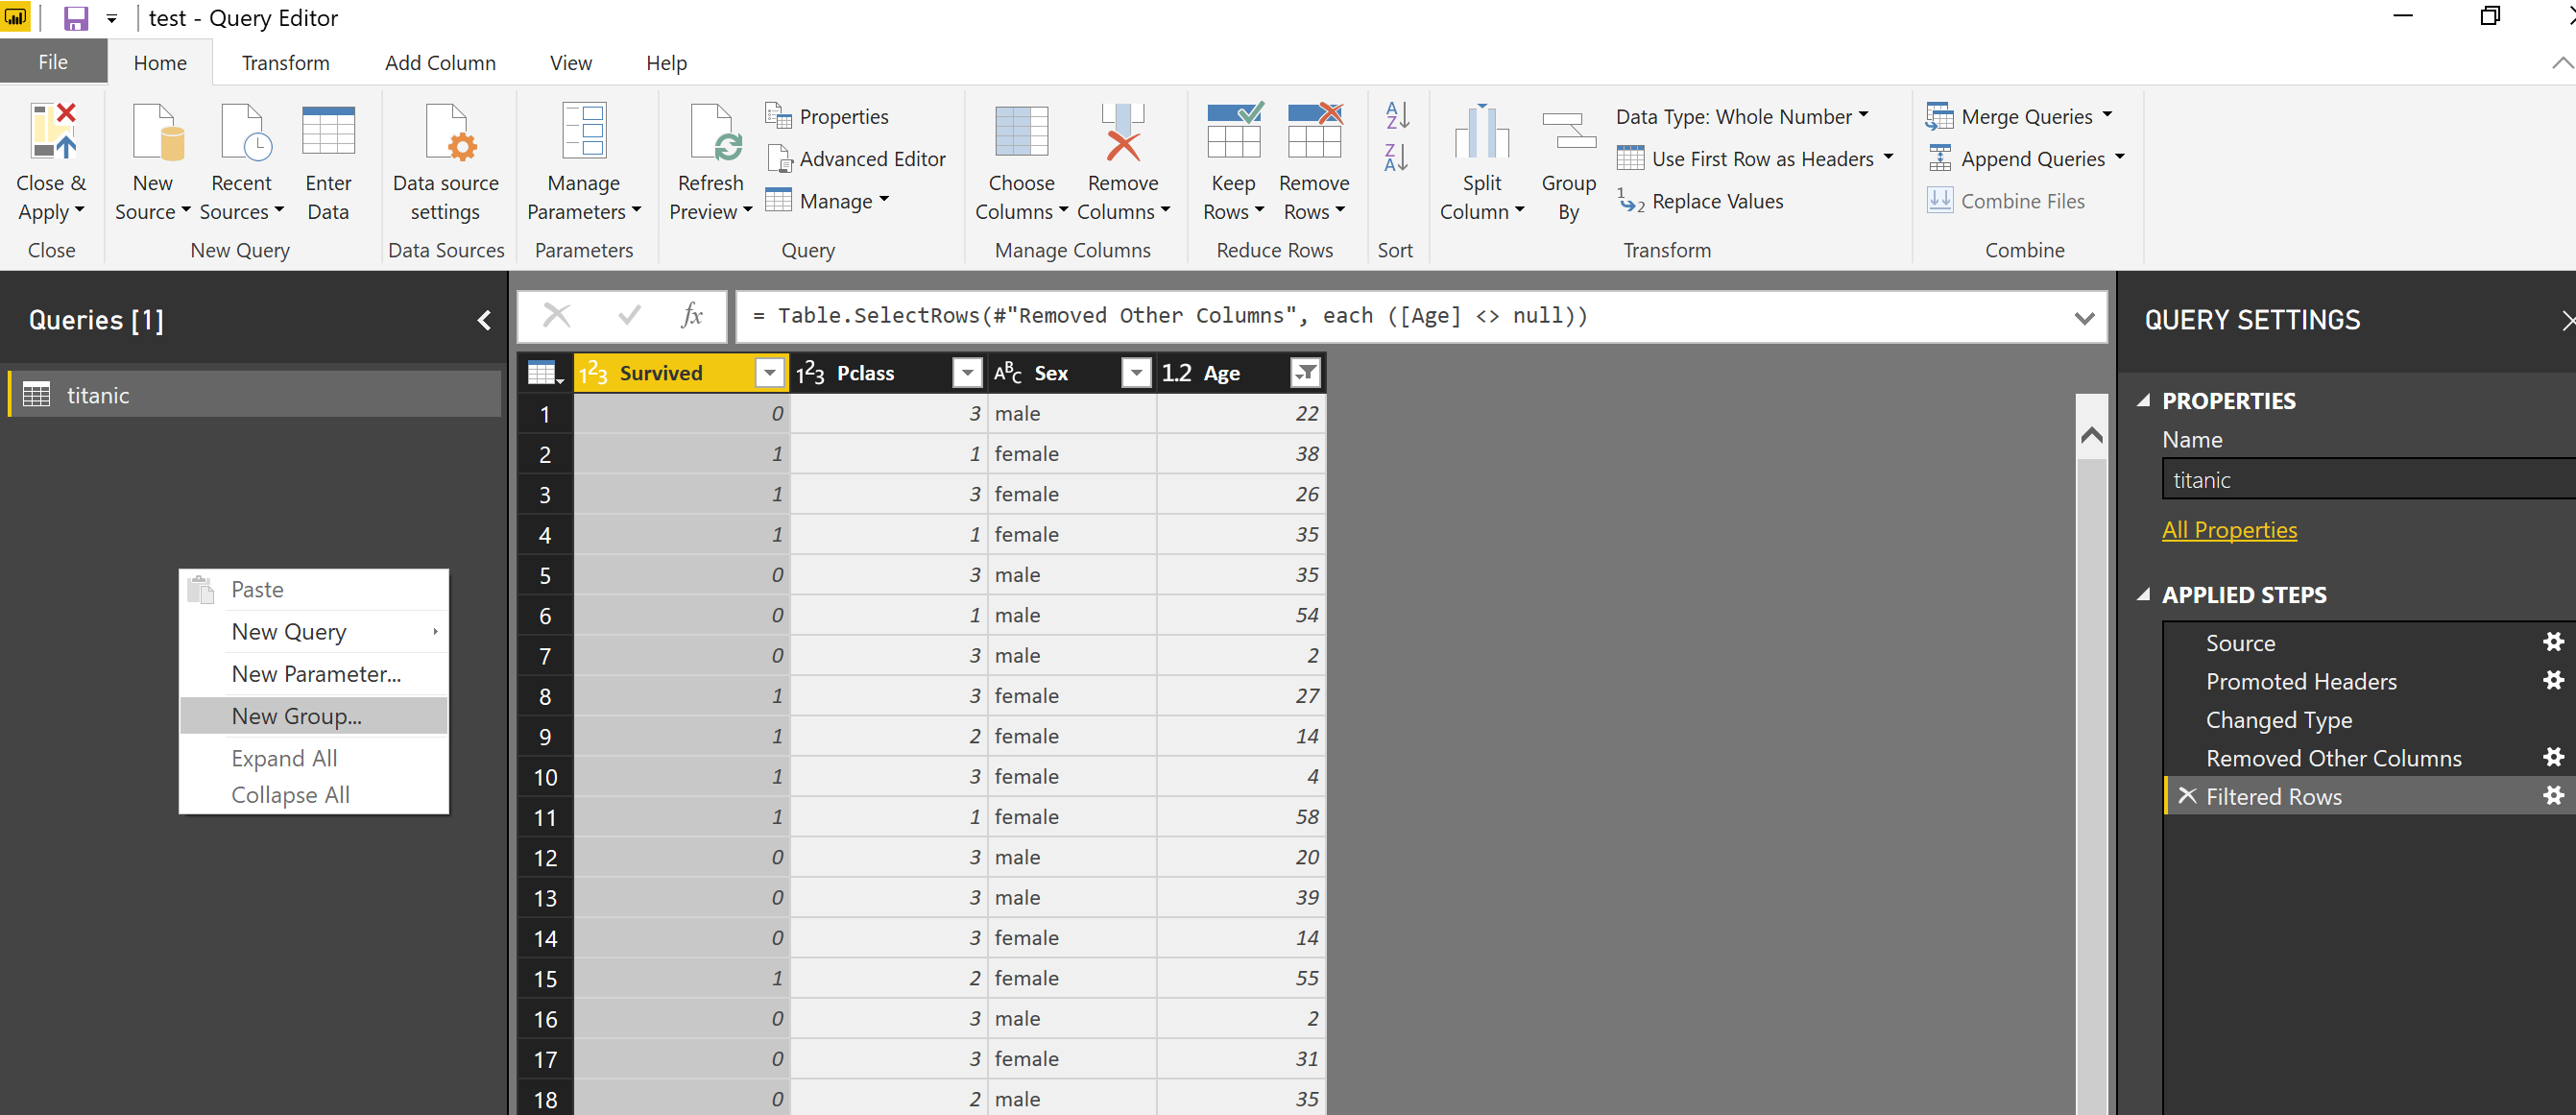
to create a new environment, In power query, I created two main groups one for “Develop” and the other one for “Production”. To create a different group, I just right-click in the Query window, then create two separate group.
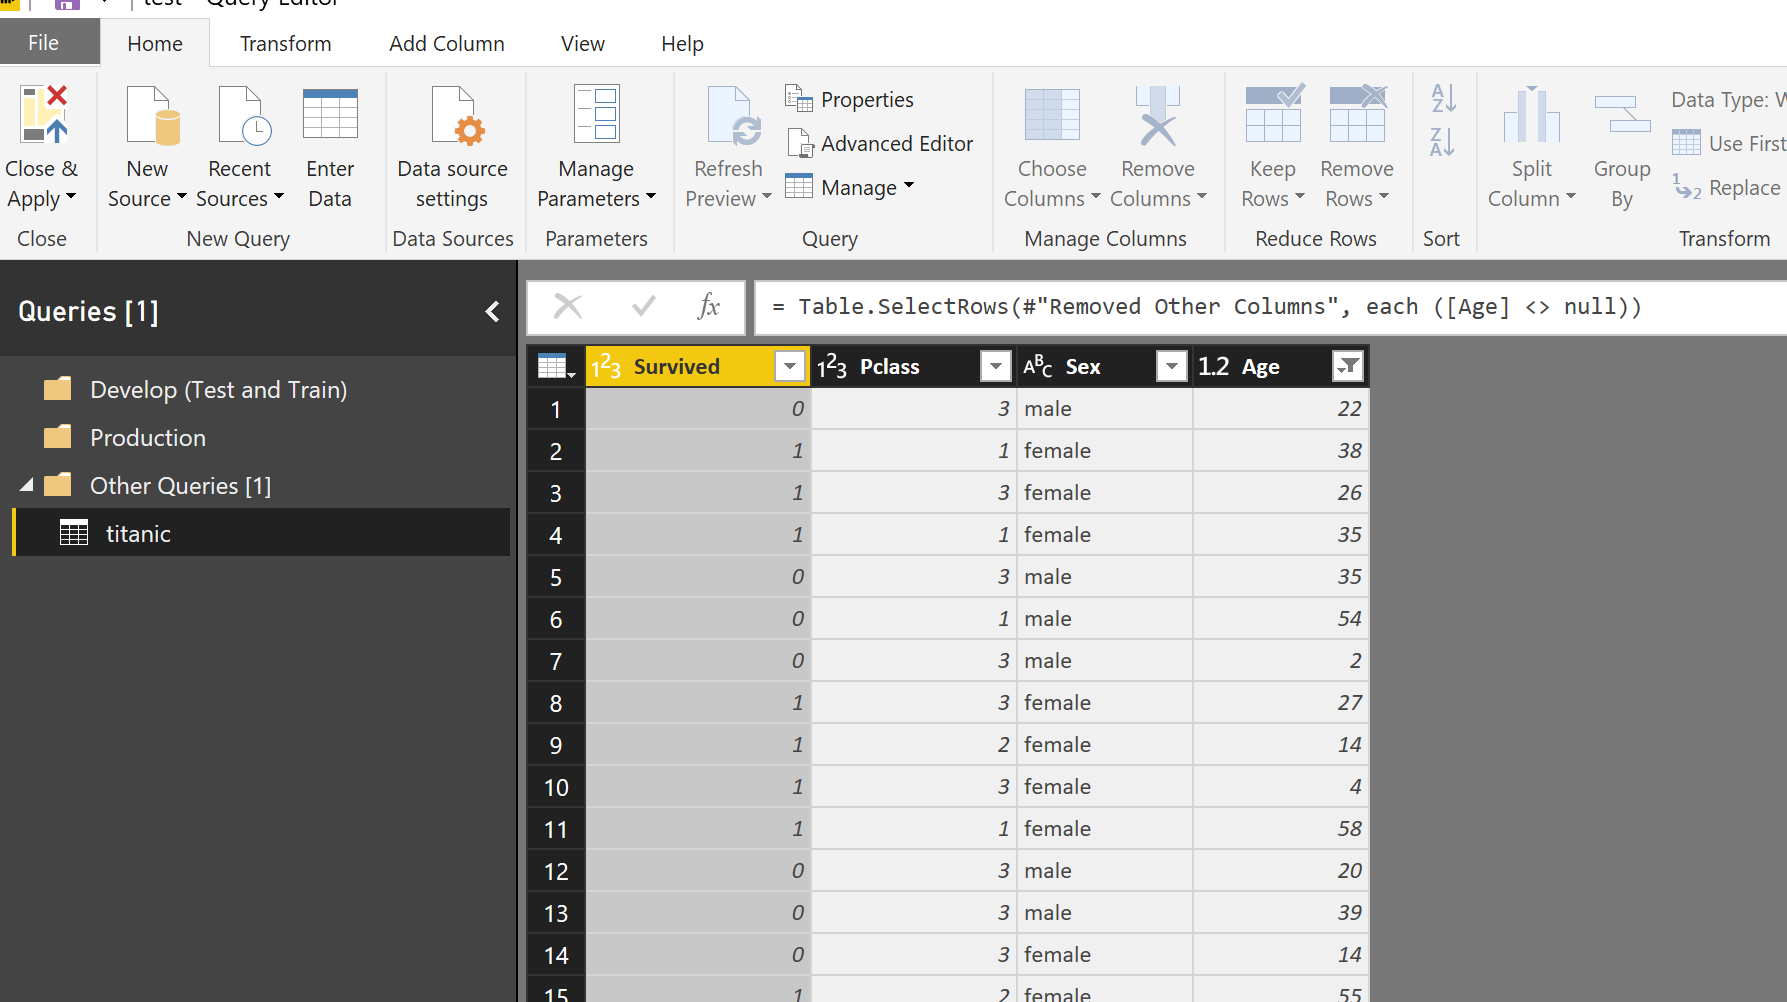
Develop (Test and Train)
First, I create a function to train a model and get the result of the evaluation. In this post, I will show how I leverage “rpart” a decision tree algorithm and “knn” both for classification.
First, I write some R codes to train models and also to evaluate the algorithm.
for “rpart” I have :
Train model for rpart :
library(rpart)
library(hydroGOF)
Nrows<-nrow(dataset)
ShufffelData<-sample(Nrows,0.8*Nrows)
Train<-dataset[ShufffelData,]
Test<-dataset[-ShufffelData,]
DT <- rpart(Survived~., data = Train, method = "class")
predictions <- predict(DT, Test)
 Pred<-data.frame(Test$Survived)
 names(Pred)[1]<-paste("actual")
i=1   for(i in 1:nrow(Test))
if(predictions[i,1]>=predictions[i,2]) {  Pred[i,2]<-"0"} else  {  Pred[i,2]<-"1")}
 names(Pred)[2]<-paste("prediction")
Test Model
cm <-as.matrix(table(Actual = Pred$actual, Predicted =Pred$prediction ))
sumtest<-sum(cm)
NrowTest<-nrow(cm)
diag <- diag(cm)
rowsums = apply(cm, 1, sum)
colsums = apply(cm, 2, sum)
p = rowsums / sumtest
q = colsums / sumtest
accuracy = sum(diag) / sumtest
precision = diag / colsums
 recall = diag / rowsums
f1 = 2 * precision * recall / (precision + recall)
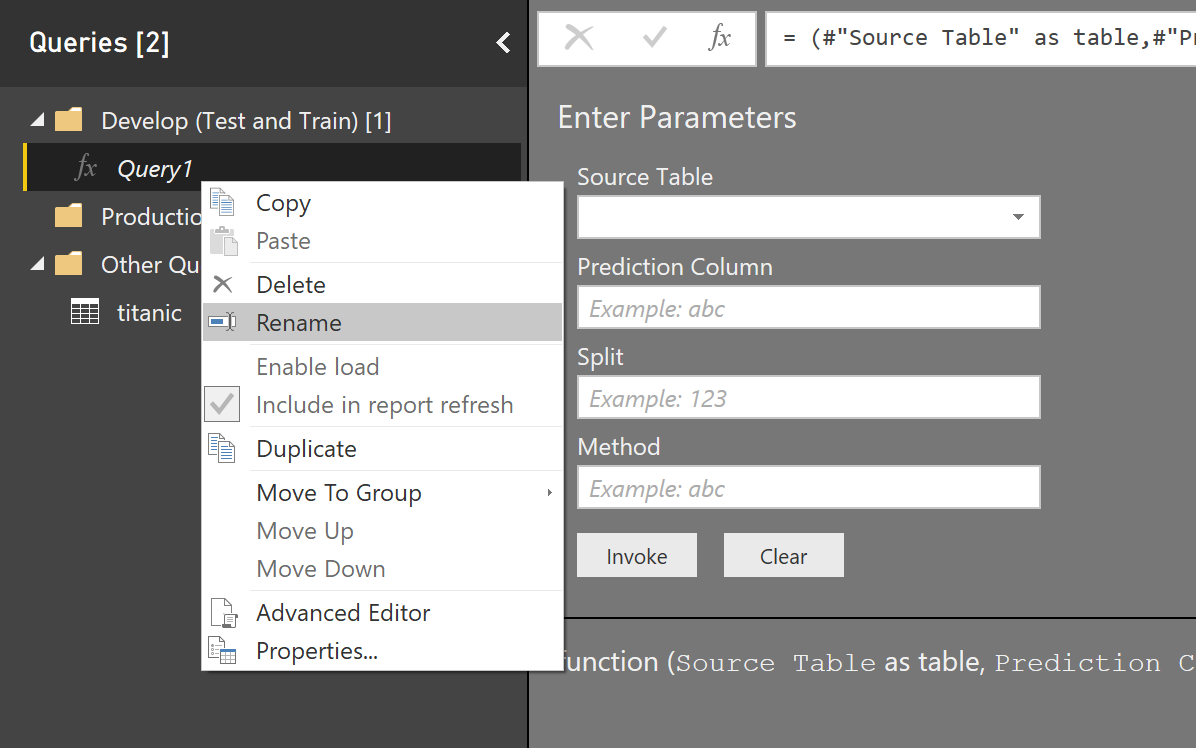
Then I follow the steps in the last post, to create a function and pass the parameters such as “dataset” for training, split percentage, the column name for prediction.
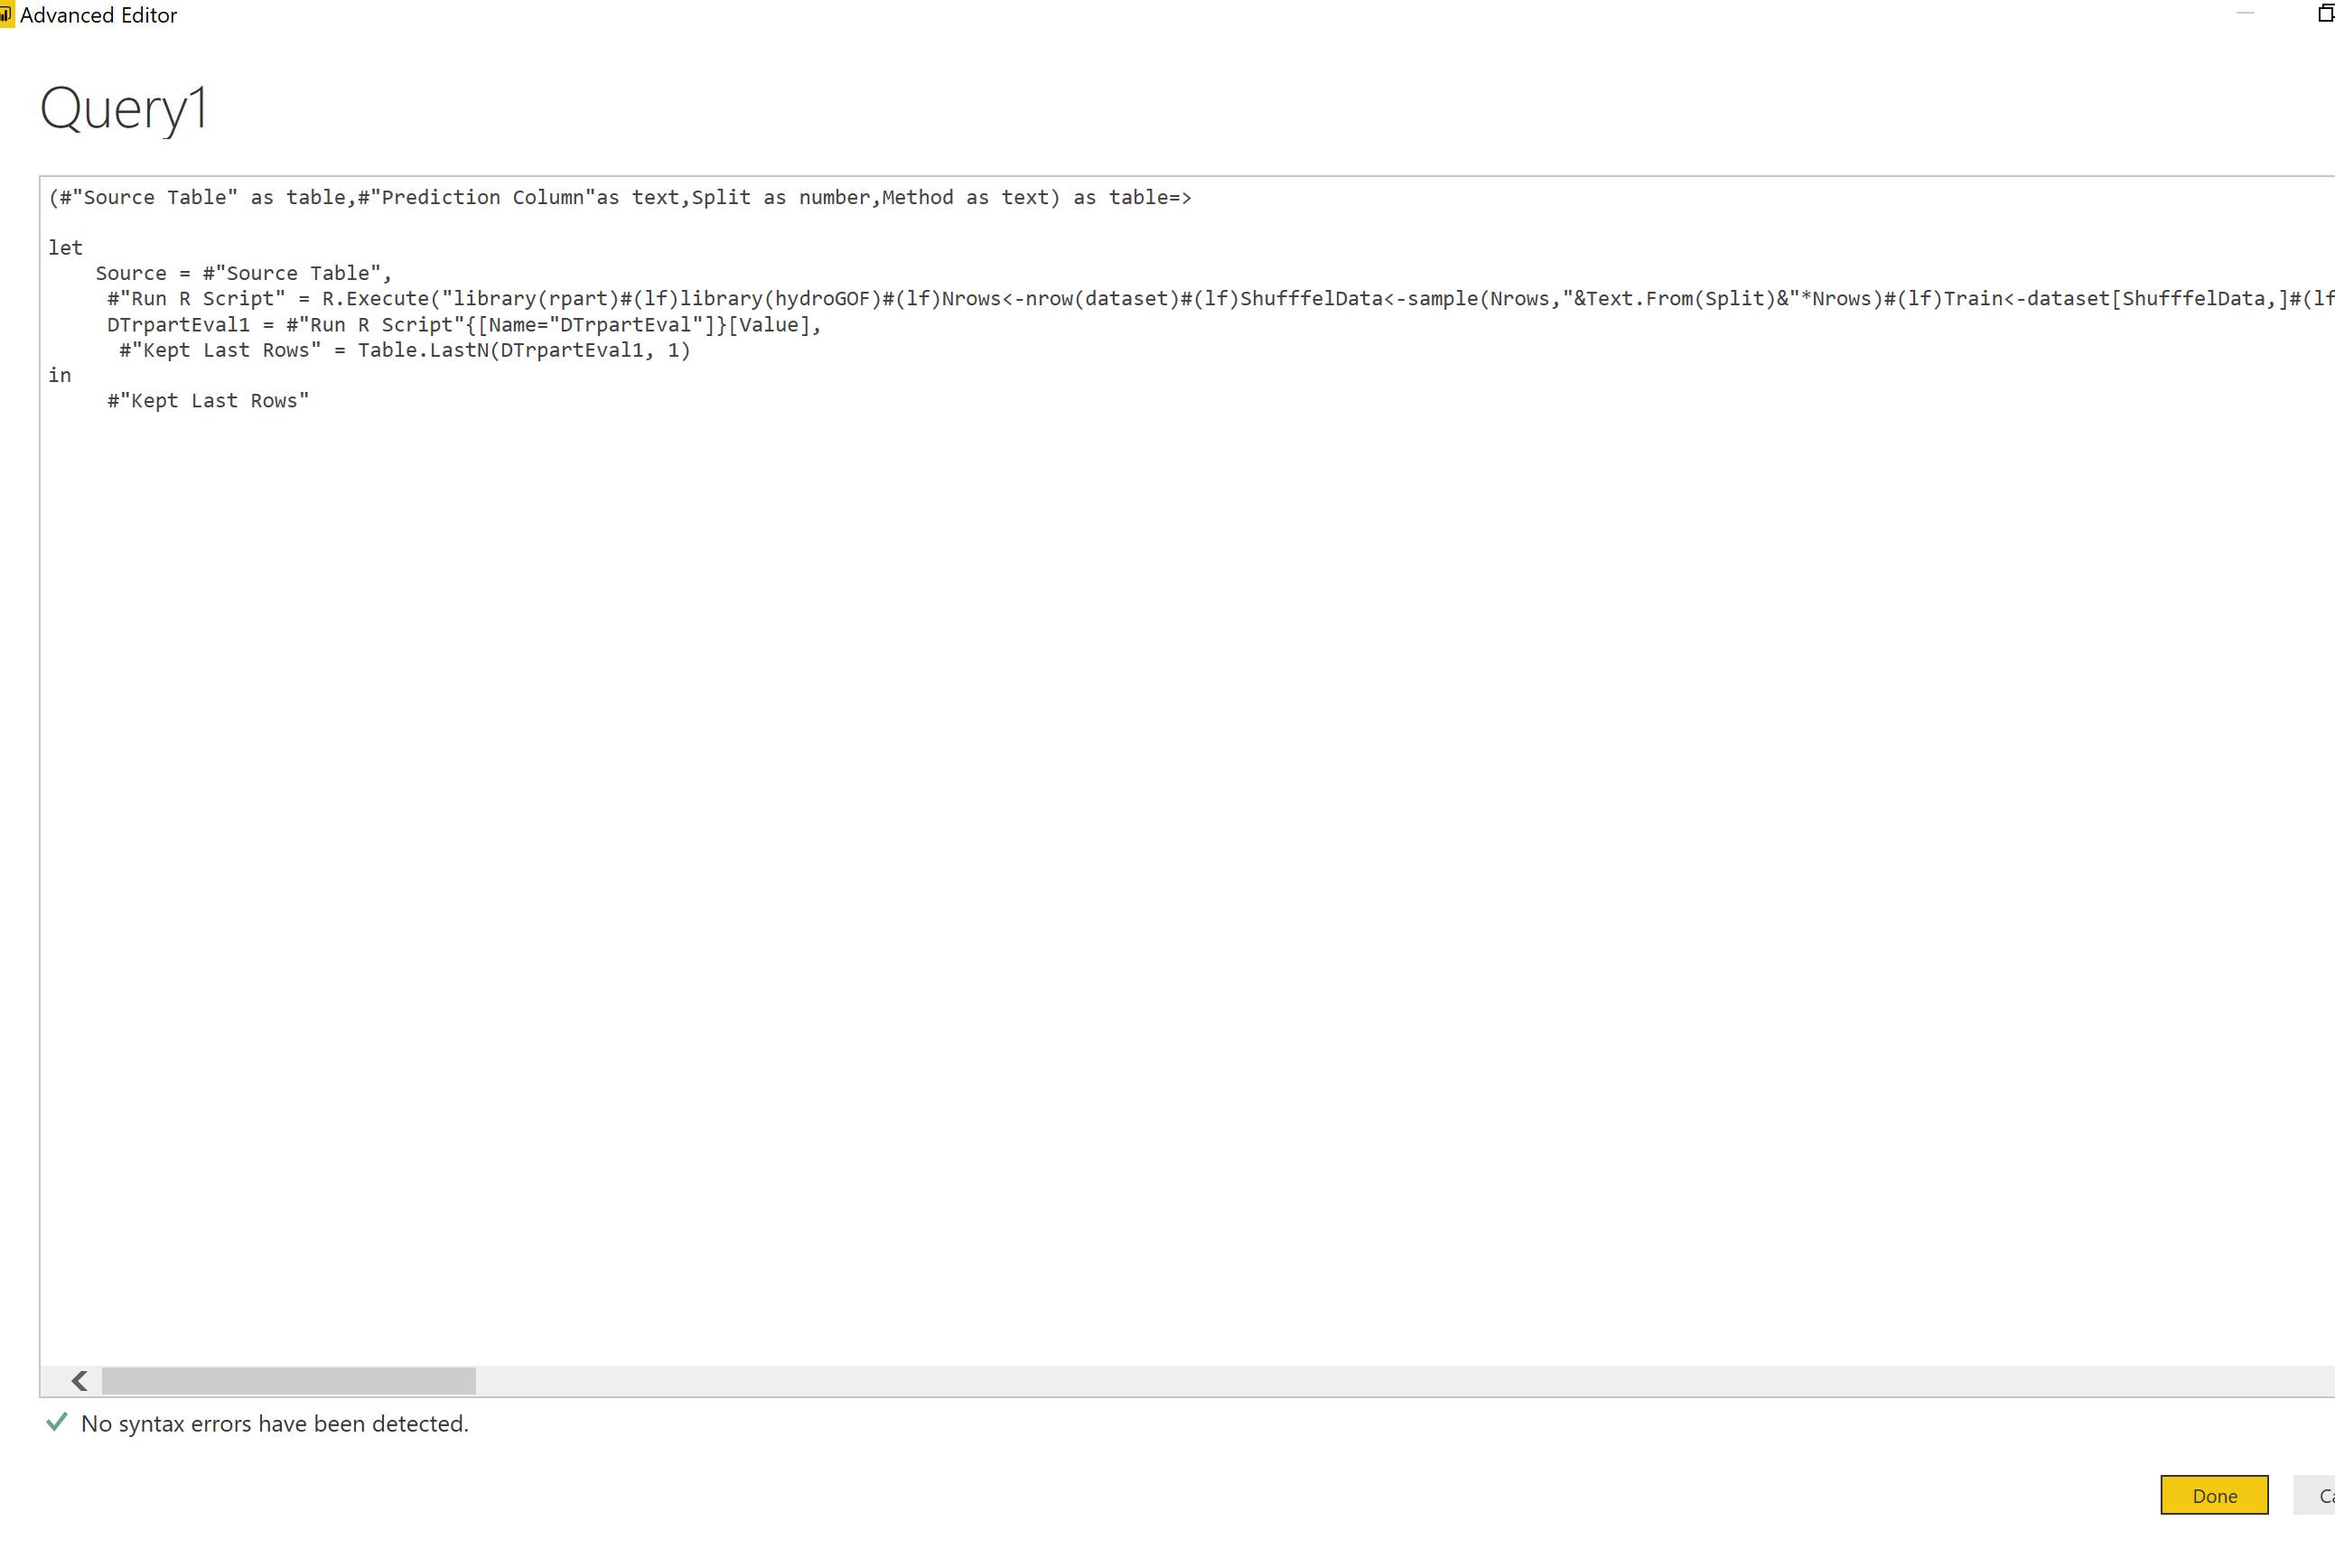
the M code for having a function with parameters in Power query to train and show the test result of rpart algorithm would be as below:
(#"Source Table" as table,#"Prediction Column"as text,Split as number,Method as text) as table=>

let
    Source = #"Source Table",
     #"Run R Script" = R.Execute("library(rpart)#(lf)library(hydroGOF)#(lf)Nrows<-nrow(dataset)#(lf)ShufffelData<-sample(Nrows,"&Text.From(Split)&"*Nrows)#(lf)Train<-dataset[ShufffelData,]#(lf)Test<-dataset[-ShufffelData,]#(lf)#(lf)DT <- rpart("&#"Prediction Column"&"~., data = Train, method = """&Method&""")#(lf)predictions <- predict(DT, Test)#(lf) Pred<-data.frame(Test$"&#"Prediction Column"&")#(lf) names(Pred)[1]<-paste(""actual"")#(lf)#(lf) i=1#(lf)for(i in 1:nrow(Test))#(lf){#(lf)if(predictions[i,1]>=predictions[i,2])#(lf)  {  Pred[i,2]<-""0""}#(lf)else #(lf) {  Pred[i,2]<-""1""#(lf)}#(lf) #(lf)}#(lf) #(lf) names(Pred)[2]<-paste(""prediction"")#(lf) #(lf) #(lf)cm <-as.matrix(table(Actual = Pred$actual, Predicted =Pred$prediction ))#(lf)sumtest<-sum(cm)#(lf)NrowTest<-nrow(cm)#(lf)diag <- diag(cm)#(lf)rowsums = apply(cm, 1, sum)#(lf)colsums = apply(cm, 2, sum) #(lf)p = rowsums / sumtest #(lf)q = colsums / sumtest #(lf)accuracy = sum(diag) / sumtest #(lf)precision = diag / colsums #(lf) recall = diag / rowsums #(lf)f1 = 2 * precision * recall / (precision + recall) #(lf)  #(lf)DTrpartEval<- data.frame(accuracy,precision, recall, f1)",[dataset=Source]),
     DTrpartEval1 = #"Run R Script"{[Name="DTrpartEval"]}[Value],
      #"Kept Last Rows" = Table.LastN(DTrpartEval1, 1)
in
     #"Kept Last Rows"
so in Power Query, I create a new blank query (see figure),
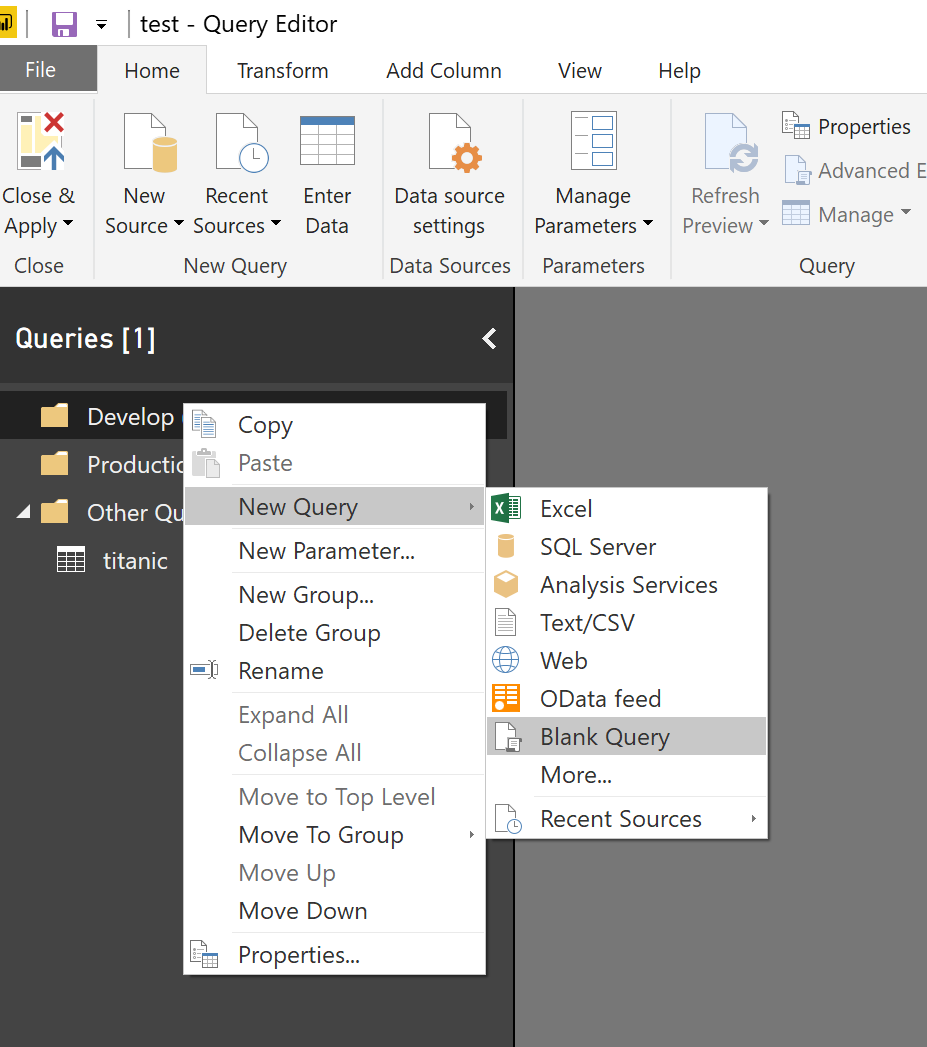
Then, in Home tab -> Query part, click on the “Advanced Editor”.
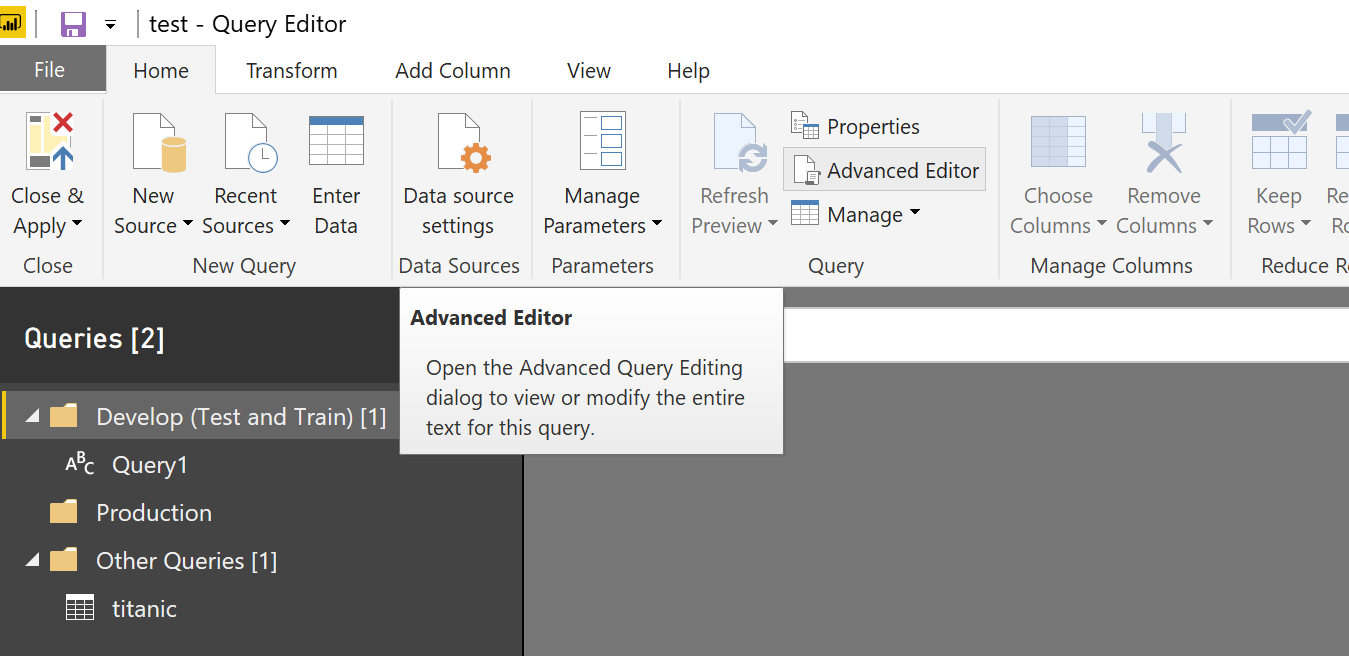
Then, Just copy and bast the M code that we wrote in above to create a function with parameters.
Finally, just change the name of the function.
I tried to train two different dataset (titanic and cancer data) and see the evaluation result
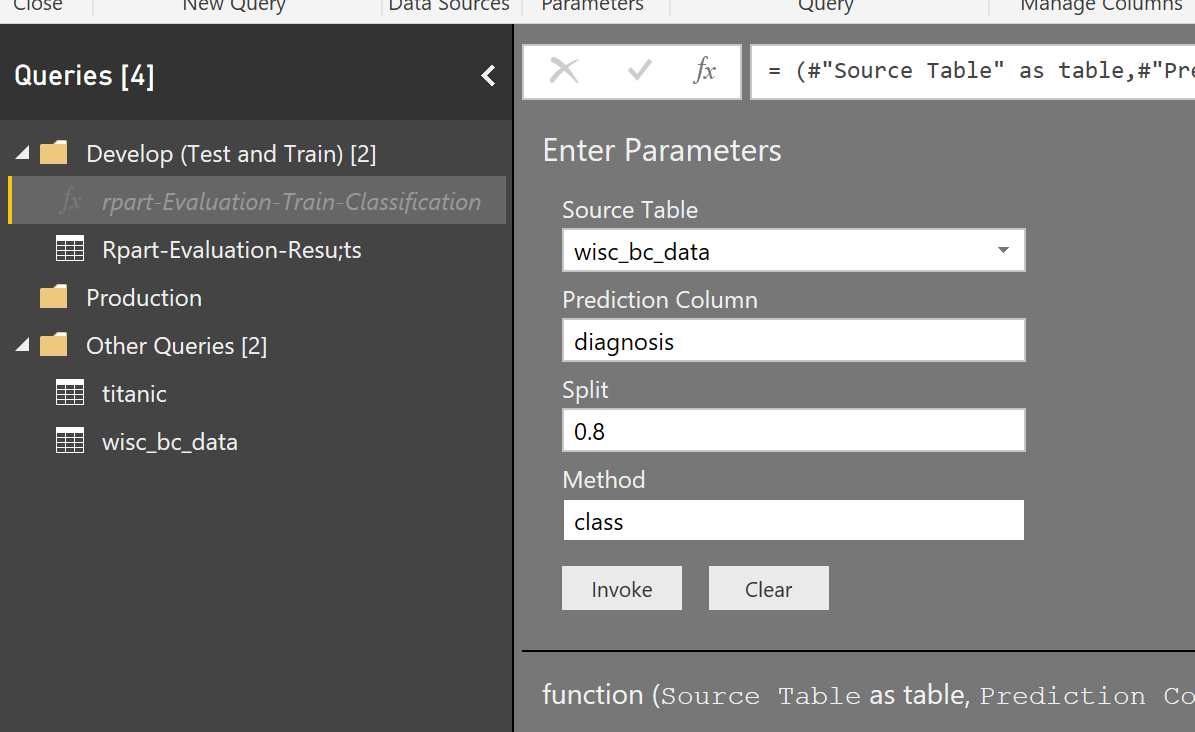

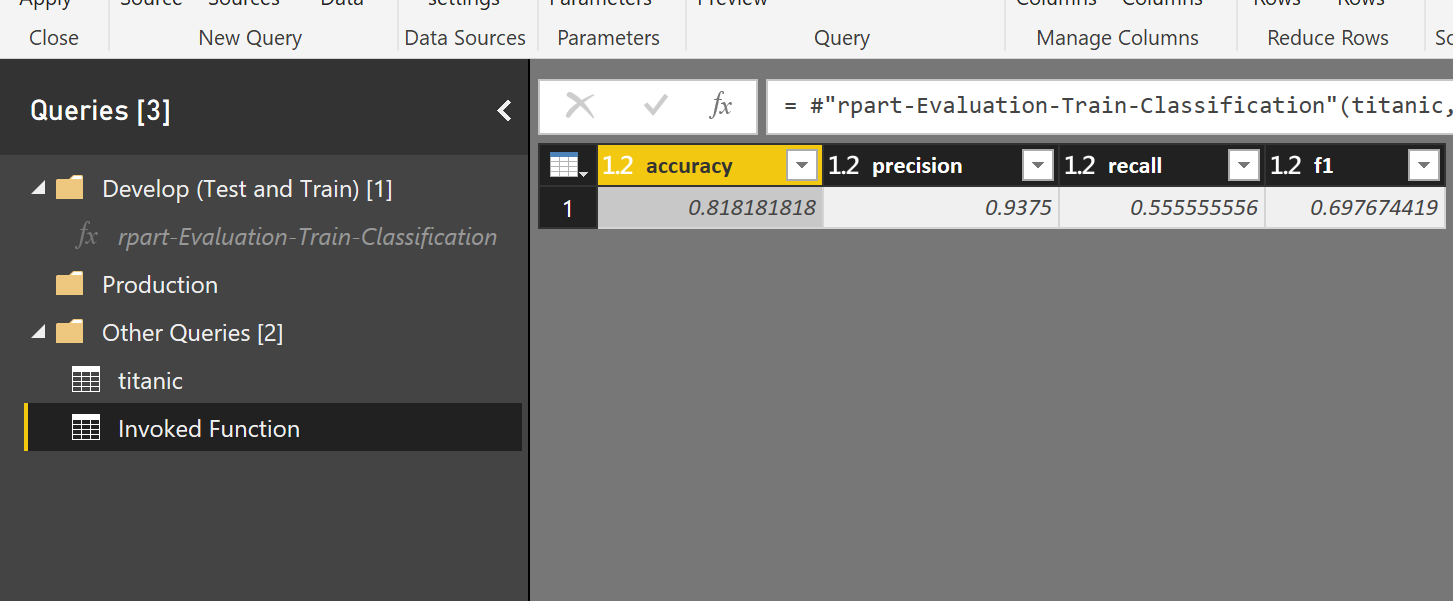

As you can see in above figures, I invoke the function for different data set with the aim of classification.
as you can see I have created, an environment for development training for classification problem.


