
Ever wanted to create a diagram of your MS SQL Database tables in Power BI? Here is what I did to make that happen.
The approach is to build a query that can be run against the catalog system views inside each MS SQL database. The approach is to build a list of “From” and “To” tables using the sys.foreign_keys table as a base. This works as long as foreign keys have been added to your database between tables. Not all databases will have these as reasons such as performance will mean foreign keys won’t exist. I will post an alternative query for generating links later in the blog.
To get started, click the Get Data button on the ribbon in your instance of Power BI Desktop and choose SQL Server as your data source. Enter the Server and Database in the appropriate fields.
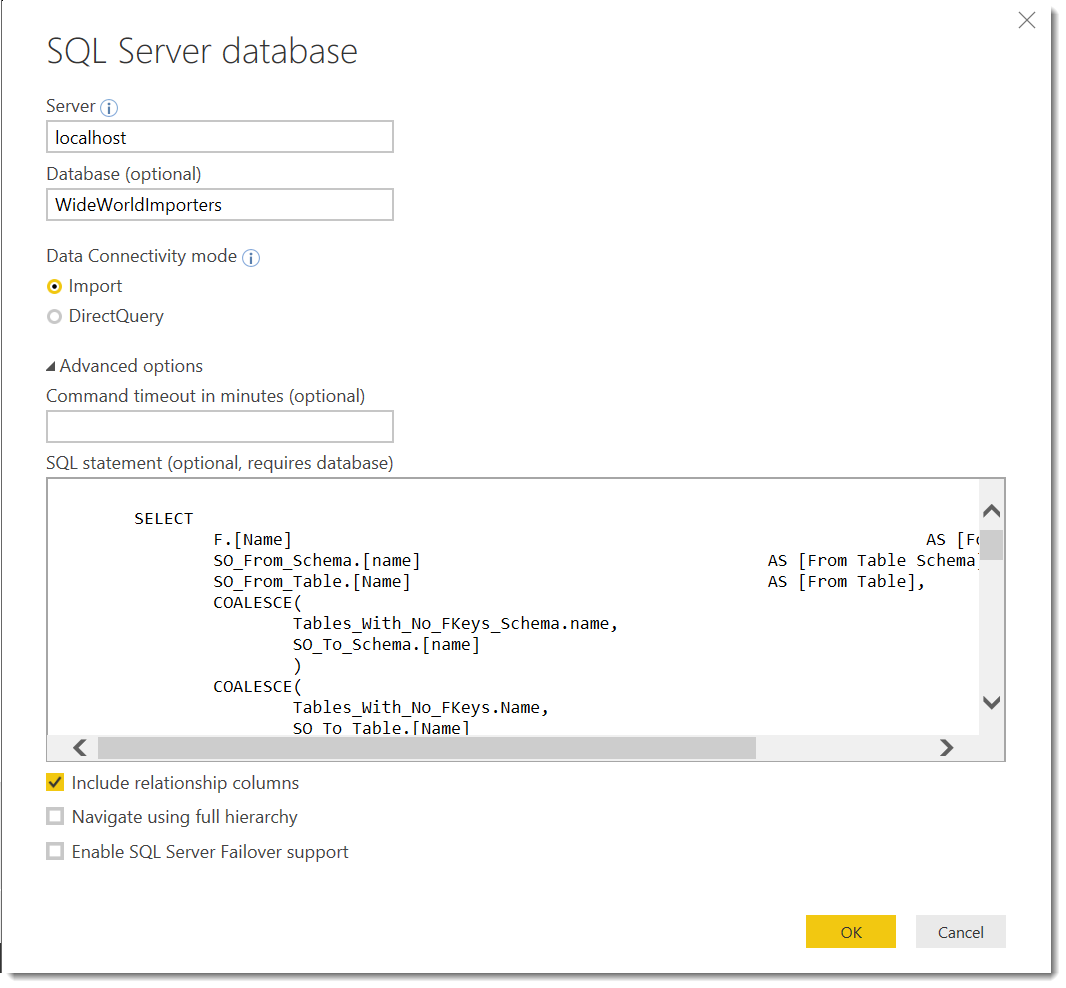
Expand the Advanced option in this dialog and enter the following SQL Query.
	SELECT
		F.[Name]						AS [Foreign Key Name],
		SO_From_Schema.[name]					AS [From Table Schema],
		SO_From_Table.[Name]					AS [From Table],
		COALESCE(
			Tables_With_No_FKeys_Schema.name,
			SO_To_Schema.[name]
			)						AS [To Table Schema],
		COALESCE(
			Tables_With_No_FKeys.Name,
			SO_To_Table.[Name]
			)						AS [To Table]

	FROM sys.foreign_keys as F

		INNER JOIN sys.foreign_key_columns as FC
			ON FC.constraint_object_id = F.object_id

		/***********************************************
			From Table Joins
		***********************************************/
		INNER JOIN sys.objects AS SO_From_Table
			ON SO_From_Table.object_id = FC.parent_object_id

		INNER JOIN sys.schemas AS SO_From_Schema
			ON SO_From_Schema.schema_id = SO_From_Table.schema_id

		/***********************************************
			To Table Joins
		***********************************************/

		INNER JOIN sys.objects AS SO_To_Table
			ON  SO_To_Table.object_id = FC.referenced_object_id

		INNER JOIN sys.schemas AS SO_To_Schema
			ON SO_To_Schema.schema_id = SO_To_Table.schema_id

		/***********************************************
			Add Tables with no relationship
		***********************************************/

		RIGHT JOIN sys.Tables AS Tables_With_No_FKeys
			ON Tables_With_No_FKeys.Name = SO_To_Table.Name
			AND SO_To_Table.schema_id = SO_To_Table.schema_id

		RIGHT JOIN sys.schemas AS Tables_With_No_FKeys_Schema
			ON Tables_With_No_FKeys_Schema.schema_id = Tables_With_No_FKeys.schema_id

WHERE
	COALESCE(
		Tables_With_No_FKeys_Schema.Name,
		SO_To_Table.[Name]
		) IS NOT NULL
Once appropriate authentication has been added, the query will return a dataset useful to visualise tables and how they are related. Tables that are returned in the [From Table] column represent child tables, while tables showing in the [To] column represent parents. When visualised, this data will show multi-generational relationships. Tables with no foreign keys will exist in this data-set with blank values in the [From Table] column.
It basically tries to suck out a list of To-From pairs of data that will be useful for some of the network visuals in Power BI.
The query works with SQL version 2012 and upwards (including SQL 2017).
The values in the schema columns may be useful in slicers if you would like the ability to show/hide groups of tables if you have a large and complex model.
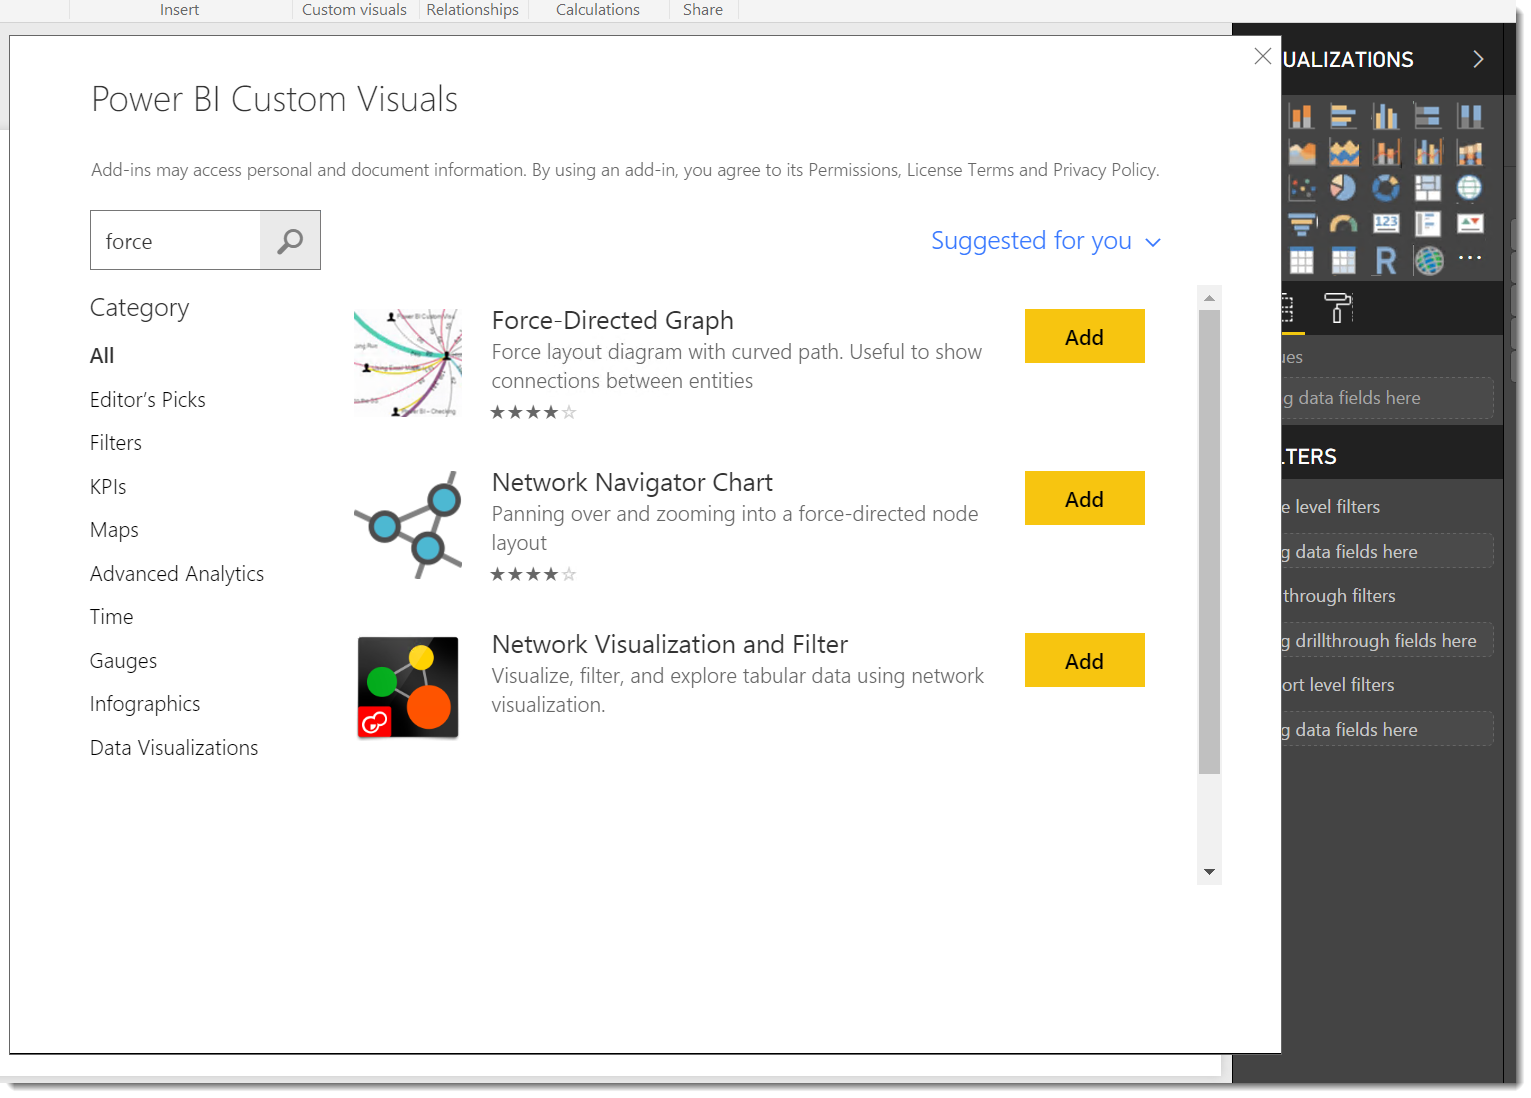
Now the data is in Power BI, visuals that support a “From/To” dataset can be used to visualise, filter and sort the data. Two I tried were the Force Directed custom visual.
This provides an animated view of how each table is related to other tables. I tried it out on the WideWorldImporters sample database from Microsoft, and this is how it can look.

It’s possible to play with colour settings in the format properties of this visual. You can also turn on direction arrows as well as some other handy refinements.
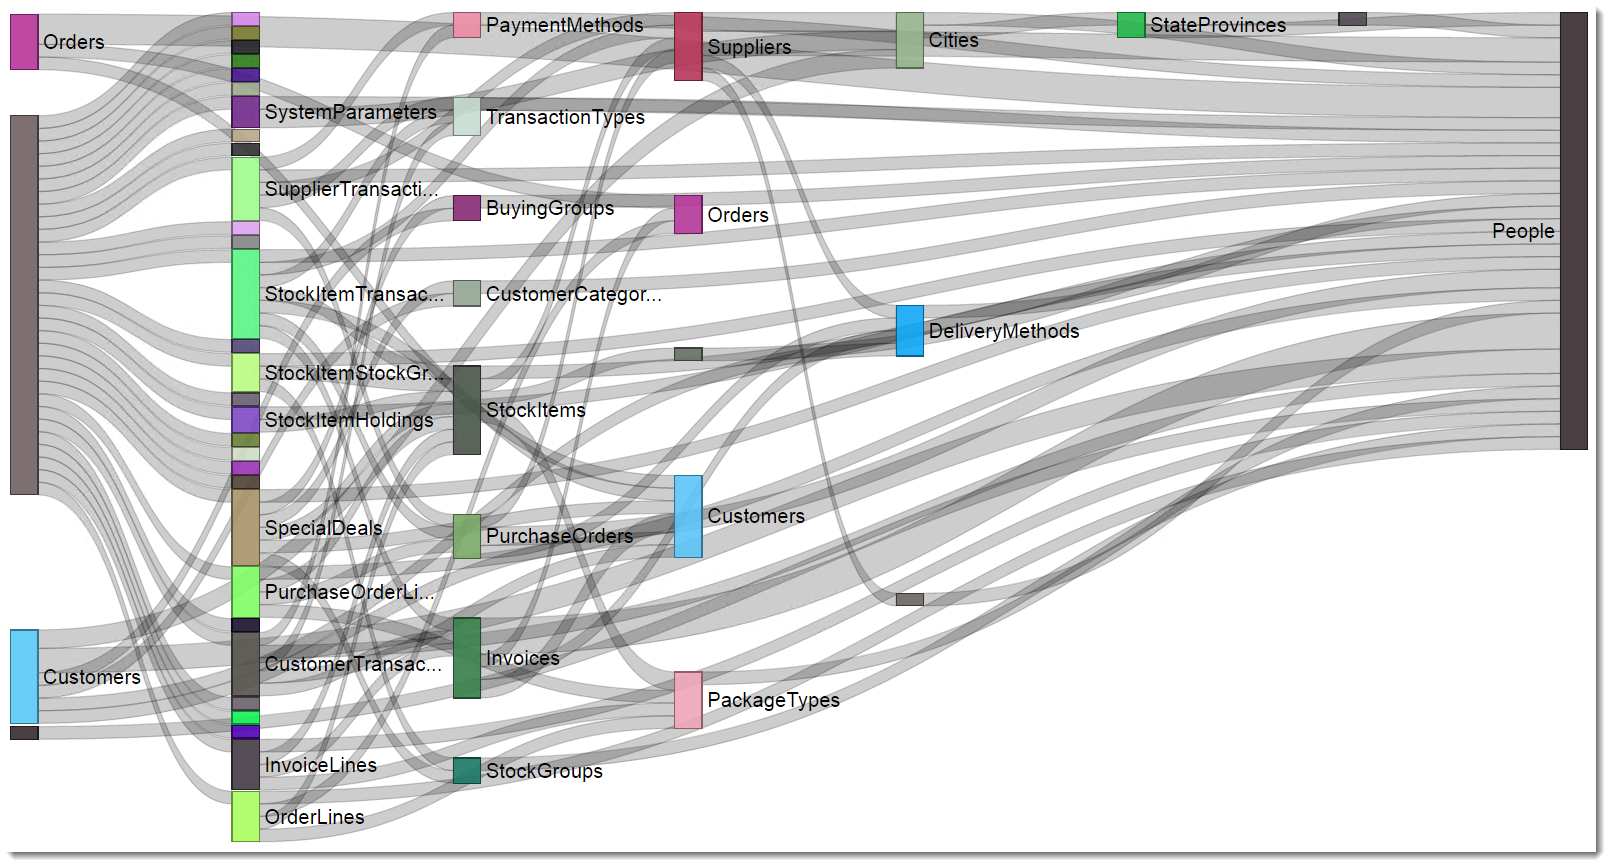
The other visual I tried was the Sankey diagram. I like the Sankey because it allows you to click and drag objects around to create a nicer arrangement. It’s not your traditional ERD box and crows-feet diagram, but it still allows you to see which tables are related to others.
The network navigator was another good visual, and if you have an R instance installed on your local machine, you can play with some of the custom R visuals.
The catalog views could be used in a similar way to generate power bi visuals showing other object dependencies inside an MS SQL Database. Additional columns could be added to the base query to be used in tool-tips etc.
If your database tables do not have foreign keys, here is another query that can be used to help guess relationships between tables based on column name and datatype.
SELECT
	ChildTable.Name ,
	OtherTable.Name
FROM sys.tables AS ChildTable

	INNER JOIN sys.columns AS ChildTable_Columns
		ON ChildTable_Columns.object_id = ChildTable.object_id

	INNER JOIN sys.columns AS OtherTable_Columns
		ON  OtherTable_Columns.Name = ChildTable_Columns.Name
		AND OtherTable_Columns.object_id != ChildTable_Columns.object_id
		AND OtherTable_Columns.system_type_id = ChildTable_Columns.system_type_id

	INNER JOIN sys.tables AS OtherTable
		ON OtherTable.object_id = OtherTable_Columns.object_id
There will be issues with this approach, but maybe not too many to resolve to help you
Finally, an unrelated tip as a gift for those that read to the end of blogs. Did you know you can start a non-Store instance of Power BI Desktop on a specific port by using the /diagnosticsport switch? The example below will start an instance of Power BI Desktop, listening on port 5555. This will allow you to connect with any Analysis Services client tool (SSMS, Profiler, Excel, Power Shell etc.) and run data, or DMV queries.
C:\Program Files\Microsoft Power BI Desktop\bin>pbidesktop /diagnosticsport:5555
![]()
This won’t work well with a Store version of Power BI Desktop. The port number must be available and seems to only work with 4 digits. Please only use for good and respect the EULA agreements of Power BI Desktop. 🙂


Hi Philipp. Thank you for this very interesting article. I have one question regarding the /diagnosticsport. I don’t understand which use cases are allowed with this option? Can you give me some examples?
Kindest regards
William
Have you tried the hierarchy chart visual? It might be another neat one to try, you have the option of colour coding again and adding a field beneath what would be table names that could be something like the number of rows.
I have used the hierarchy chart to plot the execution of ssis packages, code red, amber and green for execution status. It’s not too bad.
Hi Philip,
this is brilliant .
Is there a way to do it with SSAS ?
Regards
Reinhardt