
I’m excited to share the news with you that we have added a new feature in Power BI Helper; Expression Tree. Expression Tree will expand the tree of expression for a Measure or calculated column, you can see what other measures are used to create this expression, and where other measures, calculated columns, or even normal columns are located (in which table). This feature is in addition to previous two features of this tool which were; Showing tables and fields used in visualization pages of a Power BI Report, and ability to search for a column or table that used in visualization pages of a report. In this post, I’ll explain how this new feature works.
Defining the Problem
You have a Power BI with many measures that are referenced each other, it is not easy to find out which measure is used to create which calculation. If you want to go through the list of all measures, columns, and calculated columns used in a measure it may take hours to find it. Here is an example of a measure’s code;
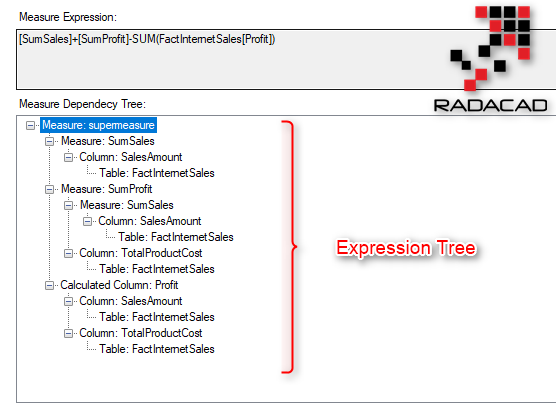
supermeasure = [SumSales]+[SumProfit]-SUM(FactInternetSales[Profit])
This measure is sourced from two other measures and also a column in a table. Finding the column was easy, however, finding the description of other measures are not, you need to go to Power BI Desktop, select the other measures one by one and see the expression for those, and it is very likely that those measures also have used other measures inside their expressions;
SumProfit = [SumSales] - SUM(FactInternetSales[TotalProductCost])
In real-world scenarios of using Power BI and DAX, you end up with a big list of measures and expressions. Finding the expression tree is always a challenge!
Download Power BI Helper
Let’s now have a look at this functionality in Power BI Helper.
Connect to the Power BI Model and Get List of Tables, Columns, and Measures
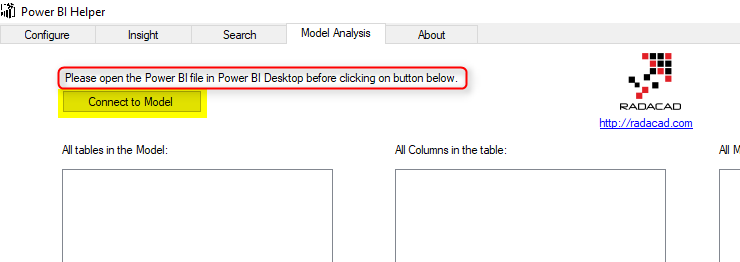
For this version of Power BI Helper, you need to have Power BI Desktop file opened on your machine, when it is opened, you can connect to that model;
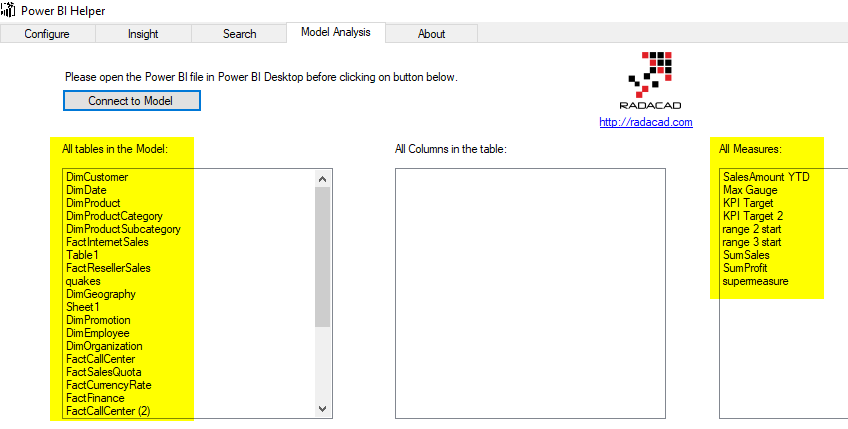
After connecting to the model, you will see list of all tables in the model and all measures;
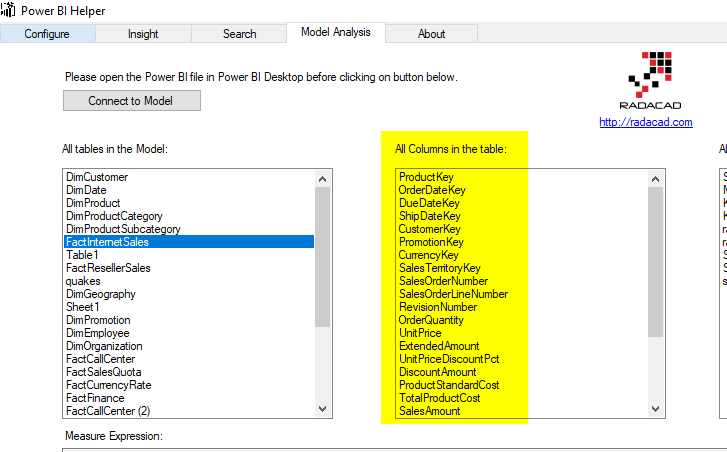
With selecting every table, you can see list of all columns under that table too;
View the Measure’s Expression Tree and Expression Line
If you click on any measure in the list of measures, the expression of that will be showed in the Measure Expression section, and the Measure Dependency Tree will be showed in a tree-style visualization;
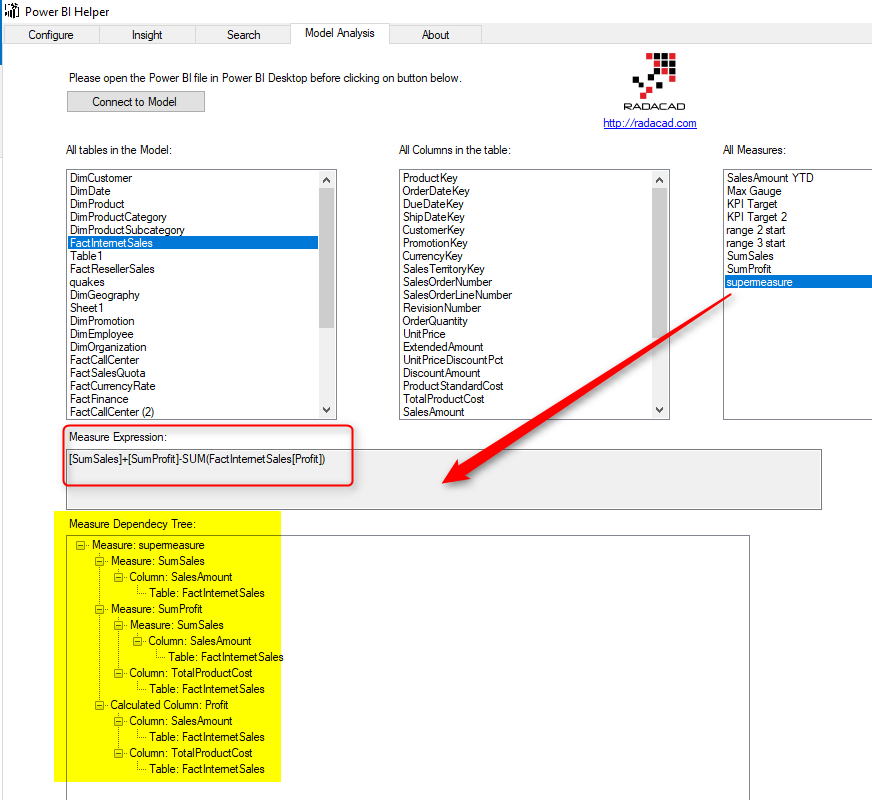
Now with this expression tree, you can easily learn what are measures, calculated columns, or columns from tables are participated in creating this measure;
Other Features of Power BI Helper
If you want to learn about other features of Power BI Helper, read posts below;
Power BI Cleanup Tool; Time Saving with Power BI Helper
Searching a Field or Table in Power BI Visualization: Power BI Helper
Summary
This is the version 0.3 of Power BI Helper, and still, long list of upcoming features exists. The feature of the expression tree is still under test, it will help developers to find the tree of expression dependency easier. It will help new developers in your Power BI project to get along with your model and report faster, rather than spending lots of time and money to get familiar with it. Let us know if you have any suggestions for upcoming features.
We need your help
If you like to help us, please test this with your Power BI files and let us know the result, this tool is under test, and any help from you is the most welcome 🙂


Reza is author of more than 14 books on Microsoft Business Intelligence, most of these books are published under Power BI category. Among these are books such as Power BI DAX Simplified, Pro Power BI Architecture, Power BI from Rookie to Rock Star, Power Query books series, Row-Level Security in Power BI and etc.
He is an International Speaker in Microsoft Ignite, Microsoft Business Applications Summit, Data Insight Summit, PASS Summit, SQL Saturday and SQL user groups. And He is a Microsoft Certified Trainer.
Reza’s passion is to help you find the best data solution, he is Data enthusiast.
His articles on different aspects of technologies, especially on MS BI, can be found on his blog: https://radacad.com/blog.
Hi Reza,
Thanks for the blog. I downloaded it but it installs the first version and not the latest version. Can you please update the download links. Thanks.
Abhijith
Hi Abhijith,
The link in the page now is v 0.3 which is latest at this stage.
Cheers
Reza
Hello!
Familiar with this scenario, but what really matters is not the list of dependant columns itself but the logic inside subsequent calculations. If I could see somehow formulas in one place it would be more useful.
Hi Ramon,
Thanks for your feedback. how would you like to see it? instead of each measure you would like to see inline expression of that inside the main expression?
wouldn’t it make it so hard to read?
Cheers
Reza
This is SO useful! Many a day I go crazy trying to figure out the relationship tree. It’s really bad when each measure has complex DAX and multiple layers. Invariably, I’ll get halfway through tracing through it and lose my place and have to start all over.
Thank you!
Thanks Jesse for your kind words 🙂
Glad you liked it, the new version of this product is on its way
Cheers
Reza