
Further to my recent series of Power BI based games, I thought for this article I would build a version of the popular children’s game, Hangman. To win the game, you need to guess a hidden word letter by letter, with the user having a number of “chances” with each wrong guess bringing you closer to losing the game. In hangman, wrong guesses are often tracked by drawing a set of gallows. I thought for this version, I would use a slowly disappearing Power BI logo to help track progress.
To add an educational element to the game, I decided to use the 131 DAX functions as the library of words to be guessed. When building and testing the game, I found myself heading off on some interesting tangents to learn more about some DAX functions I don’t use too often. While this slowed me down a little, I really didn’t mind.
As usual, the awesome guys over at PowerBI.Tips provided the images used for the game board. This adds a huge degree of professionalism to the report and once again shows that if you make good use of background images, your report can have considerably more impact.
The URL to download the PBIX and data files is here: Mission Impossible
The “Publish to web” version can be accessed here: Publish to Web
The game starts by presenting the user with the following screen. The screen provides some simple instructions on what the mission is.
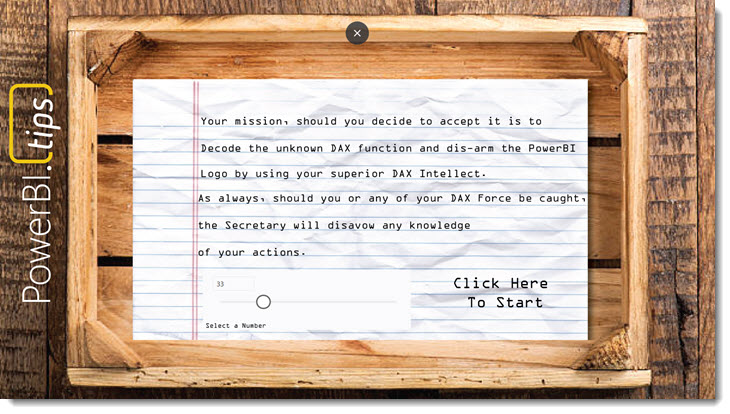
There are two interactive elements for the user on this screen. A slicer that allows different DAX functions to be selected, and a [Click Here To Start] button that fires a bookmark action that loads the second page to begin the game.
Here is an image showing the main game board in action.
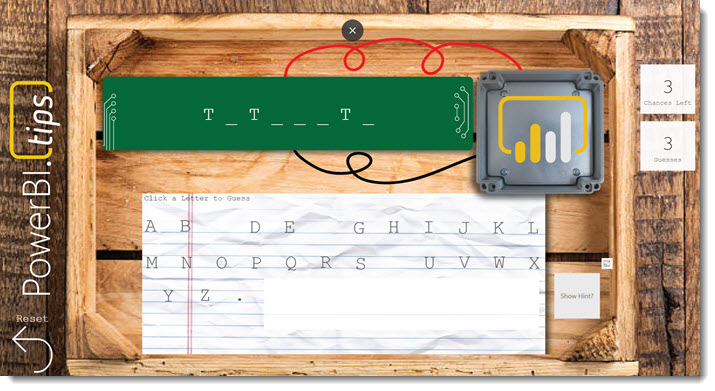
There are a number of elements to the game board. I have added numbered red circles these in the image below to identify the core sections. Each numbered section will be explained in detail.

Section (1)
Shows the word being guessed. Initially, this should be a series of underline characters that represent each letter of the word. If the word to be guessed has 7 letters, there should be 7 underline characters. As letters are guessed correctly, the blanks will convert to the appropriate letter.
The DAX Function for this is as follows:
Progress =
VAR Word = MINX(FILTER('Puzzle (ALL)','Puzzle (ALL)'[Index]=[Game Selector Value]),[FUNCTION])
  // Build a string of Guesses
VAR Guesses =
    IF(SELECTEDVALUE('T-A'[Value])=1,"A") &
    IF(SELECTEDVALUE('T-B'[Value])=1,"B") &
    IF(SELECTEDVALUE('T-C'[Value])=1,"C") &
    IF(SELECTEDVALUE('T-D'[Value])=1,"D") &
    IF(SELECTEDVALUE('T-E'[Value])=1,"E") &
    IF(SELECTEDVALUE('T-F'[Value])=1,"F") &
    IF(SELECTEDVALUE('T-G'[Value])=1,"G") &
    IF(SELECTEDVALUE('T-H'[Value])=1,"H") &
    IF(SELECTEDVALUE('T-I'[Value])=1,"I") &
    IF(SELECTEDVALUE('T-J'[Value])=1,"J") &
    IF(SELECTEDVALUE('T-K'[Value])=1,"K") &
    IF(SELECTEDVALUE('T-L'[Value])=1,"L") &
    IF(SELECTEDVALUE('T-M'[Value])=1,"M") &
    IF(SELECTEDVALUE('T-N'[Value])=1,"N") &
    IF(SELECTEDVALUE('T-O'[Value])=1,"O") &
    IF(SELECTEDVALUE('T-P'[Value])=1,"P") &
    IF(SELECTEDVALUE('T-Q'[Value])=1,"Q") &
    IF(SELECTEDVALUE('T-R'[Value])=1,"R") &
    IF(SELECTEDVALUE('T-S'[Value])=1,"S") &
    IF(SELECTEDVALUE('T-T'[Value])=1,"T") &
    IF(SELECTEDVALUE('T-U'[Value])=1,"U") &
    IF(SELECTEDVALUE('T-V'[Value])=1,"V") &
    IF(SELECTEDVALUE('T-W'[Value])=1,"W") &
    IF(SELECTEDVALUE('T-X'[Value])=1,"X") &
    IF(SELECTEDVALUE('T-Y'[Value])=1,"Y") &
    IF(SELECTEDVALUE('T-Z'[Value])=1,"Z") &
    IF(SELECTEDVALUE('T-.'[Value])=1,".")

VAR PivotLetters =
    ADDCOLUMNS(
        GENERATESERIES(1,LEN(Word)),
        "Letter" ,
        VAR vLetter = MID(Word,[Value],1)
        VAR P = SEARCH(vLetter,Guesses,1,0)
        RETURN IF(P>0,vLetter,"_")
    )

RETURN
    CONCATENATEX(PivotLetters,[Letter]," ",[Value])
It’s quite a long function that manually checks the status of a series of slicers to decide if a letter has been guessed or not. These slicers are managed by the buttons in section (2). The approach is to first build a horizontal string which is then pivoted vertically to a table that has one row per letter. Tests then determine if guessed letters exist in the actual word before the results are pivoted back horizontally as a series of letters or underlines. This is quite an interesting approach and makes clever use of the GENERATESERIES function to help pivot the word vertically. This calculation can be converted to a calculated table with the PivotTable variable used in the final RETURN if you are keen to debug the logic.
Section (2)
A series of buttons that represent every letter of the alphabet (including a dot as some functions have a dot). Each button/letter has a disconnected slicer that stores the state of the button. When you click on a button the corresponding bookmark sets the related slicer to be selected and importantly, hides the button.
There are 27 disconnected slicers that all start in an unselected state. As guesses are made, the bookmarks set the relevant slicer to selected and it’s these slicers that are used in section (1), (4) and (5) to determine how the game is progressing.
Section (3)
Is a slicer in horizontal mode (so looks like a button) which enables several measures to display some text. The measures are:
Hint =
VAR myHint = MINX(FILTER('Puzzle (ALL)','Puzzle (ALL)'[Index]=[Game Selector Value]),[DESCRIPTION])
RETURN
    IF(
         ISFILTERED('Hint?'[Value]),
        myHint,
        "")
and
Measure URL =
VAR myHint = MINX(FILTER('Puzzle (ALL)','Puzzle (ALL)'[Index]=[Game Selector Value]),[FUNCTION])
VAR myHint2 = SUBSTITUTE(myHint,".","-")
RETURN
    IF(
         ISFILTERED('Hint?'[Value]),
        "https://msdn.microsoft.com/en-us/query-bi/dax/" & myHint2 & "-function-dax",
        "")
Both these measures provide useful hints and will only display text if the [Show Hint] option is selected. The data category for [Measure URL] is set to Web URL, which enables users to navigate to the MSDN documentation for the function for further reading 🙂
Section (4)
This area shows a Power BI logo that loses pieces everytime a wrong guess is made. The idea is when the Power BI logo fully disappears after 5 wrong guesses, you lose the game. This is the section where a gallows would normally be used. There are 5 versions of the logo, each based on SVG code and uses the recently added feature of allowing a calculated measure (and column) to be set as Image URL.
This section also has a [result] measure that displays some text if you win or lose.
Result =
VAR p = SUBSTITUTE([Progress]," ","")
VAR Word = MINX(FILTER('Puzzle (ALL)','Puzzle (ALL)'[Index]=[Game Selector Value]),[FUNCTION])
RETURN
    SWITCH(
        TRUE() ,
        [Chances Left] < 1 , "You Lose!!" ,
        p = Word , "You Win!!" ,
        ""
    )
Section (5)
Finally, in section (5) there are a could of measures that monitor the slicers controlled by the letter buttons to keep track of progress.
Chances Left =
VAR Chances = 5
VAR Word =
    SUBSTITUTE(SUBSTITUTE([Progress]," ",""),"_","")

VAR PivotLetters =
SELECTCOLUMNS(
    ADDCOLUMNS(
        GENERATESERIES(1,LEN(Word)),
        "Letter" ,
        MID(Word,[Value],1)
    ),"Letter",[Letter])

VAR GuessesMade = [Guesses Made]
VAR Misses = GuessesMade - COUNTROWS(DISTINCT(PivotLetters))
RETURN Chances - Misses
The [Chances Left] measure keeps track of how many wrong guesses have been made. Starting at 5, if you get down to 0, you have lost the game.
[Guesses Made] counts the number of letters that have been pushed. This simply sums the number of slicers set to 1.
Guesses Made =
VAR Guesses =
    IF(SELECTEDVALUE('T-A'[Value])=1,1) +
    IF(SELECTEDVALUE('T-B'[Value])=1,1) +
    IF(SELECTEDVALUE('T-C'[Value])=1,1) +
    IF(SELECTEDVALUE('T-D'[Value])=1,1) +
    IF(SELECTEDVALUE('T-E'[Value])=1,1) +
    IF(SELECTEDVALUE('T-F'[Value])=1,1) +
    IF(SELECTEDVALUE('T-G'[Value])=1,1) +
    IF(SELECTEDVALUE('T-H'[Value])=1,1) +
    IF(SELECTEDVALUE('T-I'[Value])=1,1) +
    IF(SELECTEDVALUE('T-J'[Value])=1,1) +
    IF(SELECTEDVALUE('T-K'[Value])=1,1) +
    IF(SELECTEDVALUE('T-L'[Value])=1,1) +
    IF(SELECTEDVALUE('T-M'[Value])=1,1) +
    IF(SELECTEDVALUE('T-N'[Value])=1,1) +
    IF(SELECTEDVALUE('T-O'[Value])=1,1) +
    IF(SELECTEDVALUE('T-P'[Value])=1,1) +
    IF(SELECTEDVALUE('T-Q'[Value])=1,1) +
    IF(SELECTEDVALUE('T-R'[Value])=1,1) +
    IF(SELECTEDVALUE('T-S'[Value])=1,1) +
    IF(SELECTEDVALUE('T-T'[Value])=1,1) +
    IF(SELECTEDVALUE('T-U'[Value])=1,1) +
    IF(SELECTEDVALUE('T-V'[Value])=1,1) +
    IF(SELECTEDVALUE('T-W'[Value])=1,1) +
    IF(SELECTEDVALUE('T-X'[Value])=1,1) +
    IF(SELECTEDVALUE('T-Y'[Value])=1,1) +
    IF(SELECTEDVALUE('T-Z'[Value])=1,1) +
    IF(SELECTEDVALUE('T-.'[Value])=1,1)
RETURN
    Guesses
In terms of game logic, the game is reasonably straightforward. Most of the time was spent creating the tables needed for each slicer, and messing around with all the bookmarks. Pretty much every bookmark is set to control only some, but not all visuals on the canvas. There are lots of disconnected tables and the game shows how these can be used to help track the state in a way that can be used by other measures.
Once again, a big thanks to the guys at PowerBI.Tips for creating the graphics and I hope you enjoy playing and pulling apart the game logic.
If you download the file, be sure to also grab the DAX Functions.txt file and place in a c:\DAX folder on your machine, or update the data source in the query editor.


2 thoughts on “Fun with DAX – Mission Impossible”