
As I have discussed before, R is not only for doing Machine Learning (despite it is a really good tools for it), it also can be used for helping managers to so decision support. In the last two posts (Post 1 and 2), I have explained the main concepts behind the optimization problems. Also, how to write and solve these problems using simple R codes inside R studio. In this post, I am going to show how to solve an optimization problem inside Power BI using R scripts and visualization. Imagine that I have below information about production line of Product 1 and Product 2 (see post 2). 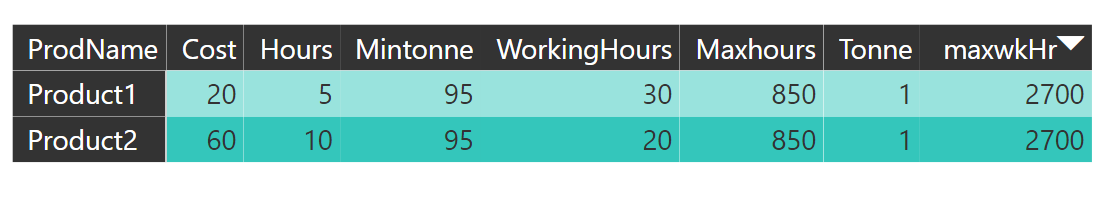 As I have explained before, imagine we produce Product 1 and 2. The cost of producing product 1 is 20 and product 2 is 60 (cost column in above table), Also we have to spend 5 hour and 10 hours to produce product 1 and 2 (second column) and so forth (I have explain how to solve the problem in Post number 2), I have shown the related R codes for doing the optimization. as below:
library("lpSolve")
d<-dataset
obj.fun<-d$Cost
constr<-matrix(c(d$WorkingHours,d$Hours,d$Tonne),ncol=2,byrow = TRUE)
rhs<-c(d$maxwkHr[1],d$Maxhours[1],d$Mintonne[1])
const.dir<-c("<=","<=",">=")
prod.sol<-lp("max",obj.fun,constr,const.dir, rhs,compute.sens = TRUE)
prod.sol$objval
prod.sol$solution
I also created an R visual in Power BI, as you can see in the below picture, I have selected the the data from dataset field. and put the R codes inside it 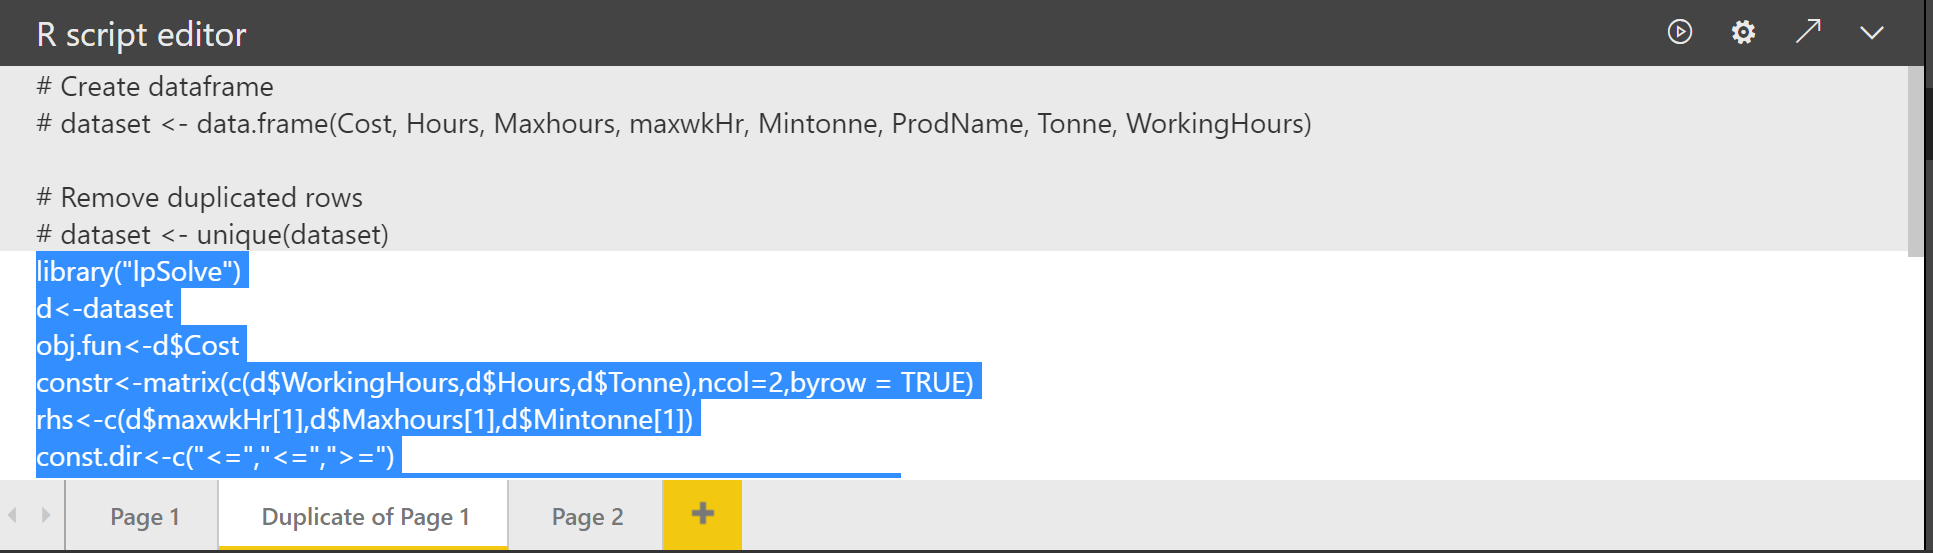 However, if I run the code, it does not show anything! in R visual in Power BI, we have to an image output from our codes otherwise we got the below error :as ” there is no visual showing up”
  Now to show the result, I want to create a table to show the result of optimization. So, I use a package like “gridExtra” and “grid”. this package helps us to show the result in as a visual. The result of the algorithm has been put in “Prod.sol” variable. the number cost of the producing product 1 and 2 has been stored in prod.sol$objective, also prod.sol$solution stores information about the amount of product that we should produce for product 1 and 2.
library(gridExtra)
library(grid)
result<-data.frame(prod.sol$objective,prod.sol$solution)
profit<-data.frame(result$prod.sol.objective*result$prod.sol.solution)
result<-data.frame(prod.sol$objective,prod.sol$solution,profit)
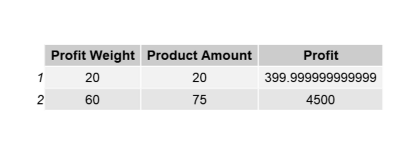
colnames(result) <-c("Profit Weight","Product Amounth","Profit")
grid.table(result)
moreover, the profit has been stored in: result$prod.sol.objective*result$prod.sol.solution
all of these attributes have been loaded into a variable named “result”. I used the grid.table function to draw the result of optimization as below : 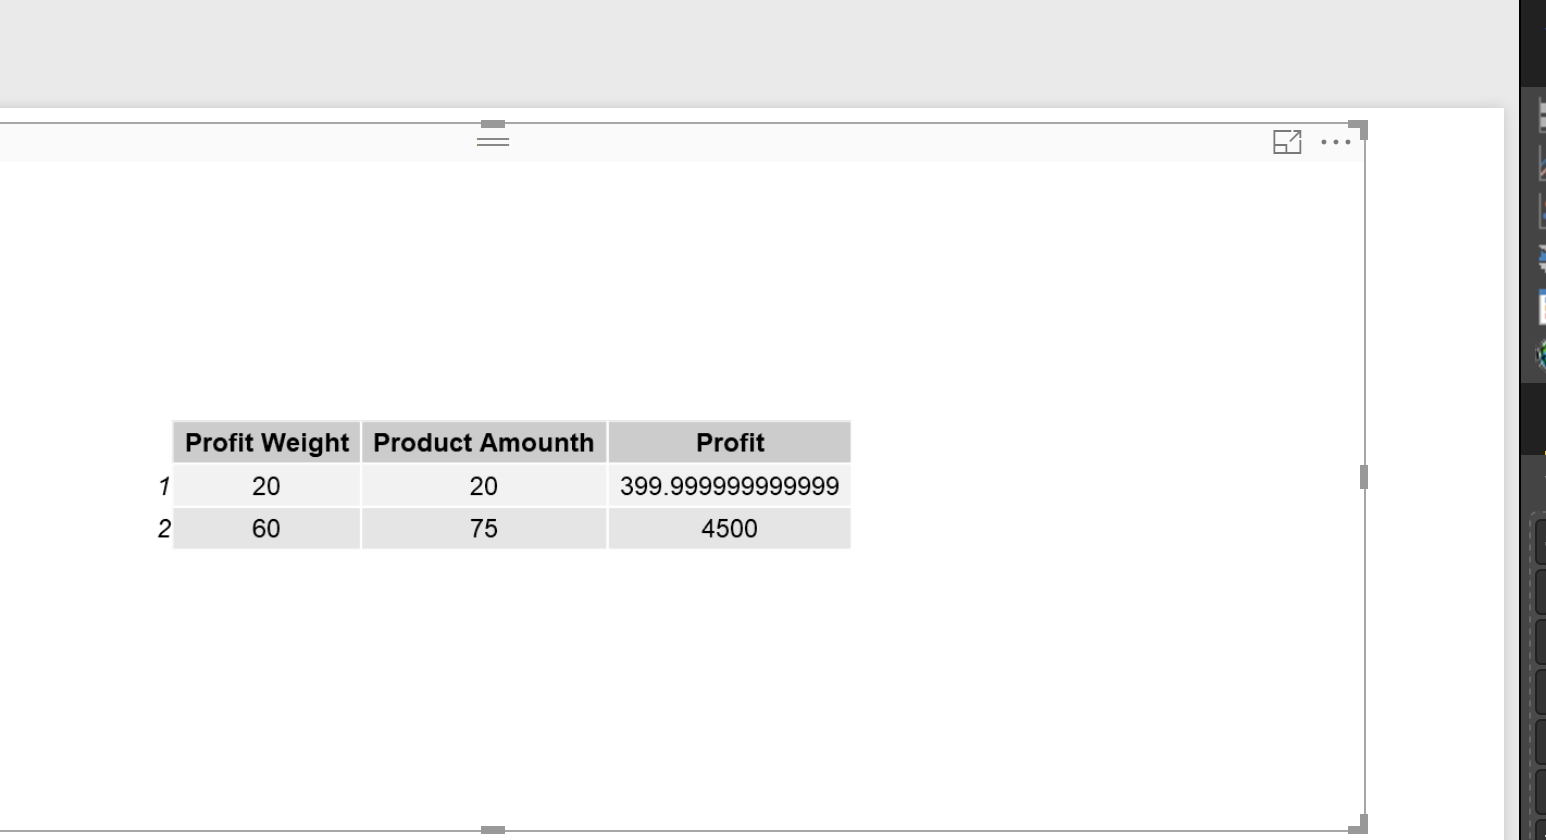 As we can see in the above picture, we have to produce 20 tonne of product 1 to achieve 400 dollar profit, and also we have to produce 75 tonne of product 2 to achieve 4500 dollar profit.
In total, we will recived profit 4900 dollar.
This is a very simple example of how to optimization inside Power BI. We also able to do if then analysis to check if we have more of product 2 and less of product 1 how much profit we will get.


