
Following the previous PIVOT Transformation
Tutorial which was in 2008 R2 and earlier versions of SSIS, I got
some feedback recently to create new version of that Tutorial for PIVOT
transformation in SSIS 2012.
Fortunately Pivot Transformation GUI
improved too much in SSIS 2012 and you don’t need to set PivotUsage in the
Advanced Editor in 2008 R2 or earlier.
Just follow simple steps of this
tutorial and you will feel how small change in Pivot GUI caused big simplicity
on usage of it.
Sometimes, you need to use PIVOT in
SSIS.
brief explanation of what PIVOT is
from msdn is here:
PIVOT rotates a table-valued
expression by turning the unique values from one column in the expression into
multiple columns in the output, and performs aggregations where they are
required on any remaining column values that are wanted in the final output
This tutorial provides a complete
pivot sample on AdventureWorks2012 sample SQL
Server database with SSIS 2012…
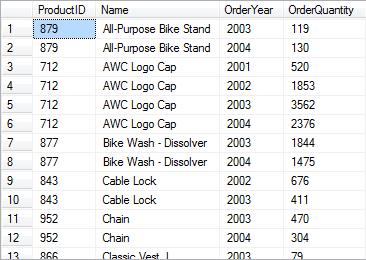
Assume you want to find order
quantities for each product by year.
you may use this query to get the
result:
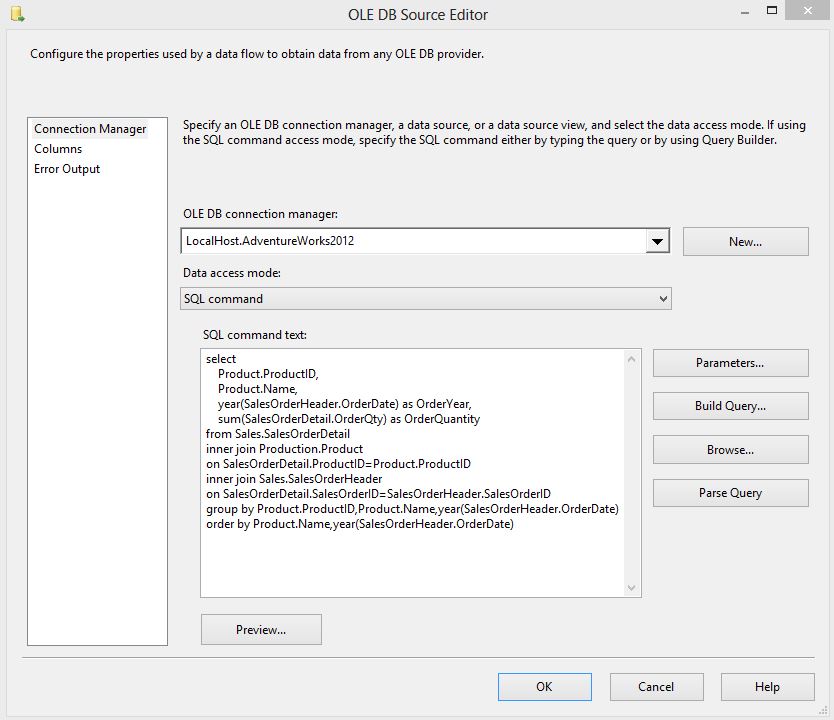
select
Product.ProductID,
Product.Name,
year(SalesOrderHeader.OrderDate) as OrderYear,
sum(SalesOrderDetail.OrderQty) as OrderQuantity
from Sales.SalesOrderDetail
inner join Production.Product
on SalesOrderDetail.ProductID=Product.ProductID
inner join Sales.SalesOrderHeader
on SalesOrderDetail.SalesOrderID=SalesOrderHeader.SalesOrderID
group by Product.ProductID,Product.Name,year(SalesOrderHeader.OrderDate)
order by Product.Name,year(SalesOrderHeader.OrderDate)
and this is result of query above:
Now , create a new SSIS package
Add a Data Flow Task
in dataflow tab :
Add a OLE DB Source and connect it
to AdventureWorks2012 database in your SQL Server
write the query in SQL command Text
of oledb data source,
then add a PIVOT Transformation
after OLE DB Data Source
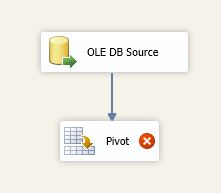
Double click on Pivot Transformation
to open Editor, you will see new GUI editor of SSIS 2012 for Pivot which is
much simpler to use than previous versions.
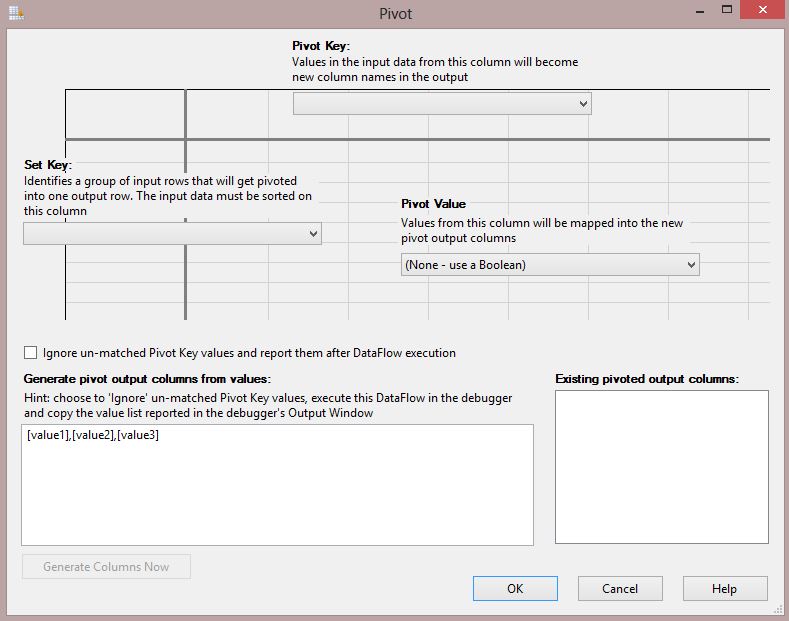
In the GUI Editor there are 3 types
of column that should be identified from the input columns.
Table below explains the meaning of
each column type in Pivot Transform: (PivotUsage column just mentioned here for
those of you who is interested to know what is happening in the behind of scene
of this GUI, the PivotUsage value will be set for each column as below numbers)
|
Name |
PivotUsage |
Description |
|
Pass |
0 |
The |
|
Set |
1 |
The |
|
Pivot |
2 |
The |
|
Pivot |
3 |
The |
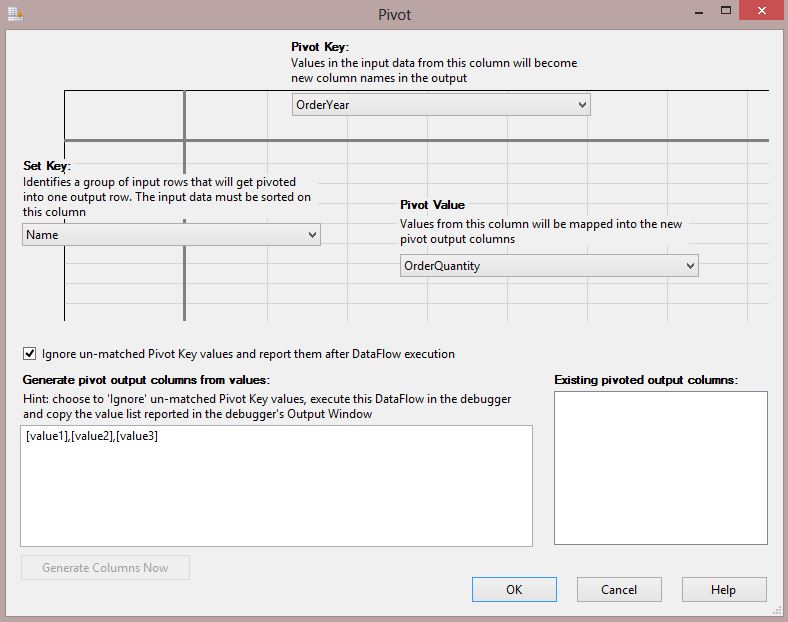
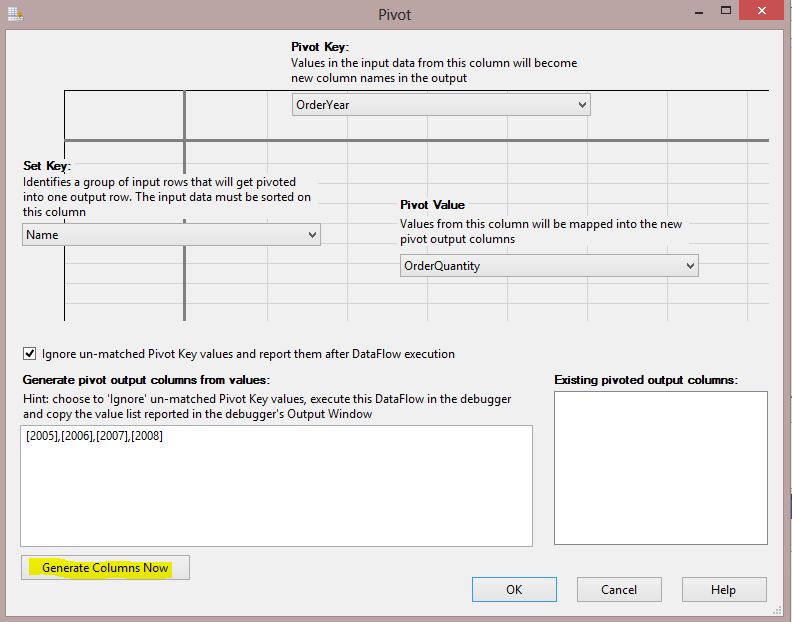
In the data sample here key columns
should be set in this order:
Set Key: Name
Pivot Key: OrderYear
Pivot Value: OrderQuantity
You can also get more information
when you look at GUI editor for Pivot;
Set Key showed in horizontal headers
and this means that there will be single row per each unique value in Set Key.
for example in this sample we want to view the result like single row per each
product name, so this is the reason why we put Name as Set Key.
Pivot Key showed in vertical headers
and this means that there will be single column per each value in Pivot Key.
for example in this sample we want to view the result like single column per
each year of order (like 2005,2006…), so this is the reason why we put
OrderYear as Pivot Key.
Pivot Value showed in value cell
area and this means that values of this column will be shown in junction of Set
Key and Pivot Key in each cell. for example values that we want to see in each
cell of desired output are quantity of orders for each product name in each
year, so this is the reason why we put OrderQuantity as Pivot Value.
After setting columns as above
description, check the "Ignore un-matched Pivot Key values and
report them after DataFlow execution" check box like screenshot below:
reason of checking this check box in
this stage is that:
Pivot transform is a static pivot
transform, and it needs to know exact values in Pivot Key column to generate
output columns based on it. with checking this check box and executing the data
flow task once, we will see unique values of Pivot Key in the execution results
window and then use it for completing the Pivot GUI configuration.
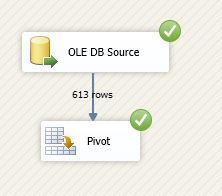
Now just execute the data flow task
(note that we didn’t added anything after pivot transform till now).
After execution go to Progress tab,
and scroll down find the line like below which has values found in the Pivot
Key column:
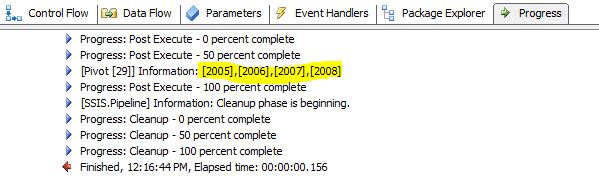
Right click on the line above and
"Copy Message Text" then stop the package and go back to Pivot GUI
again,
paste copied values into the box
under "Generate pivot output columns from values" like below: (Note
that you just column values should be listed here with comma between values as
below image shows):
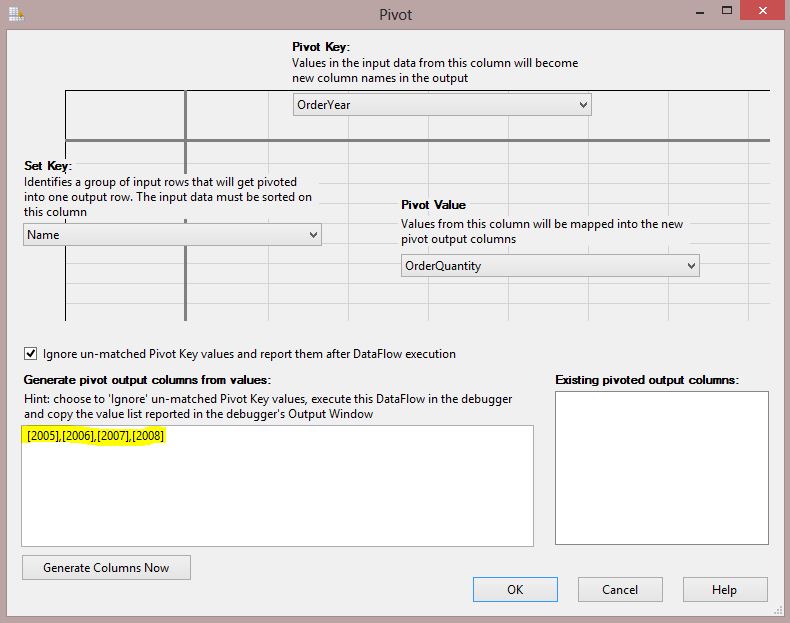
Now click on "Generate Columns
Now"
You will see a dialog box that shows
Generate Output Columns Results based on the values that you entered earlier;
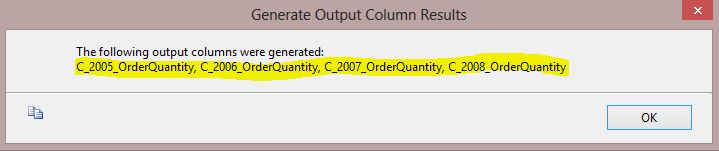
Just hit OK and you will see output
columns in the "existing pivoted output columns" area as below
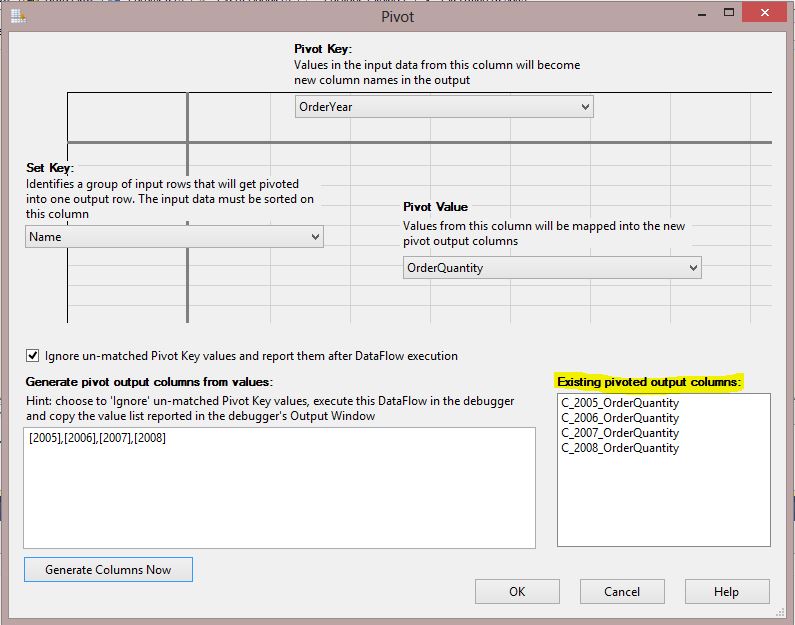
Now you finished configuration of
Pivot GUI.
just hit OK.
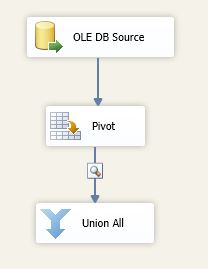
We will add a Union All transform
and data viewer just to show result generated by Pivot (you may use a
destination like a table or other transformation from this stage based on what
you want to do after pivoting data).
Add a Union All Transformation after
Pivot, and add a data viewer in the data path between Pivot and Union All like below:
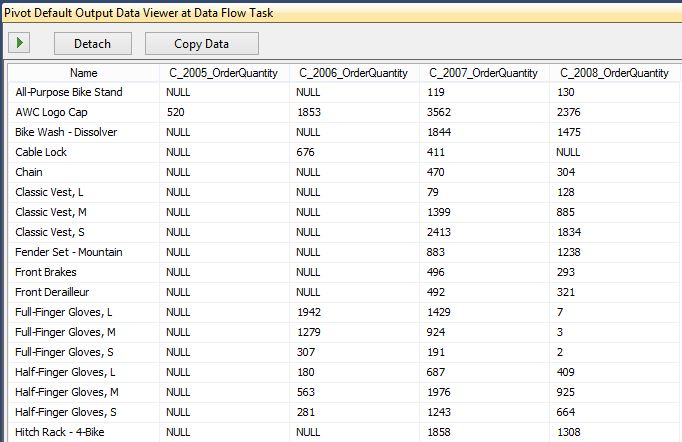
now execute the package to see
results in data viewer, a sample screenshot of result showed here:
That’s All. Now I am pretty sure you
are agree with me that improvements in GUI of Pivot transform helped a lot in
configuring key columns of this transform rather than previous versions.
Again please note that this Tutorial
is for SSIS 2012, so if you want to use Pivot Transform in SSIS 2008 R2 or
earlier versions try this tutorial.


Reza is author of more than 14 books on Microsoft Business Intelligence, most of these books are published under Power BI category. Among these are books such as Power BI DAX Simplified, Pro Power BI Architecture, Power BI from Rookie to Rock Star, Power Query books series, Row-Level Security in Power BI and etc.
He is an International Speaker in Microsoft Ignite, Microsoft Business Applications Summit, Data Insight Summit, PASS Summit, SQL Saturday and SQL user groups. And He is a Microsoft Certified Trainer.
Reza’s passion is to help you find the best data solution, he is Data enthusiast.
His articles on different aspects of technologies, especially on MS BI, can be found on his blog: https://radacad.com/blog.