
Sometimes, you need to use PIVOT in SSIS.
brief explanation of what PIVOT is from msdn is here:
PIVOT rotates a table-valued expression by turning the unique values
from one column in the expression into multiple columns in the output,
and performs aggregations where they are required on any remaining
column values that are wanted in the final output
This tutorial provides a complete pivot sample on AdventureWorks sample SQL Server database with SSIS 2008…
*** Update ***
For SSIS 2012 version of this tutorial use this link
*** Update ***
Assume you want to find order quantities for each product by year.
you may use this query to get the result:
select
Product.ProductID,
Product.Name,
year(SalesOrderHeader.OrderDate) as OrderYear,
sum(SalesOrderDetail.OrderQty) as OrderQuantity
from Sales.SalesOrderDetail
inner join Production.Product
on SalesOrderDetail.ProductID=Product.ProductID
inner join Sales.SalesOrderHeader
on SalesOrderDetail.SalesOrderID=SalesOrderHeader.SalesOrderID
group by Product.ProductID,Product.Name,year(SalesOrderHeader.OrderDate)
order by Product.Name,year(SalesOrderHeader.OrderDate)
and this is result of query above:
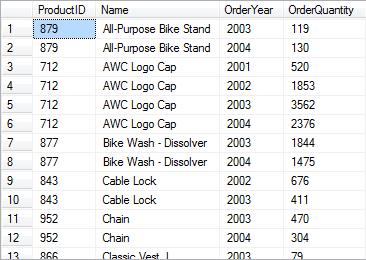
Now , create a new SSIS package
Add a Data Flow Task
in dataflow tab :
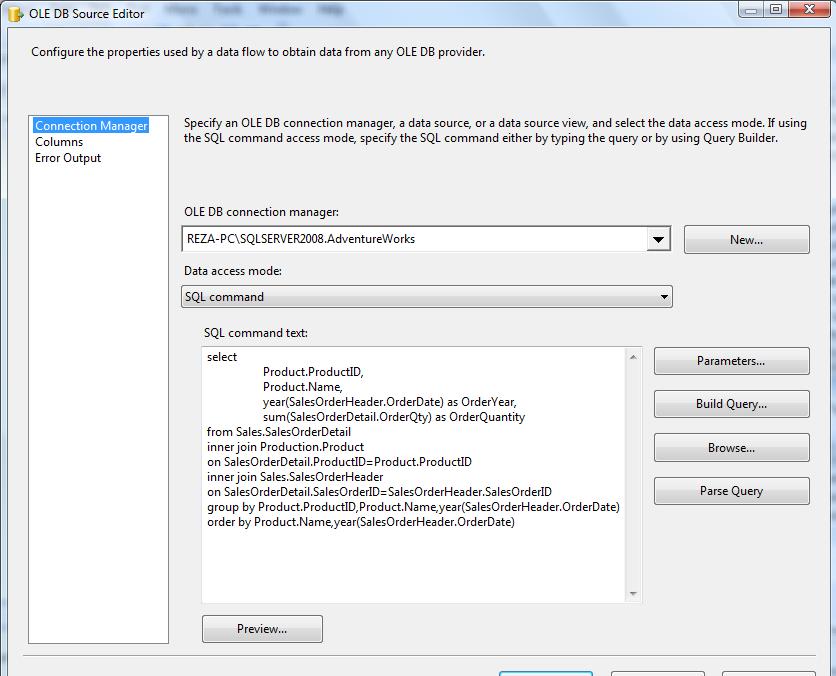
Add a OLE DB Source and connect it to AdventureWorks database in your SQL Server
write the query in SQL command Text of oledb data source,
then add a PIVOT Transformation after OLE DB Data Source
in Pivot transformation advanced editor , go to input columns tab and select all input columns
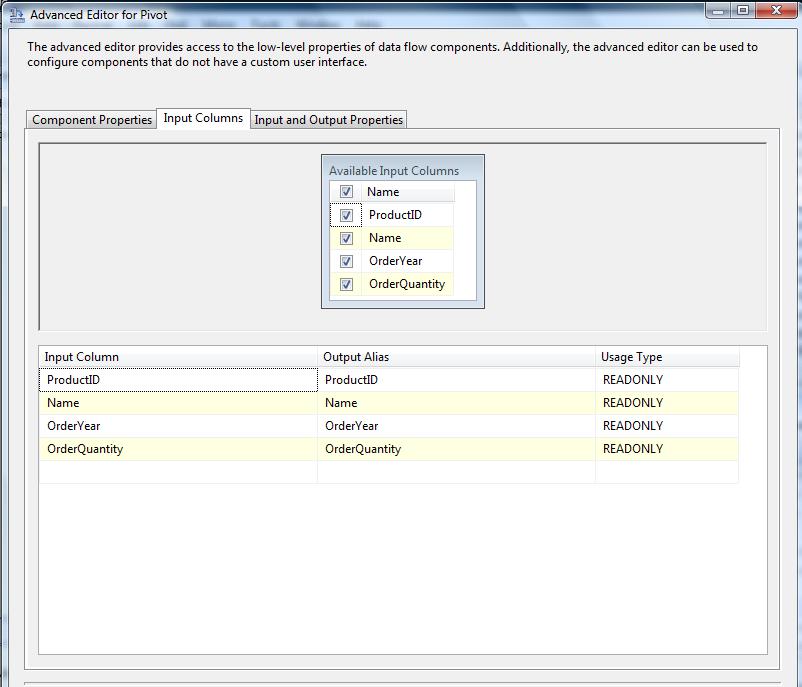
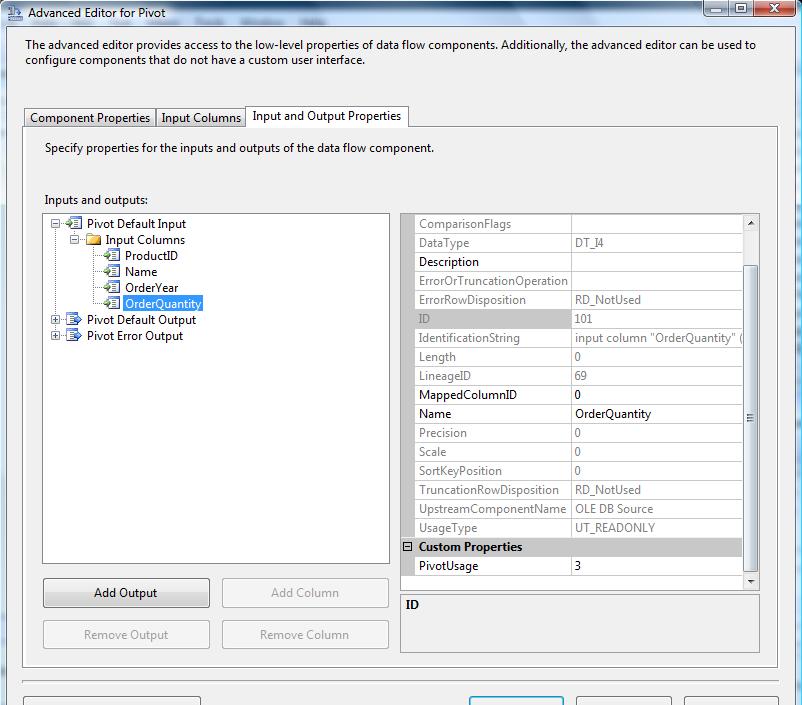
then go to input and output properties tab, select pivot default input, under input columns you will find all columns which you selected in previous tab.
the only property you must set for each input column is the PivotUsage .
this describe the values you can use in PivotUsage property:

So , in this example , PivotUsage property for each input column will be as below:
ProductID 0
Name 1
OrderYear 2
OrderQuantity 3
Notice that you must have at least one input column with PivotUsage 2, one input column with PivotUsage 3,one input column with PivotUsage 0 OR 1 at least in your pivot transformation.
After setting input columns, go to Pivot Default output , and under output columns add these columns:
ID, Name , 2001 ,2002 , 2003 , 2004
ID and Name columns will show the exact values form ProductID and Name input columns.
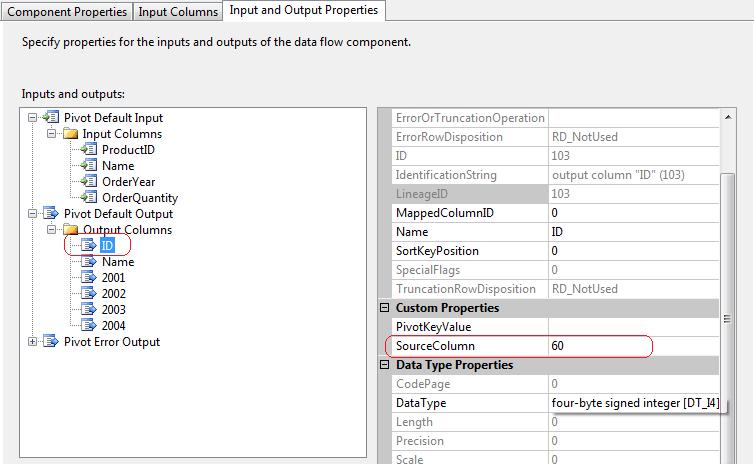
So, set SourceColumn property of ID output column to LineAgeID of ProductID input column.
Note: this is critical to use the lineageID value of input columns not the ID value. if you use ID value you will face error.
but how can you find lineageID of input columns?
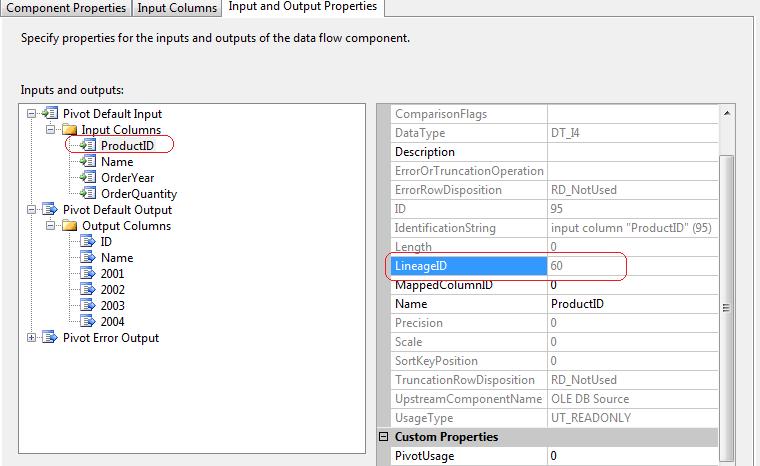
simply select ProductID under input columns and see the lineageID value there.
Note: the lineageID is different on each machine, so you can not use exact lineage numbers used in this example.you must use your lineageID values.
this is lineageID of ProductID input column:
and this is the SourceColumn property in ID output column:
leave the PivotKeyValue of ID and Name output column as empty.
Do above steps for Name output column with Name input column too
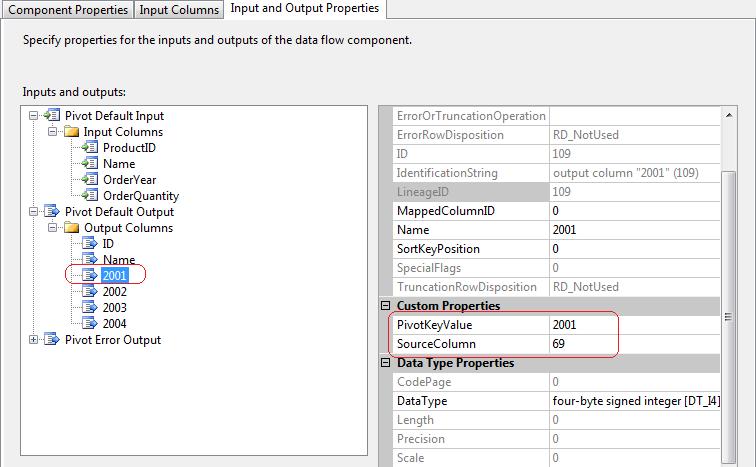
Now it’s Pivot columns turn, select 2001 under output columns
this columns will show the results for the year 2001, so enter 2001 in PivotKeyValue property.
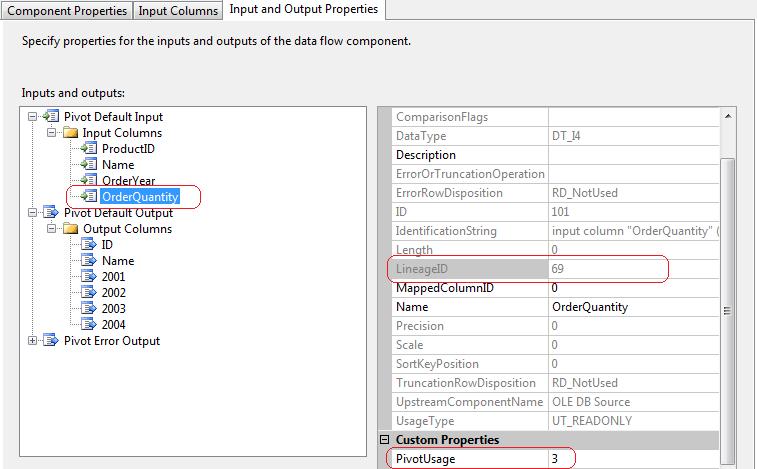
and set SourceColumn with lineageID of OrderQuantity input column.
In fact you must set SourceColumn property with the lineageID of the input column which has the PivotUsage 3 value.
in this example , lineageID of OrderQuantity is 69 (Remember you must use your own lineageIDs)
So, we set SourceColumn with 69 in 2001 output column:
Now , do the same for 2002,2003,2004 columns.the only difference is that you must set PivotKeyValue to 2002,2003,2004 in these columns. but lineageID will be the same in all 2001 – 2004 columns.
Pivot configuration finished now.
Just add a destination, and fill the result of Pivot in destination.
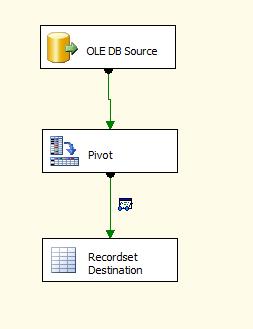
I used a RecodeSet Destination with a Grid Data Viewer to show the result,
you can add Grid dataviewer by right click on green arrow between pivot transformation and your destination, then select data viewers, then add Grid.
this is the full desing of my DataFlow Task:
and this is the final Result:


Reza is author of more than 14 books on Microsoft Business Intelligence, most of these books are published under Power BI category. Among these are books such as Power BI DAX Simplified, Pro Power BI Architecture, Power BI from Rookie to Rock Star, Power Query books series, Row-Level Security in Power BI and etc.
He is an International Speaker in Microsoft Ignite, Microsoft Business Applications Summit, Data Insight Summit, PASS Summit, SQL Saturday and SQL user groups. And He is a Microsoft Certified Trainer.
Reza’s passion is to help you find the best data solution, he is Data enthusiast.
His articles on different aspects of technologies, especially on MS BI, can be found on his blog: https://radacad.com/blog.