
K Nearest Neighbor (KNN ) is one of those algorithms that are very easy to understand and has a good accuracy in practice. KNN can be used in different fields from health, marketing, finance and so on [1]. KNN is easy to understand and also the code behind it in R also is too easy to write. In this post, I will explain the main concept behind KNN. Then in Part 2 I will show how to write R codes for KNN. Finally in the Part 3 the process of how run KNN in Power BI data will be explained.
To understand the KNN concepts, consider below example:
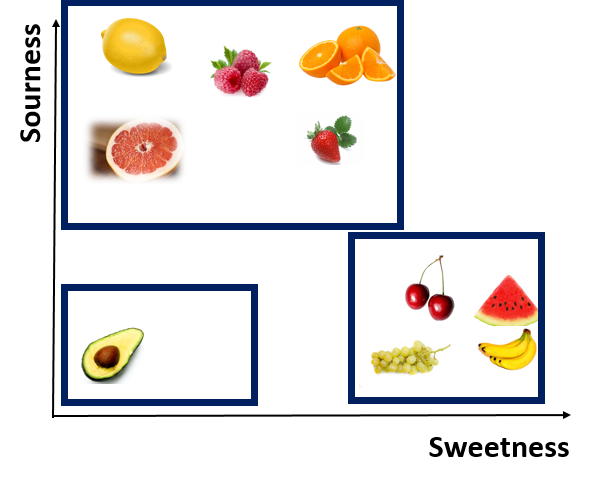
We are designing a game for children below 6 . First we asked them to close their eyes and then by tasting a fruit, identify is it sour or sweet. based on their answers, we have below diagram
as you can see we have three main groups based on the level of sweetness and sourness. we asked children to put a number of sweetness and sourness for each fruits in 10 scale. so we have below numbers. As you can see Lemon for example, has the high number in Sourness and low number in sweetness. Whist, Watermelon has high number (9) in sweetness and number 1 for sourness. (this is a example maybe the number is not correct, the aim of this example to show the concepts behind the KNN)
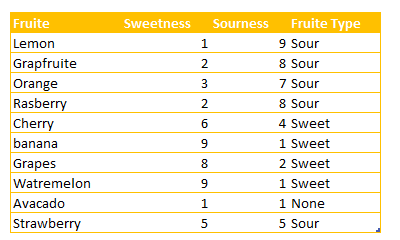
Imagine that we have a fruit that is not in above list, we want to identify the nearness of that fruit to others and then identify it is a sweet fruit or sour one. Consider figs as example. to identify it is a sweet or sour fruit, we have some number of its level of sourness and sweetness as below
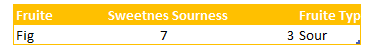
as you can see for sweetness it is 7 and for sourness it is 3
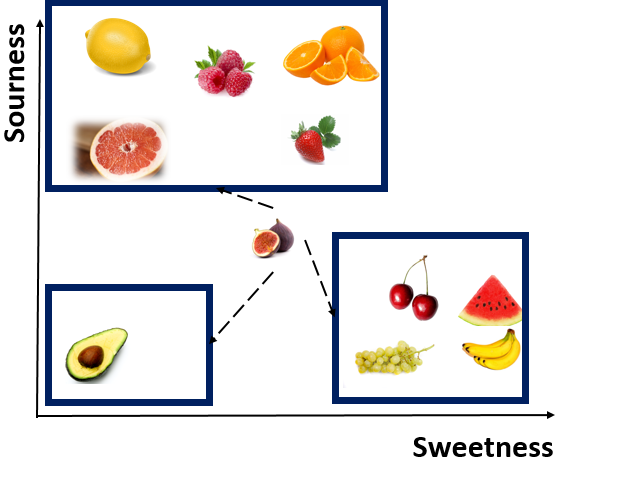
to find which fruit is near to this one, we should calculate the distance between Figs and other fruits.
from mathematics perspective, to find out distance between two points, we use the Euclidean distance formula as below:


For calculating the distance between Figs and Lemon, we first subtract their dimensions (above formula)
distance between Fig and Lemon is 8.2 now we are going to calculate this distance for all other fruits. as you can see in below table, the distance between Cherry and Grapes is so close to Figs (distance 1.41)
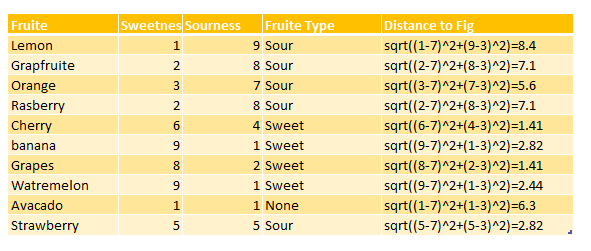
hence, Cherry and Grape are closet neighbor to Fig, we call them the first Nearest Neighbor. Watermelon with 2.44 is the Second Nearest Neighbor to Figs. the third nearest neighbor is strawberry and banana.
as you see in this example we calculate 8 nearest neighbor.
8 nearest neighbor for this example is Lemon with 8.4 distance. there is a lot distance between Lemon and Figs, so it is not correct to consider Lemon as nearest Neighbor. to find the best number for k(number of neighbors) we have consider the square root of the number of observations in our example. For instance,we have 10 observations which Square root is 3, so we have 3 nearest neighbors based on distance as first neighbor(Cherry and Grapes), second neighbor(Watermelon) and third is (Banana and Strawberry).
Because all of these are Sweet fruits, we consider Figs as a sweet one.
so in any example we calculate the distance of items to others categories. there other methods for calculating the distance.
KNN, has been used to predict a group for new items. for example:
1. predict that a customer will stay with us or not (new customer belong to with group: stay or leave)
2. image processing, if an uploaded picture of animal is related t birds, cats, and so on.
In the next post I will explain the related R codes for KNN .
[2].Machine Learning with R,Brett Lantz, Packt Publishing,2015.


Thank you for the article.
How does one decide which classifier algorithm to choose? Should one be using KNN? SVM? etc…
Any guidance?
Thank you…
John
Your welcome,
It depends KNN is good for both linear and none linear data but not good for outlier, SVM is good for outlier. Also SVM can be used in linear or non-linear. SVM works differently and it is good and fast solution for many problems.KNN is also very sensitive to bad features (attributes) so feature selection is also important.
What’s the memory & file size impact of R code on a Power BI solution such as the KNN or one that may include data modeling & a large dataset?
Hi tony, I will write a blog soon and I will show how if we have different size of data using one algorithm how is the speed of training, hope that one helps to answer, that is a really good question, however I applied R algorithm in other big dataset for aim of textmining and other aim, it was goo, but for KNN I should try