
Power BI users Sorting in most of the visualizations, you can choose to sort ascending or descending based on specified data fields. However the field itself can be sorted based on another column. This feature called as Sort By Column in Power BI. This is not a new or advanced feature in Power BI. This is very basic feature that enhance your visualization significantly. Let’s look at this simple feature with an example. If you like to learn more about Power BI; read Power BI online book from Rookie to Rock Star.
Prerequisite
For running example of this post you will need AdventureWorksDW sample database, or you can download Excel version of it from here:
Sorting in Power BI
By Default a field’s data is sorted by that field it self. It means if the field is numeric it will be ordered based on the number, if it is text it will be ordered alphabetically. Let’s look at it through an example;
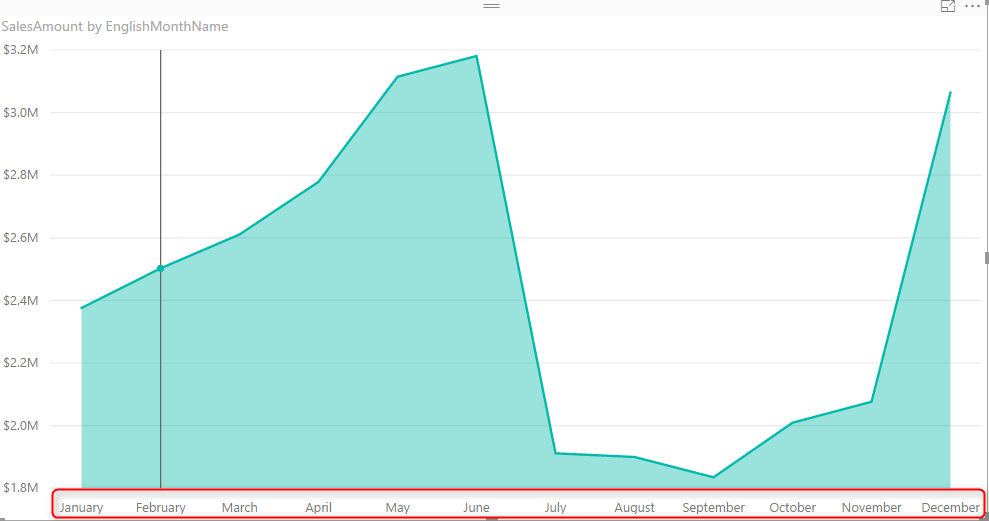
Create a New Power BI Desktop file, and Get Data from AdventureWorksDW, from DimDate, and FactInternetSales Tables. Check the relationship between these tables to be only based on an active relationship between OrderDateKey in the FactInternetSales and DateKey in the DimDate. remove any extra relationships. Create a visualization (Area Chart for example) with SalesAmount as Values, and EnglishMonthName as Axis.
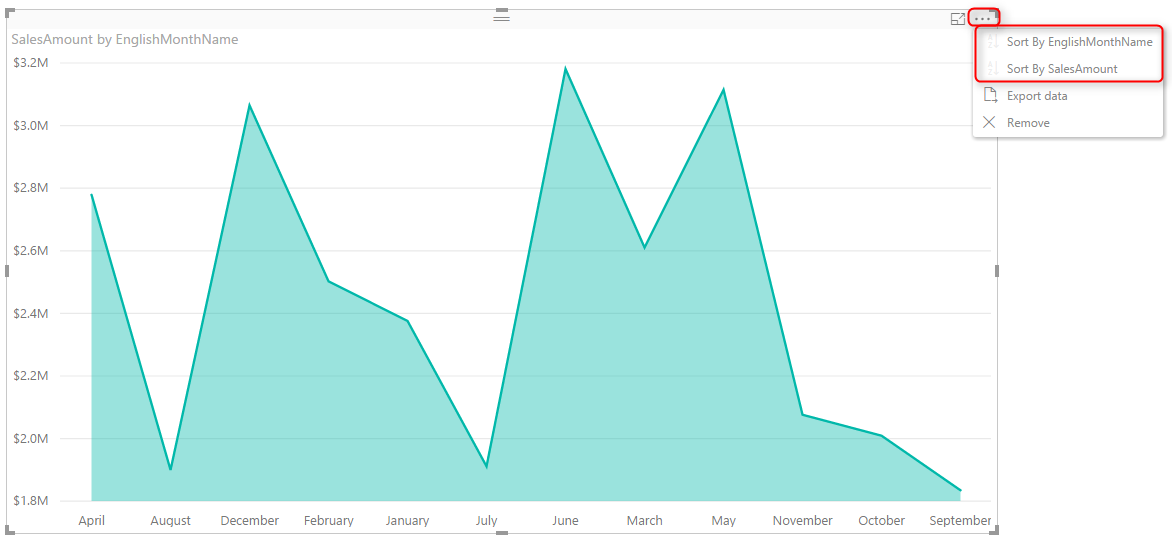
If you click on the three dot button on top right hand side of the chart you can see the sorting option for this visual. You can choose to sort based on fields that used in this visual, which can be either SalesAmount, or EnglishMonthName. If you sort it based on Sales Amount it is obviously showing you from biggest value to the lowest or reverse. This is the normal behaviour, a field will be ordered by values in the field itself.
Problem in Sorting
Problem happens when you want a Text field to be ordered based on something different than the value of the field. For example if you look at above chart you can see that months ordered from April to September. This is not order of months, this is alphabetical order. If you change the sorting of visual, it will only change it from A to Z, or Z to A. To make it in the order of month numbers you have to do it differently.
Sort By Column
If you wish a column to be sorted by values of another column you can simply do that in the Data tab of Power BI Desktop. First go to Data Tab, Select the field that you want to be sorted (EnglishMonthName in this example), and then from the menu option under Modeling choose Sort Column By, and select the field that contains numeric values of months (1, 2, 3, …12). This field in our example is MonthNumberOfYear.
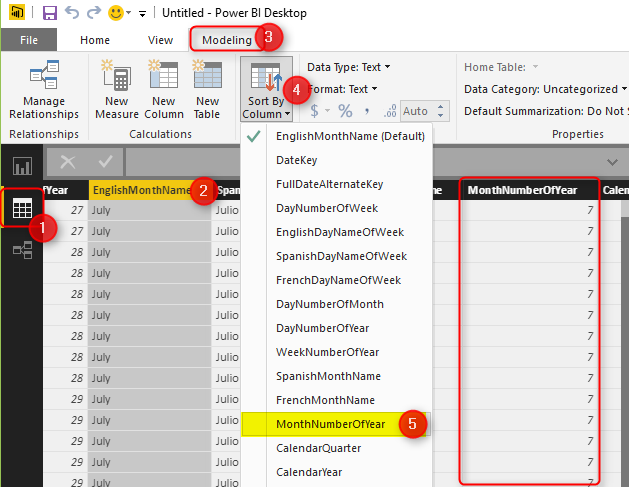
You can see in the screenshot above that MonthNumberOfYear is showing the numeric value of each month. After applying this change, simply go back to the report, and you will see the correct ordering of EnglishMonthName now.
More Cases to use Sort By Column
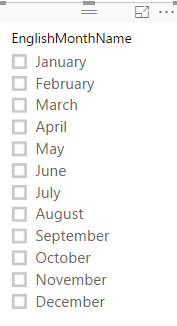
When you use this type of sorting, all visuals will be working based on this ordering. If you have a slicer, items in the slicer will be sorted and ordered based on this. This would be the way of filtering for that column from now onward. You can also think about many other possibilities and usages of this feature, here are few;
- Ordering Month Names based on Financial Period order. In this case you will need a FiscalMonthNumberOfYear column.
- Ordering items in slicer based on something different than the text. For example Priority or categories or anything like that.
Hide the Column Used for Sorting
The column used for sorting (in this example MonthNumberOfYear) is not normally used for visualization itself. So you can simply Hide it from Report View.
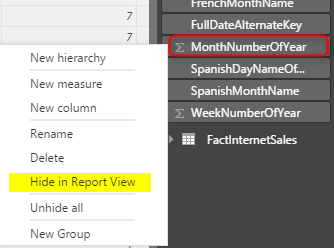
This is a recommended approach because having too many fields in the report view is confusing for end users.
Download
Download the Power BI file of demo from here:
Video
Save


Reza is author of more than 14 books on Microsoft Business Intelligence, most of these books are published under Power BI category. Among these are books such as Power BI DAX Simplified, Pro Power BI Architecture, Power BI from Rookie to Rock Star, Power Query books series, Row-Level Security in Power BI and etc.
He is an International Speaker in Microsoft Ignite, Microsoft Business Applications Summit, Data Insight Summit, PASS Summit, SQL Saturday and SQL user groups. And He is a Microsoft Certified Trainer.
Reza’s passion is to help you find the best data solution, he is Data enthusiast.
His articles on different aspects of technologies, especially on MS BI, can be found on his blog: https://radacad.com/blog.