
In the last posts (Series of Time Series), I have explained about what is ARIMA, what is d,p, and q in ARIMA (p,d,q).
In this post, I will talk about how to use ARIMA for forecasting and how to handle the seasonality parameters.
in the last example for the age of death of the England king, we came up with an ARIMA model as below
ARIMA(0,1,1)
now, we going to forecast based on ARIMA
1-first we need to create an ARIMA model as:
arima(kingTSObj,order=c(0,1,1))
Arima model gets the time series object as first input, then the model parameters in a vector type.
we store the result in a variable name:
kingArimaforecast
2- the second step is about forecasting. To do forecasting, we need a library name “forecast”. install it.
library("forecast")
KingArimaTSForecast<-forecast.Arima(kingArimaforecast,h=5)
the forecast.Arima gets the model (the variable we sore ARIMA model in it) and for the second input, it gets the period we want to forecast. In this example, we want to know the forecast for the next 5 kings that in which age they will die.
Then we plot the forecast using “plot.forecast” function.
the whole code would be as below
kings <- scan("http://robjhyndman.com/tsdldata/misc/kings.dat",skip=3)
kingTSObj<-ts(kings)
kingArimaDiff<-diff(kingTSObj,kingTSObj=1)

library("forecast")
kingArimaforecast<-arima(kingTSObj,order=c(0,1,1))
KingArimaTSForecast<-forecast.Arima(kingArimaforecast,h=5)
plot.forecast(KingArimaTSForecast)
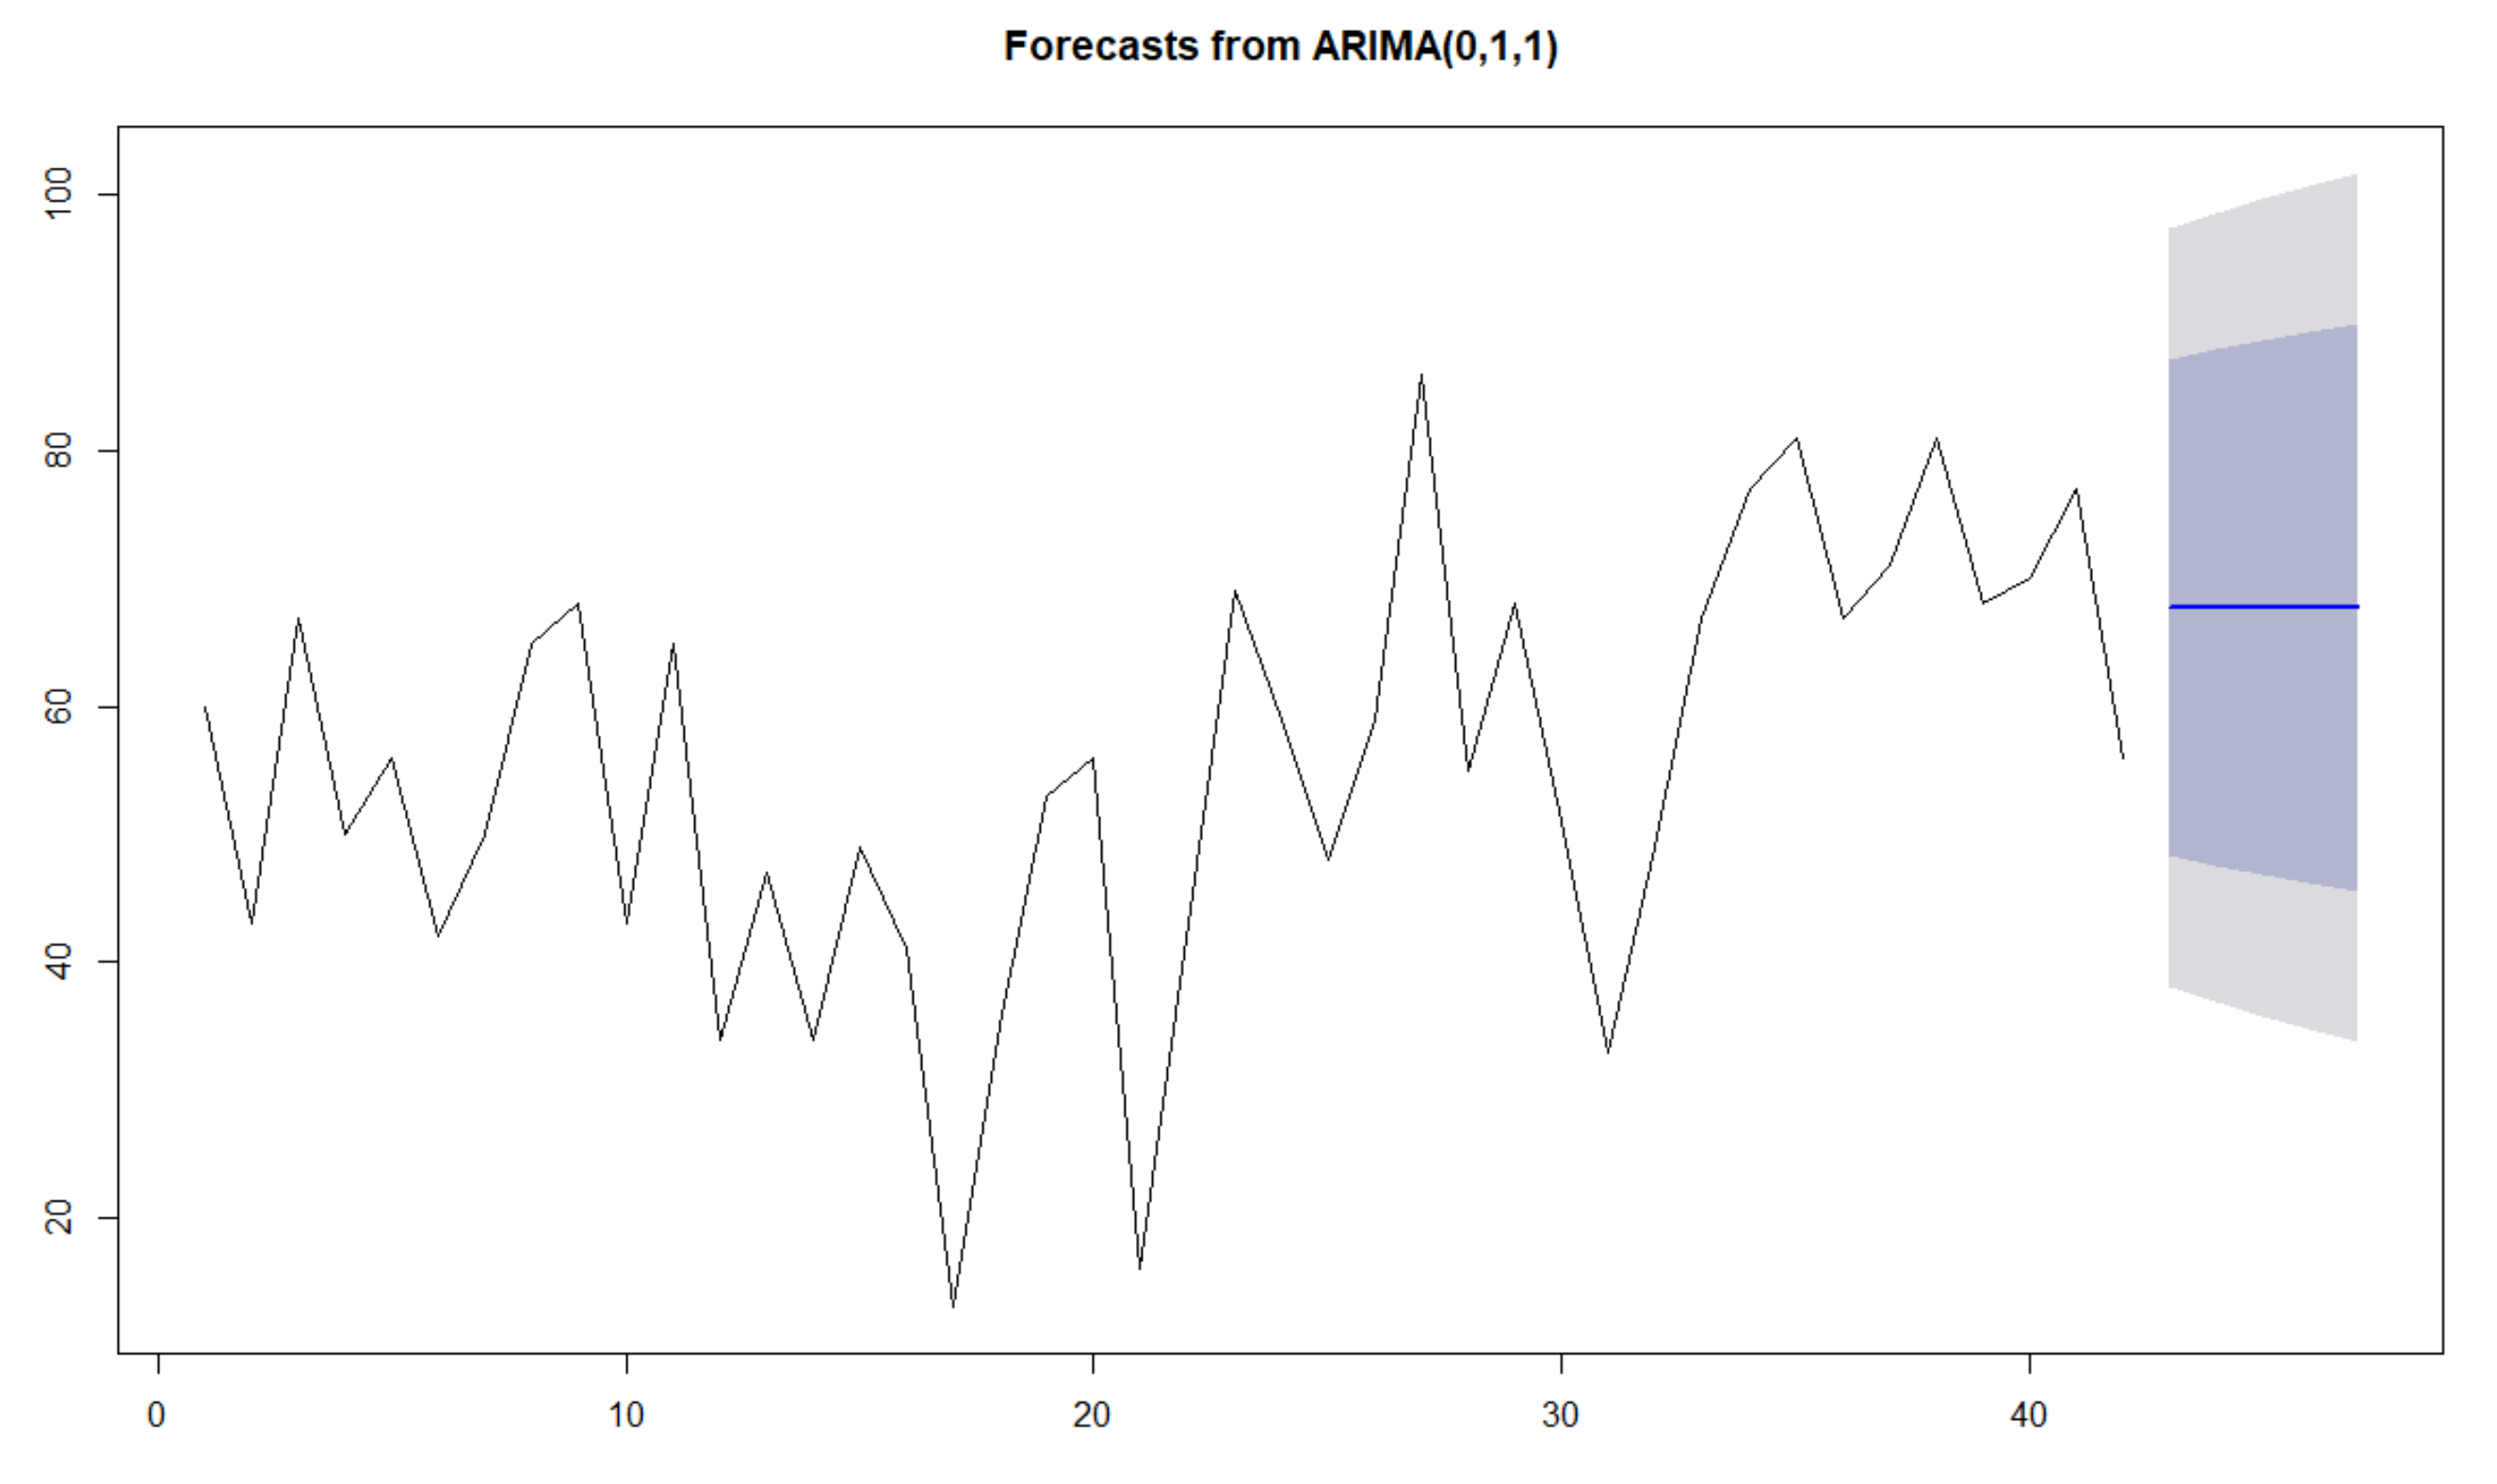
the below forecast is shown here:
As you can see in the above picture, there is a slow decreasing trend in the forecast.
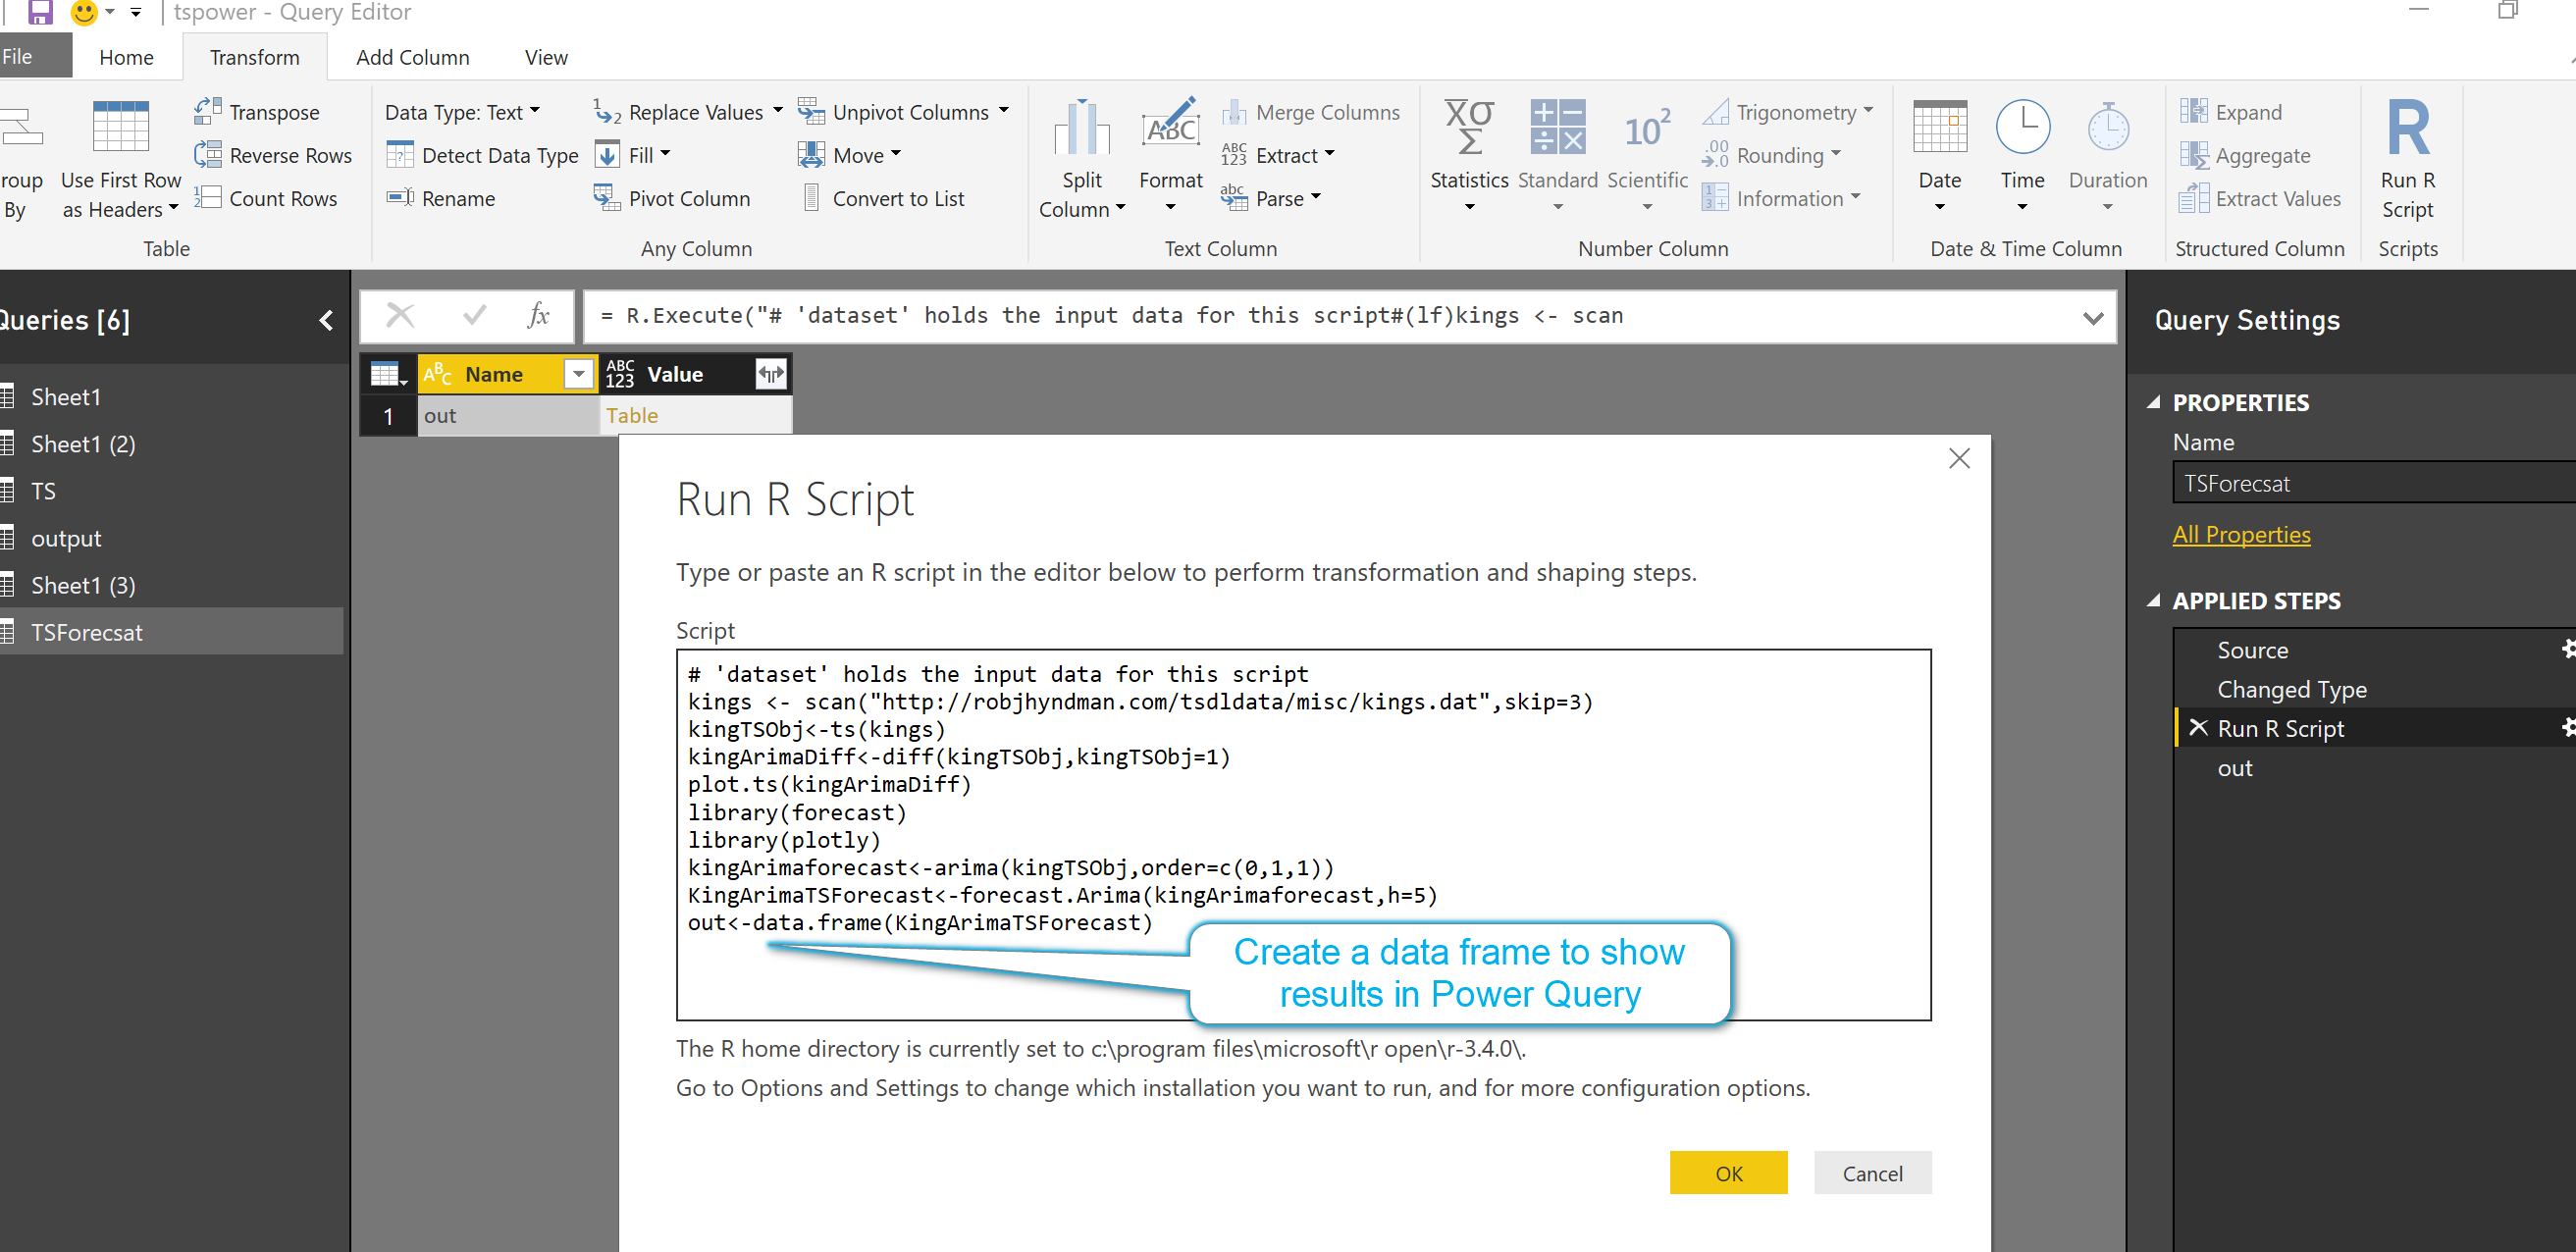
also you able to run this code in power query to see the numeric forecast instead of the chart.
so I have run the same code with a small change to it: create an output data frame to show data
# 'dataset' holds the input data for this script
kings <- scan("http://robjhyndman.com/tsdldata/misc/kings.dat",skip=3)
kingTSObj<-ts(kings)
kingArimaDiff<-diff(kingTSObj,kingTSObj=1)
plot.ts(kingArimaDiff)
library(forecast)
library(plotly)
kingArimaforecast<-arima(kingTSObj,order=c(0,1,1))
KingArimaTSForecast<-forecast.Arima(kingArimaforecast,h=5)
out<-data.frame(KingArimaTSForecast)
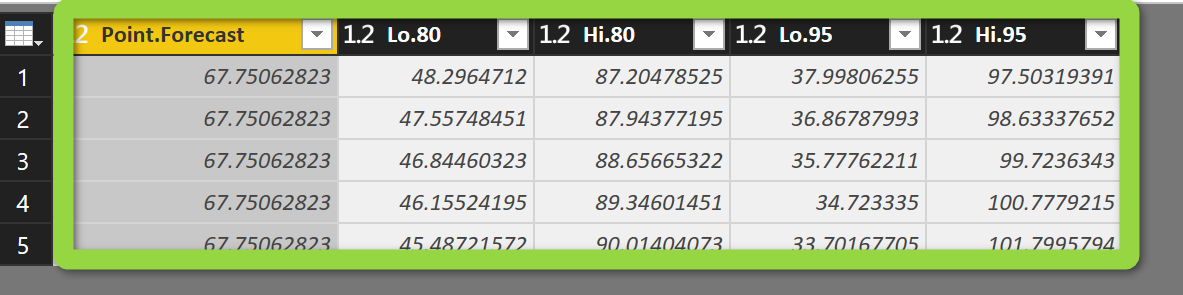
so the below output will be as below:
the last question remains to answer is about the “intervals” low and high.
imaging the error (residual) in “21.55”
we are going to calculate the intervals for low and high range, for the high range we multiply it by 95% and for low, we multiply it by 80%. however, we have a table for mapping as below
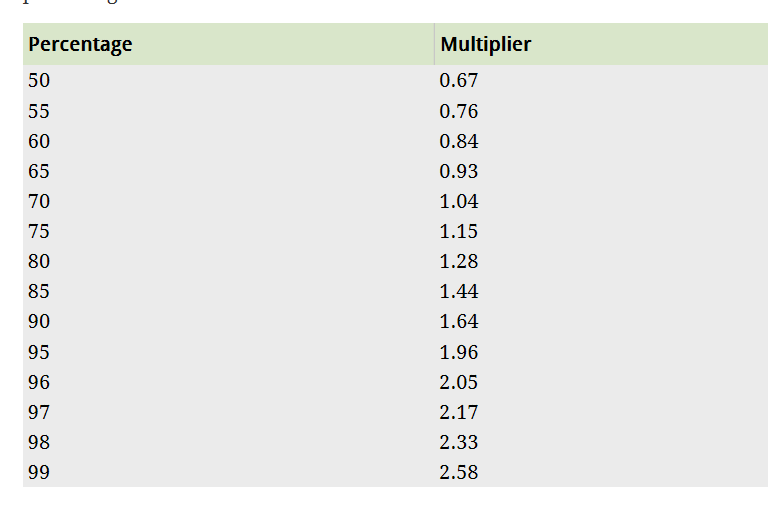
the forecast is 67.8
so we have 67.8+ or -1.28(21.55) for 80% and for 95% we have 67.8+ or -1.96(21.55) which become
95 and 40,2 for 80%
110 and 25.56 for 95%
the time series for king age was none seasonal time series. in next post, I will show how to forecast and create an ARIMA model for seasonal TS.


