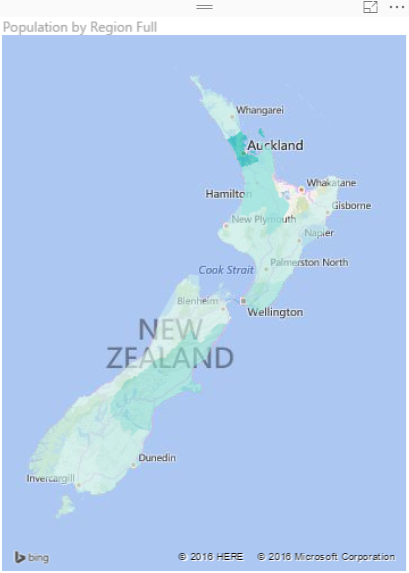
Power BI Filled Map; the Good, the Bad, and the Ugly
Power BI utilizes two built-in map charts; Map and Filled Map. Filled Map is a map that shows data points as Geo-spatial areas rather than points on map. Areas can be continent, country, region, state, city, or county. Working with Filled Map however isn’t as easy and convenient as the map chart is. You need Read more about Power BI Filled Map; the Good, the Bad, and the Ugly[…]