Visualizing Data Distribution in Power BI – Histogram and Norm Curve -Part 2

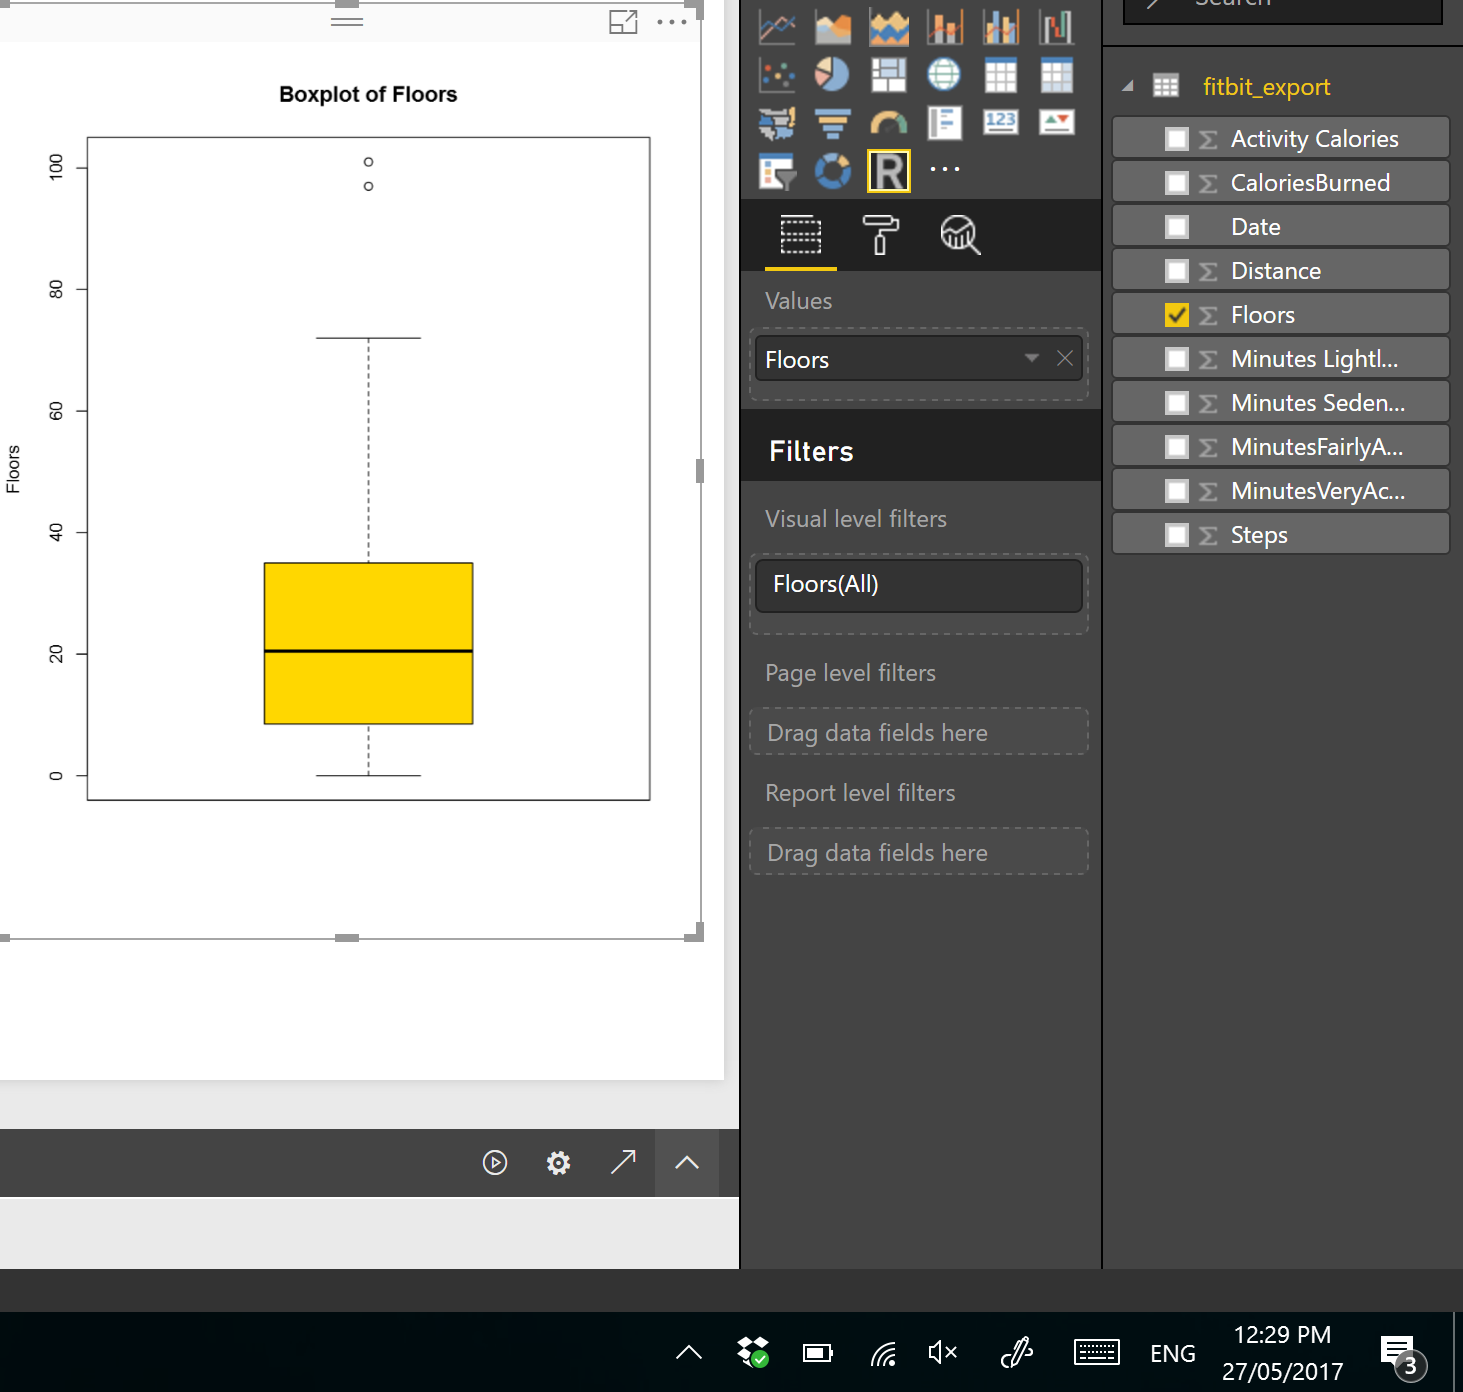
In the Part 1 I have explained some of the main statistics measure such as Minimum, Maximum, Median, Mean, First Quantile, and Third Quantile. Also, I have show how to draw them in Power BI, using R codes. (we have Boxplot as a custom visual in power BI see :https://powerbi.microsoft.com/en-us/blog/visual-awesomeness-unlocked-box-and-whisker-plots/ ). However, to see the data Read more about Visualizing Data Distribution in Power BI – Histogram and Norm Curve -Part 2[…]

Visualizing numeric variables in Power BI – boxplots -Part 1

In this post and next one, I am going to show how to see data distribution using some visuals like histogram, boxplot and normal distribution chart. It always important to have a holistic perspective regarding the minimum, maximum, middle, outliers of our data in one picture. One of the chart that helps us to have a Read more about Visualizing numeric variables in Power BI – boxplots -Part 1[…]

Identifying Number of Cluster in K-mean Algorithm in Power BI: Part 7

I have explained the main concept behind the Clustering algorithm in Post 5 and also I have explained how to do cluster analysis in Power BI in Part 6. In this post, I will explain how identify the best number of cluster for doing cluster analysis by looking on the “elbow chart” K-Mean clusters the data Read more about Identifying Number of Cluster in K-mean Algorithm in Power BI: Part 7[…]

Power BI Premium. Is It For You or Not?

There were many announcements earlier this month about Power BI. One of them which was and still is the breaking news of all is Power BI Premium. Many of you already know that it is a new licensing plan, but how it works? Is this a licensing plan that works for you or not? What Read more about Power BI Premium. Is It For You or Not?[…]

Want to Join RADACAD? We are Hiring

Yes, you’ve heard it right. We are growing fast, and we need YOU to join us. Joining us means; 5 weeks paid annual leave One overseas conference Access to the most comprehensive training course of Power BI; from Rookie to Rock Star Access to full complete training course of Advanced Analytics Access to many video Read more about Want to Join RADACAD? We are Hiring[…]

K-mean clustering In R, writing R codes inside Power BI: Part 6

In the previous post,I have explained the main concepts and process behind the K-mean clustering algorithm. Now I am going to use this algorithm for classifying my Fitbit data in power BI.   as I have explained in part 5, I gathered theses data from Fitbit application and I am going to cluster them using Read more about K-mean clustering In R, writing R codes inside Power BI: Part 6[…]

Clustering Concepts , writing R codes inside Power BI: Part 5

Sometimes we just need to see the natural trend and behaviour of data without doing any predictions. we just want to check how our business data can be naturally grouped. According to the Wikipedia , Cluster analysis or clustering is the task of grouping a set of objects in such a way that objects in the same group (called a cluster) Read more about Clustering Concepts , writing R codes inside Power BI: Part 5[…]