
There are many different ways you can create aggregations in Power BI, You can do it in the source (using the database t-SQL language), or using Group By operation in Power Query. You can also do it in DAX using some functions. One of the functions that can be used for grouping and aggregation is Group By. This article is about how to use Group By in DAX. Creating aggregation using DAX is a very useful skill because you can use it to create virtual tables in your measures and have better dynamic calculations in Power BI.
Sample Data
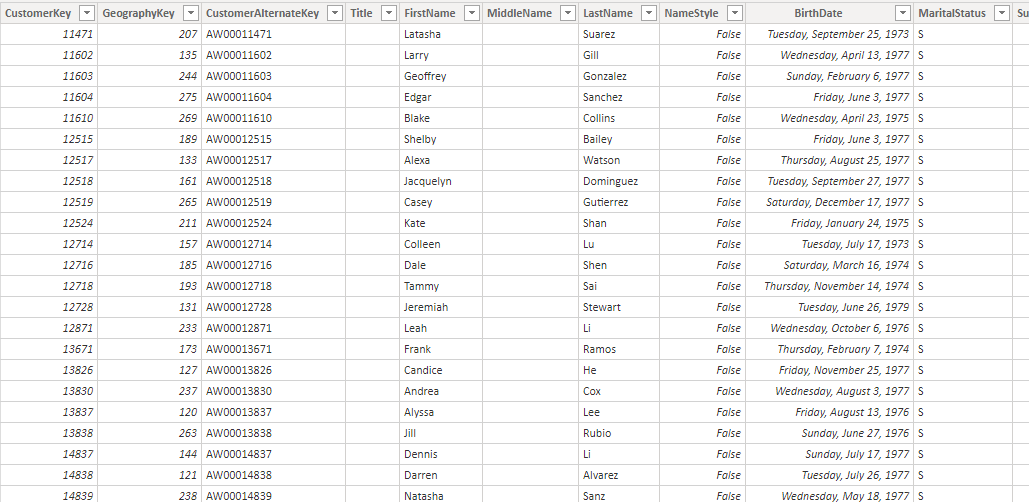
My sample dataset table is DimCustomer as below;
GroupBy Function
GroupBy DAX function can be used as below:
GROUPBY( <table>, <grouping column1>, [<output aggregation column name>, <expression for aggregation column>]…)
- The Table can be a table in your dataset, or any virtual table (means any function that returns a table).
- grouping column1: the column that you want the resultset to be grouped by that column. this is an existing column in the table above.
- name: the name that you give to the new column created.
- expression: the expression that is used for the new column created.
- you can have more than one grouping column.
Just Grouping
As an example, a basic usage of GroupBy is to create a list of unique EnglishEducation values from the DimCustomer table with the below expression:
GroupBy - Just Group = GROUPBY(
    DimCustomer,DimCustomer[EnglishEducation])
This is used to create a calculated table, and here you can see the result:
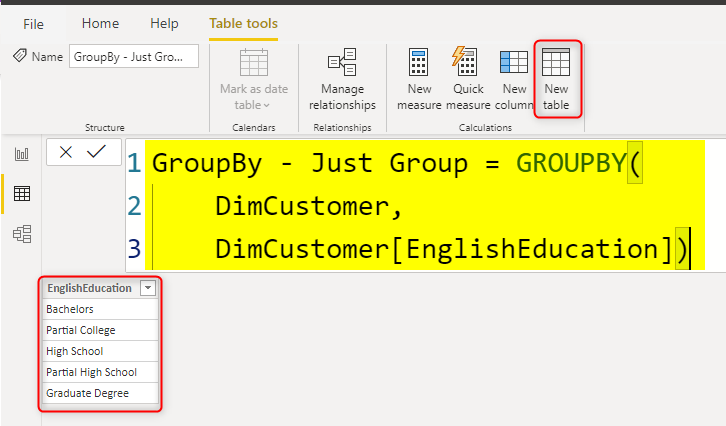
In the above example, the table is DimCustomer, and the Grouping happens on the EnglishEducation column of that table. The result is the grouped list of EnglishEducation. Which is the same result compared to using DISTINCT or VALUES functions. If you just want a distinct list, you might use one of the other two functions rather than GroupBy. Using GroupBy function is normally comes with a new column which is the aggregated result.
Grouping and Aggregation: CurrentGroup
If you want to do grouping and aggregation using the GroupBy, there is an important function you should use, which is CurrentGroup. Let’s say you want to calculate count of customers within each group of EnglishEducation. You might think of an expression like this:
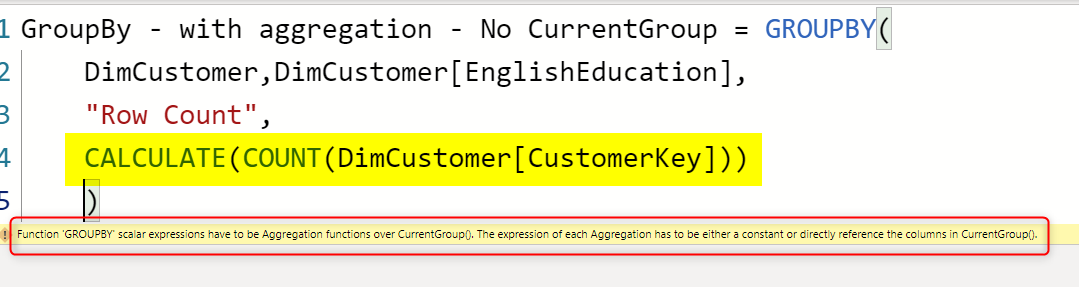
The Row Count column supposed to show the count of customers for each EnglishEduction group. However, if you use it like the above expression, you will get this error:
Function ‘GROUPBY’ scalar expressions have to be Aggregation functions over CurrentGroup(). The expression of each Aggregation has to be either a constant or directly reference the columns in CurrentGroup().
CurrentGroup
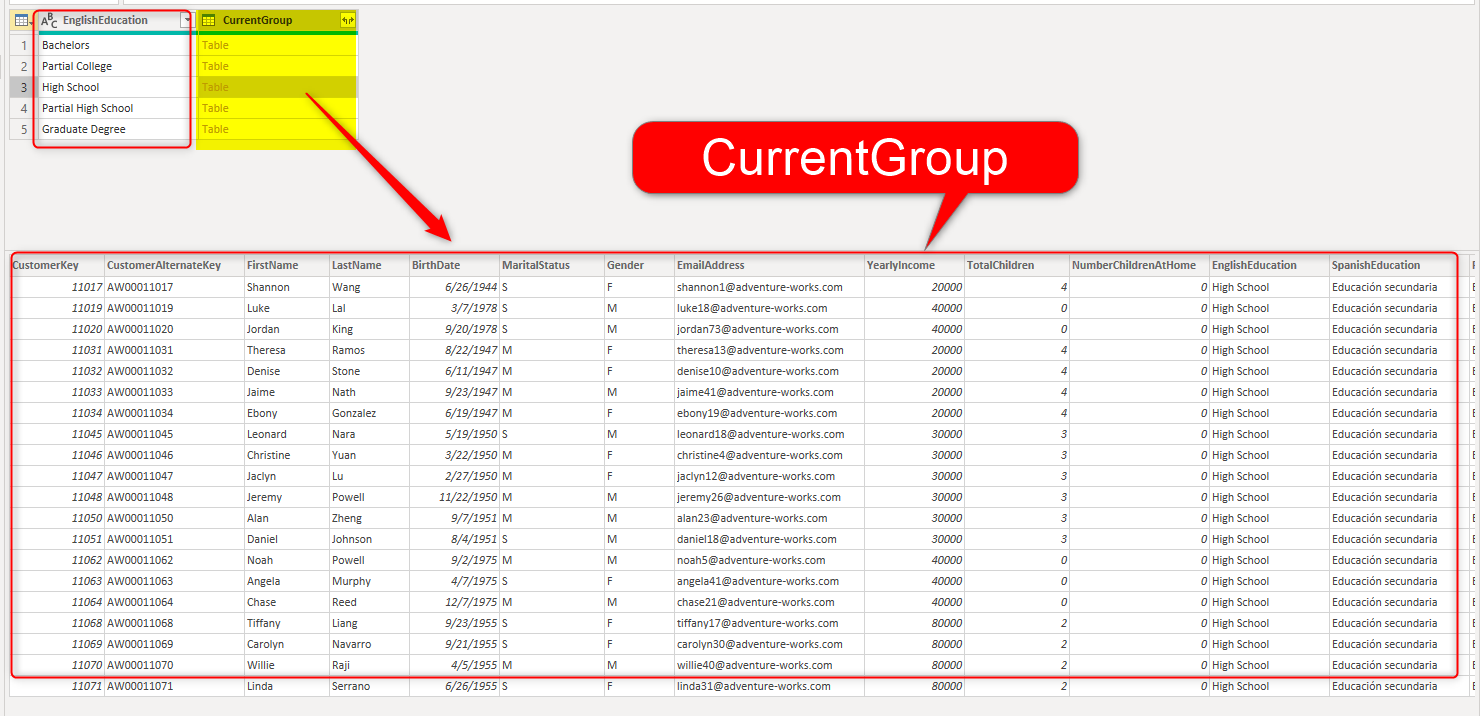
CurrentGroup is a DAX function that comes with the usage of GROUPBY. CurrentGroup means the subset of the main table, which can be used for any aggregation. I used the below sample to show you what the CurrentGroup looks like. However, you cannot see that visually, this happens behind the scene.
The screenshot above is creating using Power Query Editor. I used it to show you what the Current Group looks like, so don’t look for such a visual way of looking at CurrentGroup in DAX. As you see in the screenshot above, the CurrentGroup, when our filter context is High School, is the sub-table of DimCustomer with all of the columns, but filtered only for High School.
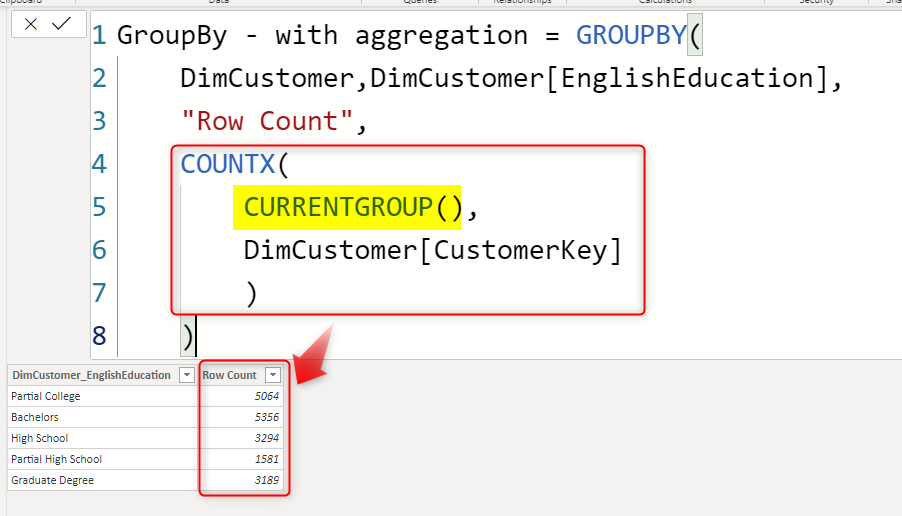
Now, using CurrenGroup, you can write the expression as below;
GroupBy - with aggregation = GROUPBY(
    DimCustomer,DimCustomer[EnglishEducation],
    'Row Count',
    COUNTX(
        CURRENTGROUP(),
        DimCustomer[CustomerKey]
        )
    )
The CountX expression is counting rows from the CurrentGroup function.
The CurrentGroup can be used in other iterator functions such as SUMX, AverageX etc.
Some Restrictions of GroupBy
You cannot use a Calculate function in the expression section of GroupBy.
Any aggregation should be done using the CurrentGroup function.
Table can be an expression too
When you are using the GroupBy (and many other functions) you can use a real dataset table as the input, your can use another function that produces a table (table expression). the below example, shows a scenario what we create a column in the DimCustomer table for the Revenue first, and then use that for grouping in the next step;
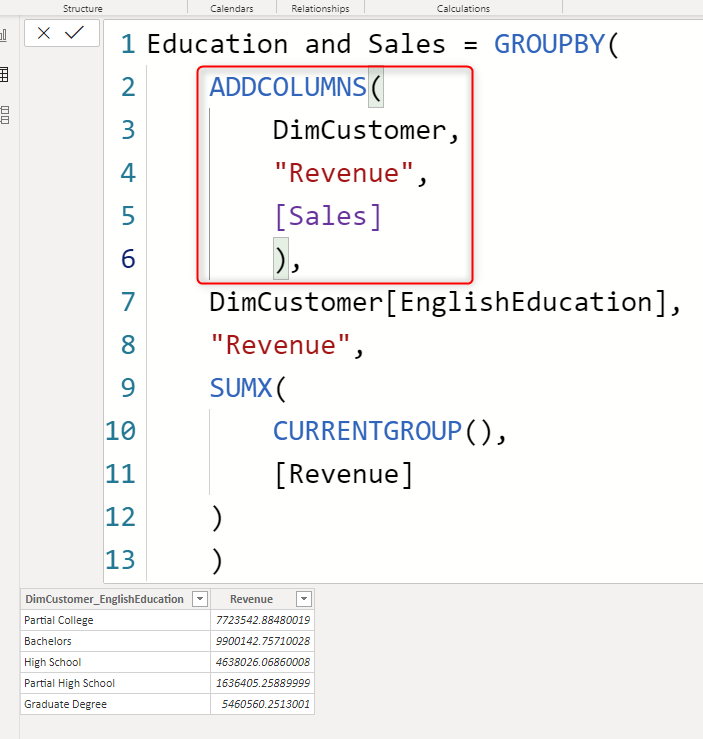
Sales in the above expression is a measure with the expression of Sum(FactInternetSales[SalesAmount]).
Remember the Power of Virtual Tables
If you just want to use GroupBy to create an aggregated calculated table in Power BI, Although you can do it, however, there might be a better way to do it; using GroupBy in Power Query, or in the data source. The main power of using GROUPBY or other DAX grouping functions is the ability to use them as a virtual table, which is an aggregated table created on the fly inside a measure definition. Using a virtual table, makes your DAX measure even more powerful, however, you need to be aware that with the power comes other costs too, sometimes virtual tables, might cause performance impact.
Download Sample Power BI File
Download the sample Power BI report here:
Video


Reza is author of more than 14 books on Microsoft Business Intelligence, most of these books are published under Power BI category. Among these are books such as Power BI DAX Simplified, Pro Power BI Architecture, Power BI from Rookie to Rock Star, Power Query books series, Row-Level Security in Power BI and etc.
He is an International Speaker in Microsoft Ignite, Microsoft Business Applications Summit, Data Insight Summit, PASS Summit, SQL Saturday and SQL user groups. And He is a Microsoft Certified Trainer.
Reza’s passion is to help you find the best data solution, he is Data enthusiast.
His articles on different aspects of technologies, especially on MS BI, can be found on his blog: https://radacad.com/blog.