
In the last post, the process of using Cognitive services Text analytics has been presented.
In this post, I will show how to user pre-built AI using some predefined machine learning algorithms in Power BI Service in Data flow.
I will follow the same example I show in the Azure ML Studio and Power PI post.
To access the data follow the below link
Prediction Scenario

The Titanic disaster, just 30% o people survived, the evacuation was based on the age, passenger class and first for female and then male.
In the above dataset, we have a sample of the passengers in the ship with all detailed information as you can see in below

Our aim is to predict a person will survive or not based on age, gender, passenger class.
so the prediction column is: Survive
the columns that we think it will have impacts on Survive column: Age, Gender, and Passenger class
Data Flow in Power BI service
Data flow in Power BI has been explained in Post by Reza Rad and also in the last post.
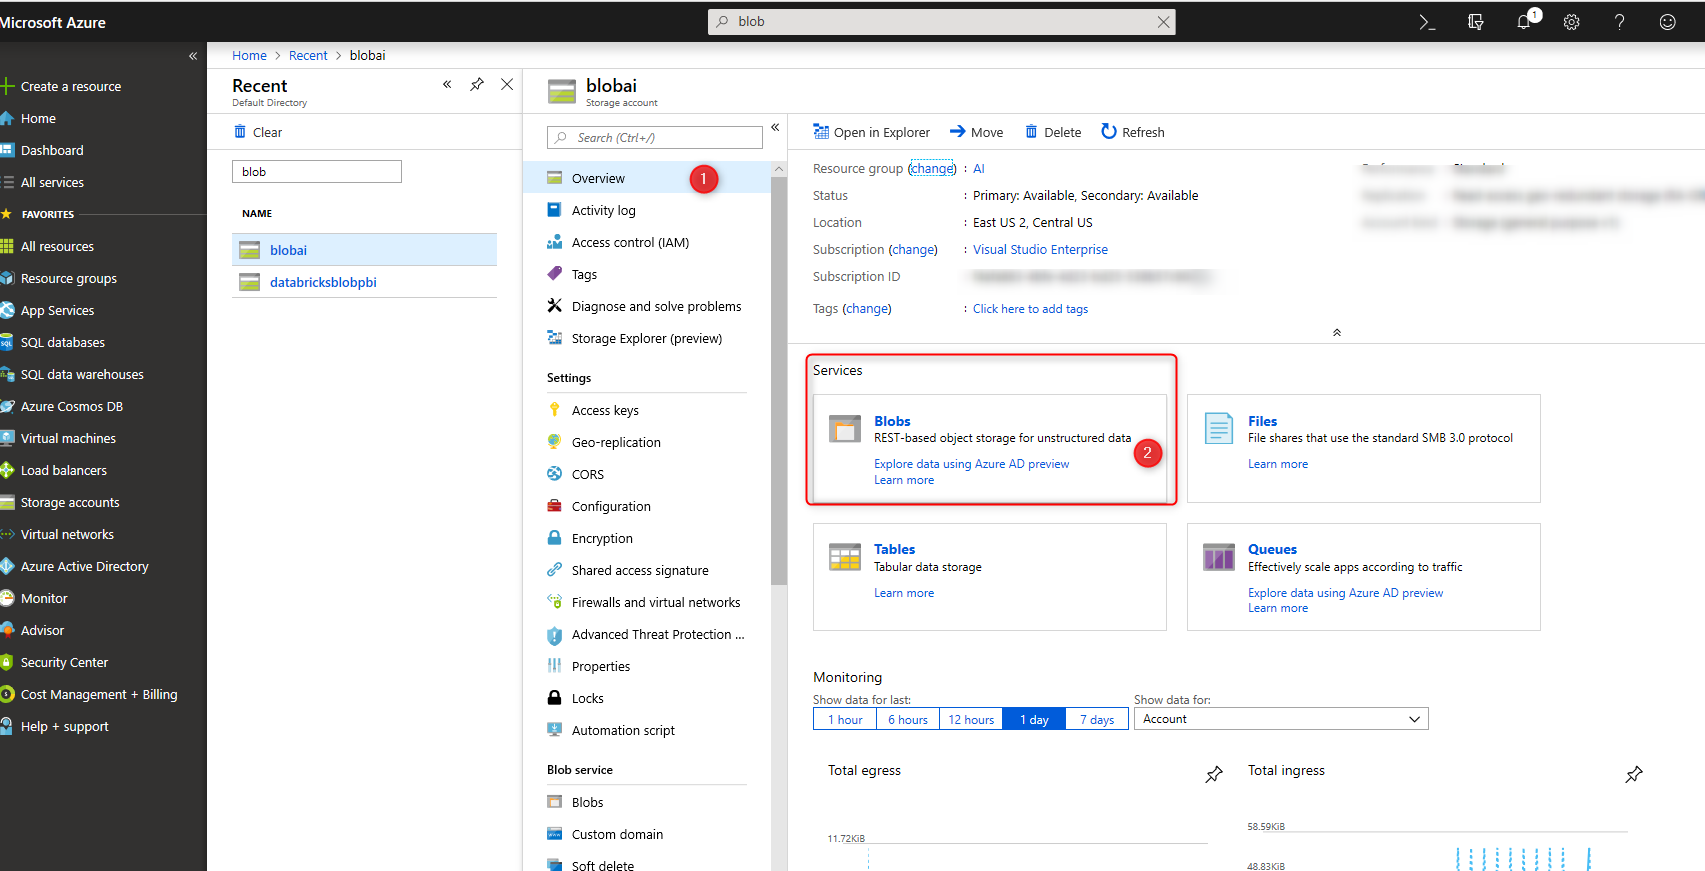
I will upload this data to my Blob storage in Azure.
Some important note
Power BI AI features ( in this post and last one and next one) are just available for Power BI premium capacity and will be available for the public from March 2019
if you do not access to premium or you want to use cognitive service now follow below links
Azure Machine Learning in Power BI Cognitive Service in Power BI


However, from the perspective of a business user and someone who does not want to write code in Power Query and R
below scenario can be really easy to use, without writing any codes!
Step one: Access Data
The data has been stored in the blob storage account.
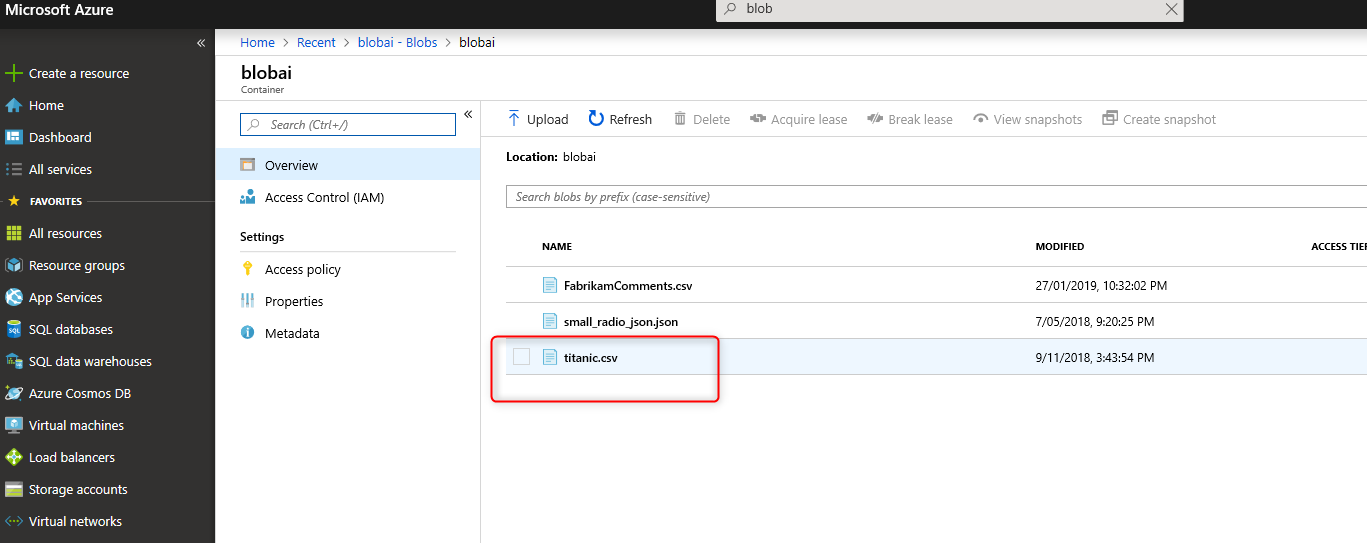
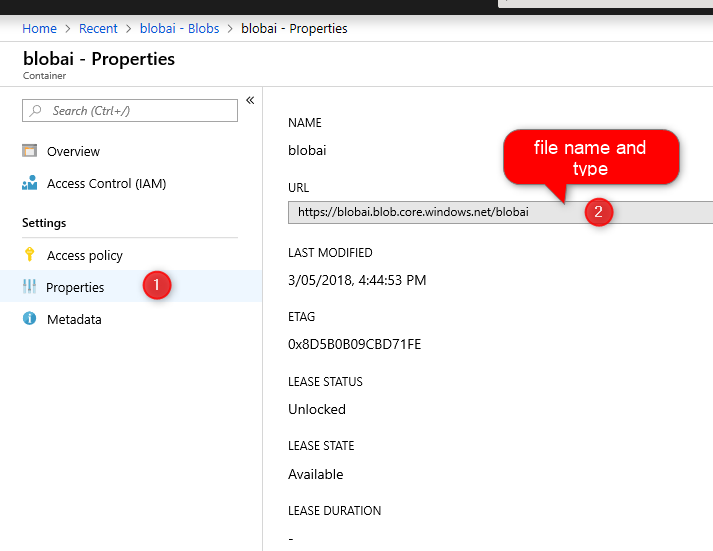
I just copy the link in Blob storage
In the next step, log in to Power BI service (Premium capacity). Then click on the Workspace, then click on the Dataflow and create a new Dataflow.
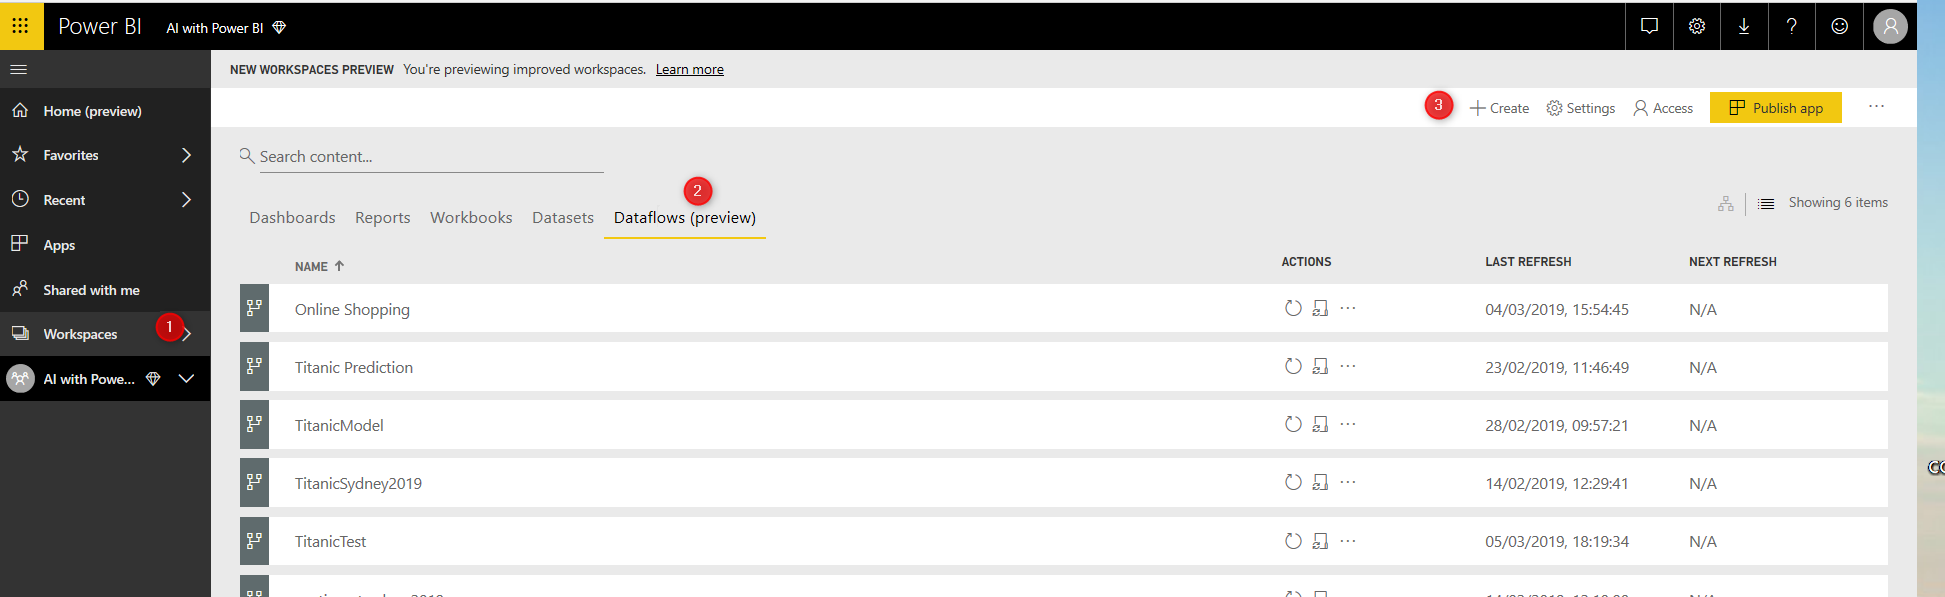
Then click on the Add New Entities.
In the Choose data source, as you can see in the below picture, there is multiple data source such as MySQL database, Azure Table, and so forth. Choose the text/CSV

paste the URL, in the file path and URL.
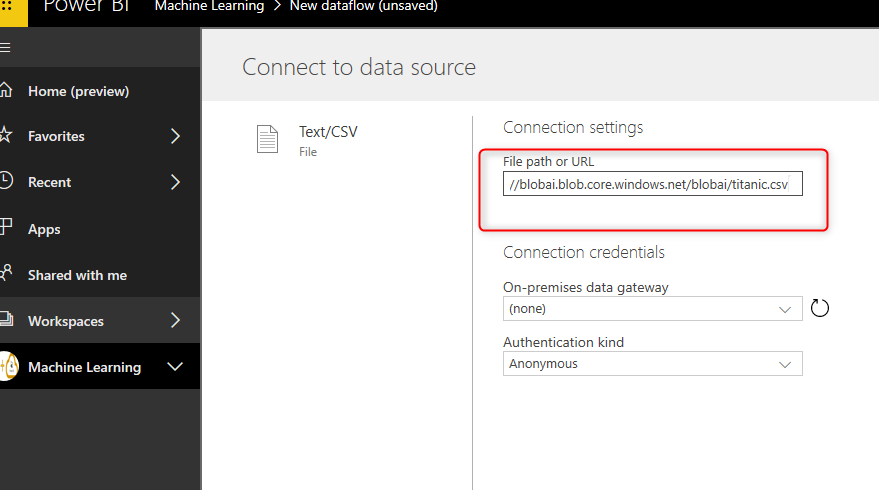
you can access the data from other resources from Azure SQL or other resources.
Import the data, when importing the data, as you can see in the below picture, the columns do not have headers.
Step Two: Clean Data in Data Flow

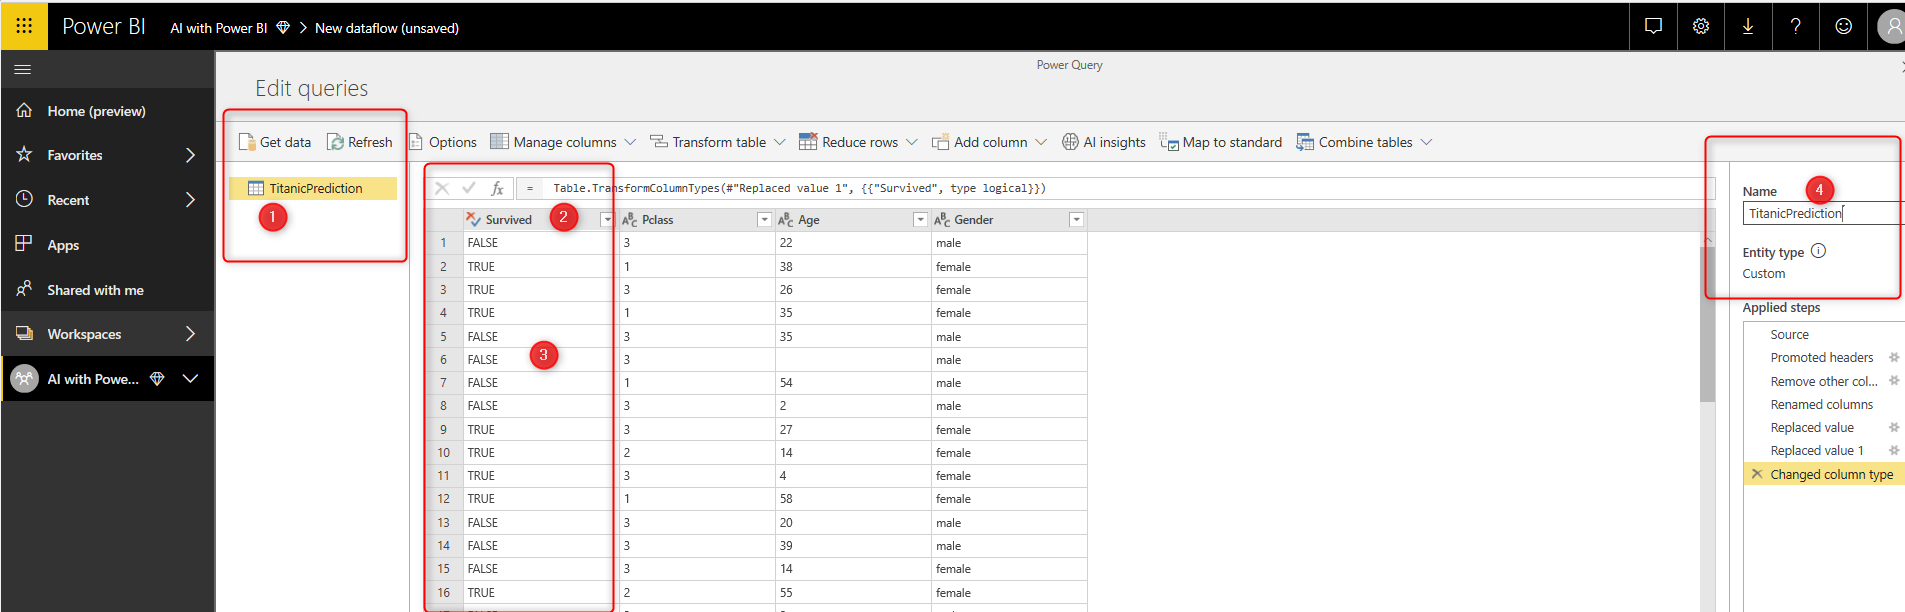
Click on the transform table and Use First Row as Header. The choose the age, sex, Pclass , and survive, right click and choose Remove Other Columns.

Then change the name “sex” to “gender”, in the next step, right click on the column, and choose the Replace, you need to replace the 0 to False and then 1 to true. Also, change the type to False and True.
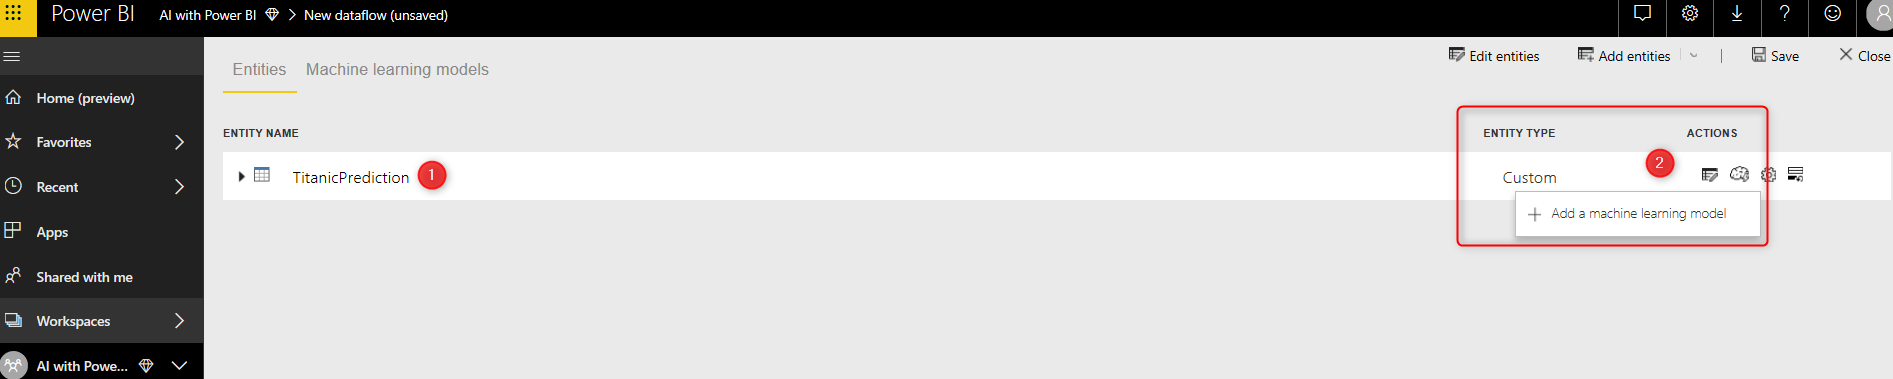
In the next step, change the Name to “TitanicPrediction”. Then click on the Done at the bottom of the page.
Then, Under the Action, choose the Apply AI Model.
Step Three: Access Auto Machine Learning
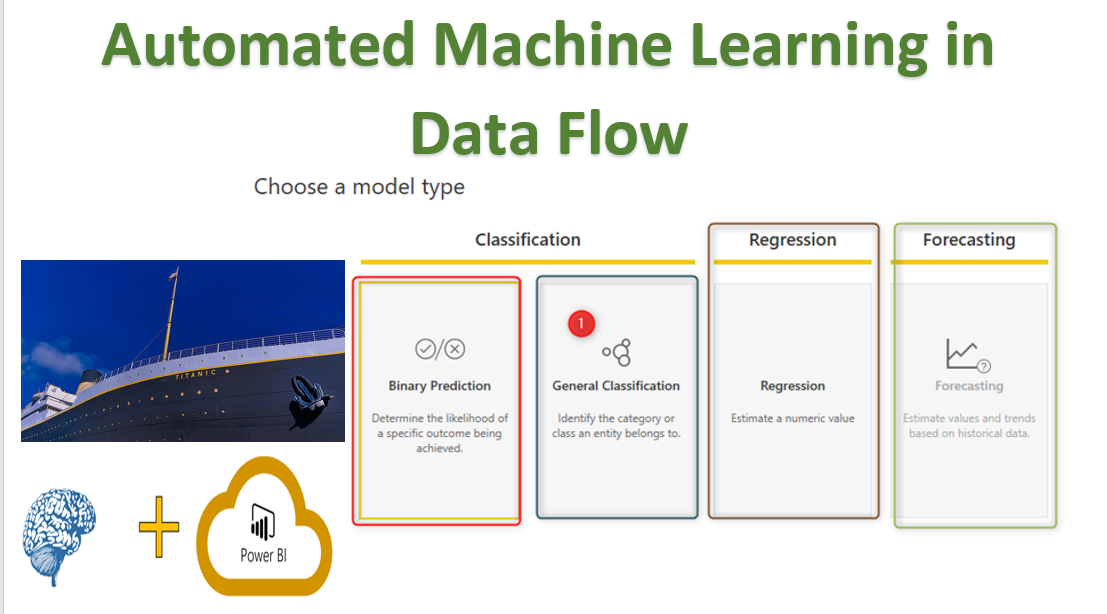
Next, choose the model type:
we have Classification, Binary Prediction, Regression, and Forecasting.
to learn more about each term click here
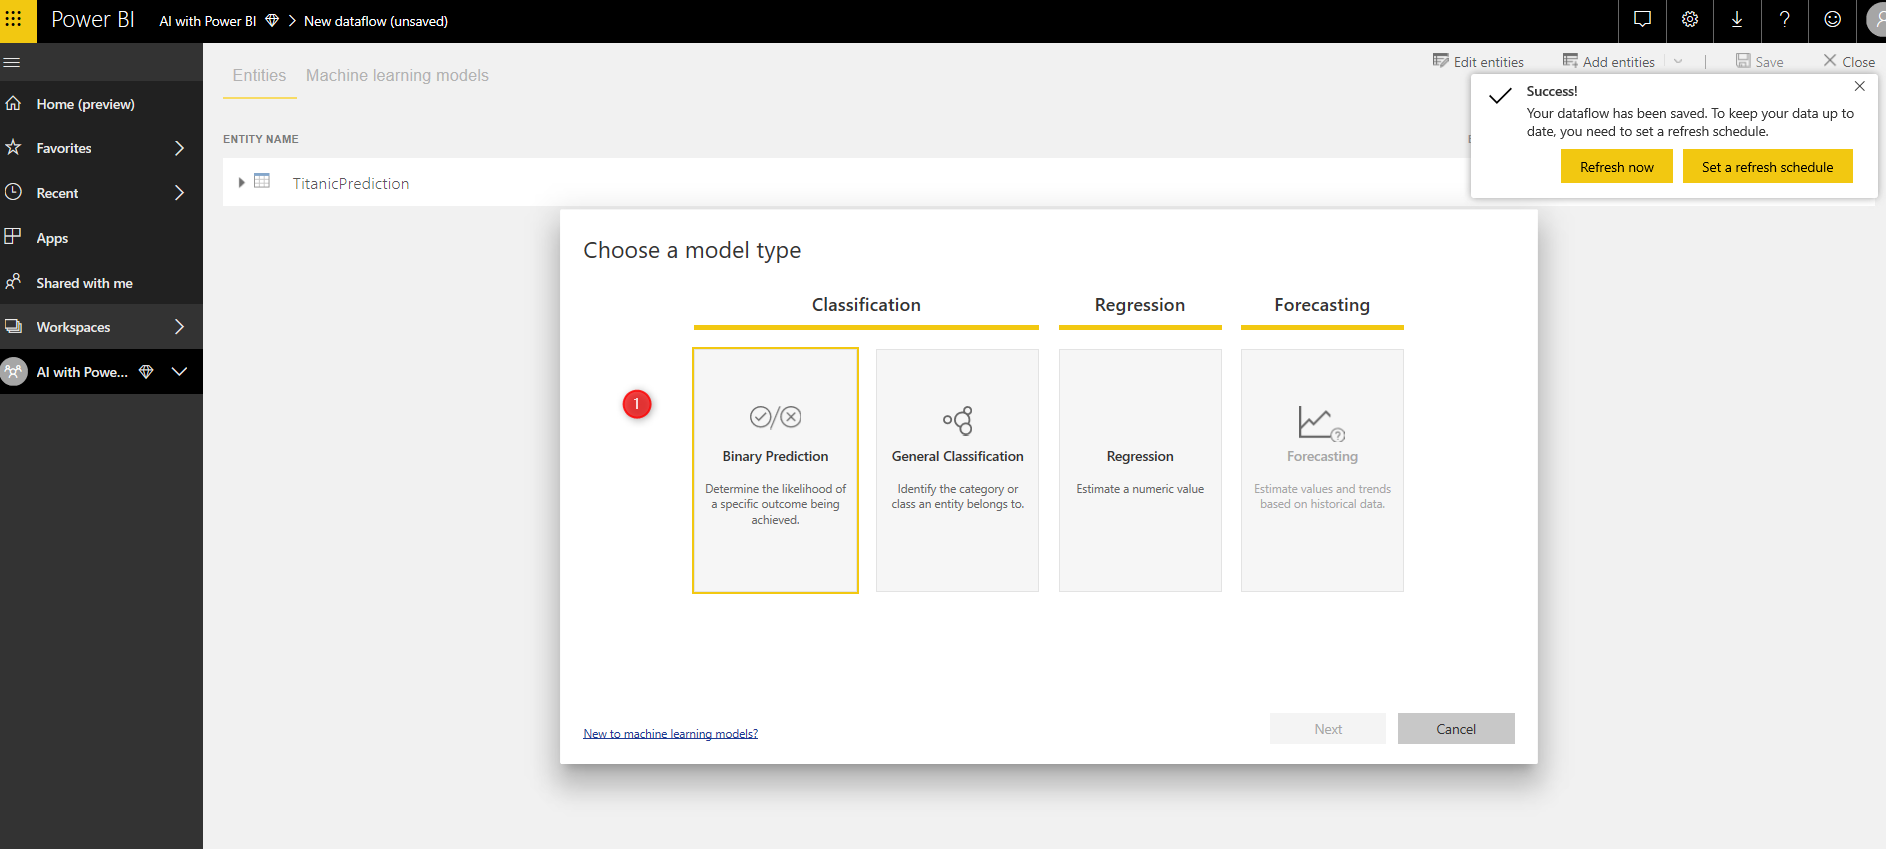
Choose the Binary Prediction ( we change the data type to False and True). In the new page, you able to see the Name of the model and the column prediction name Survived.
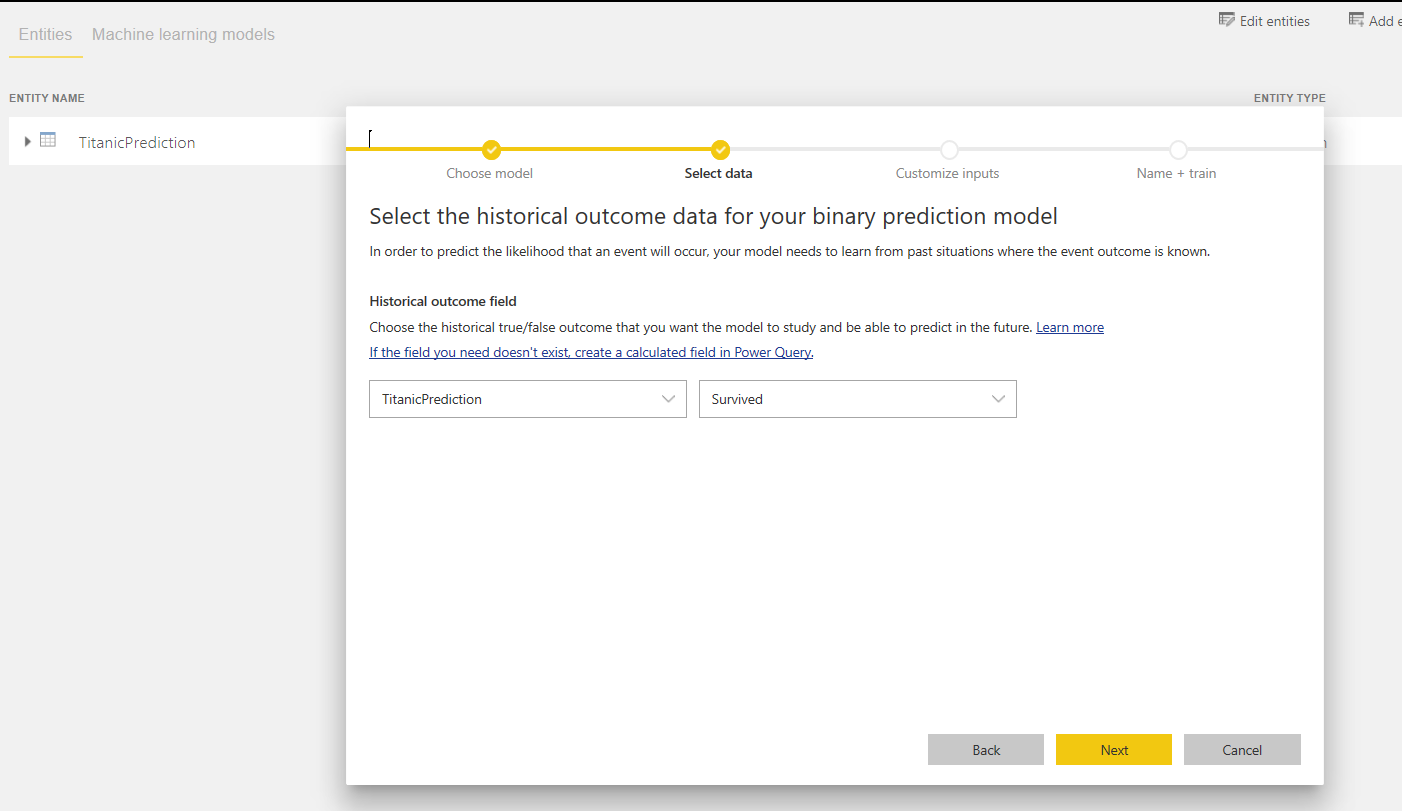
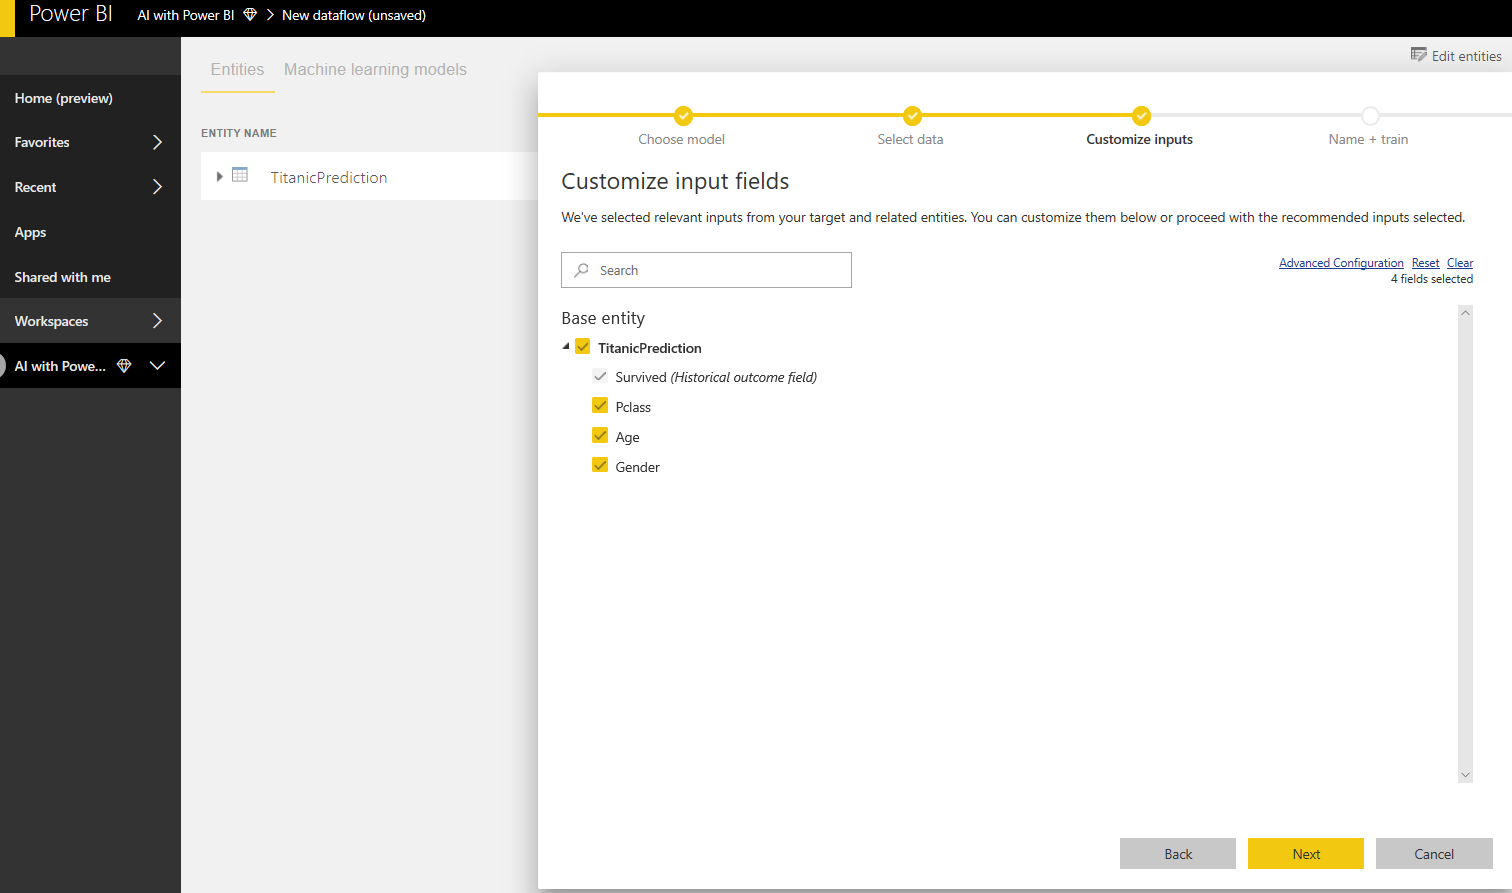
Next, the related columns need to be selected.
In the next step, we need to provide the name Survive and NotSurvive.

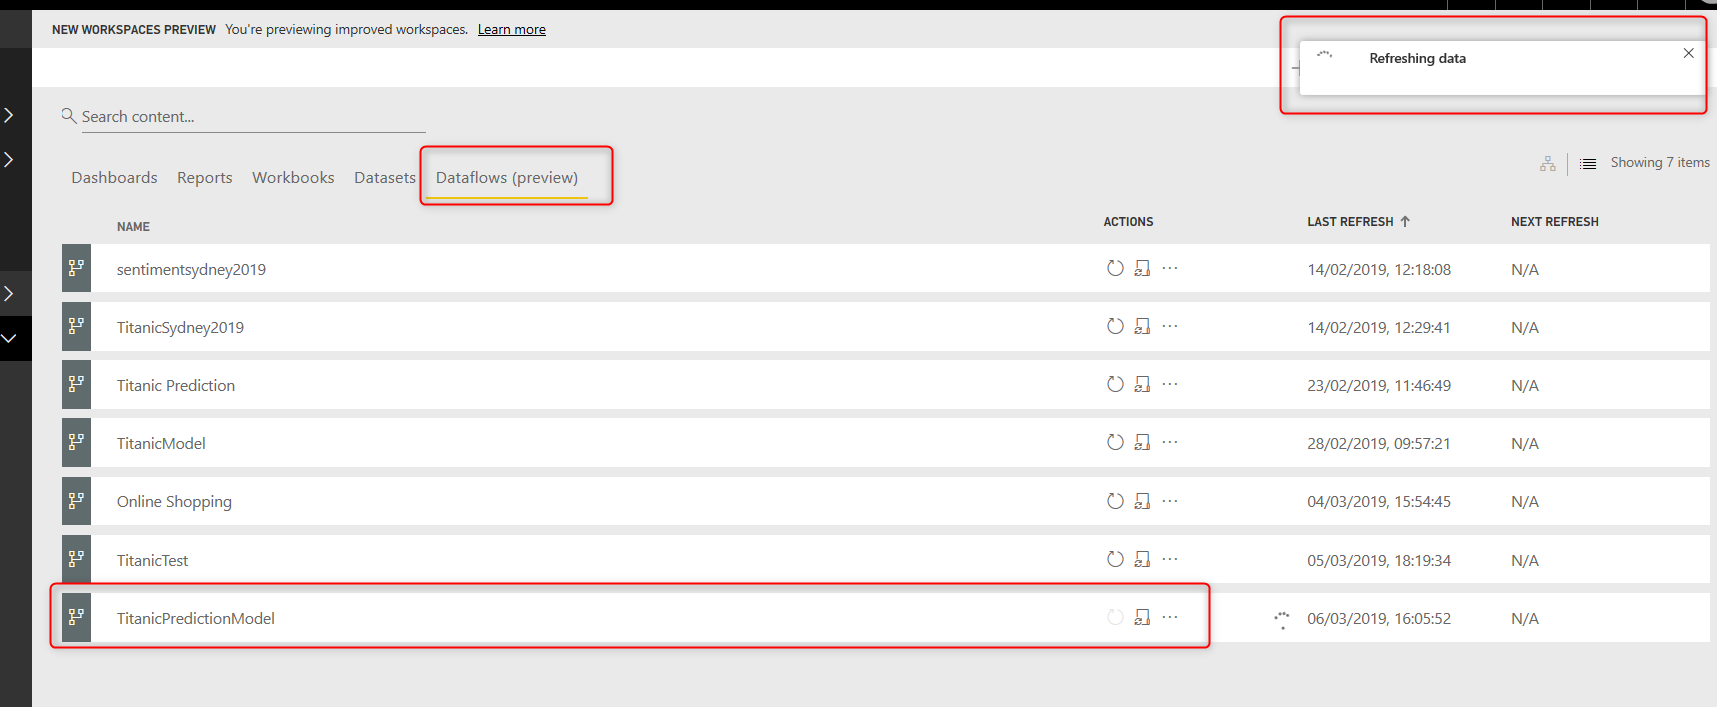
Then save and refresh the Dataflow.
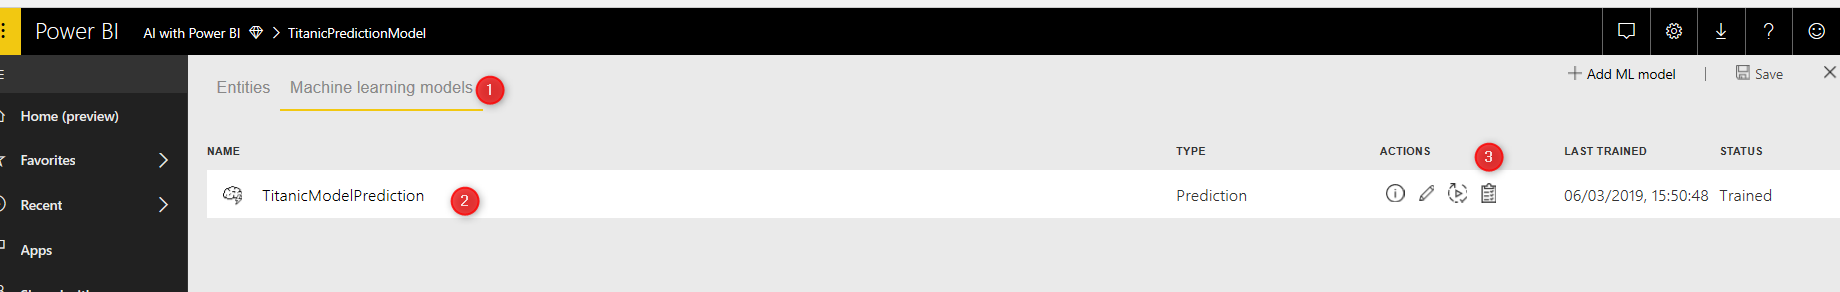
Then click on the edit bottom, then DataFlow, then clicks on the Machine Learning Models. under the page, you able to see the TitanicModelPrediction, and then click on the last icon that is Performance.
In the Power BI Service, you able to see the model performance detail, thre are three different performance detail page such as Model Performance, Accuracy Report, and Technical Detail.

Step Four: Apply Mode on Data and check in Power BI Desktop
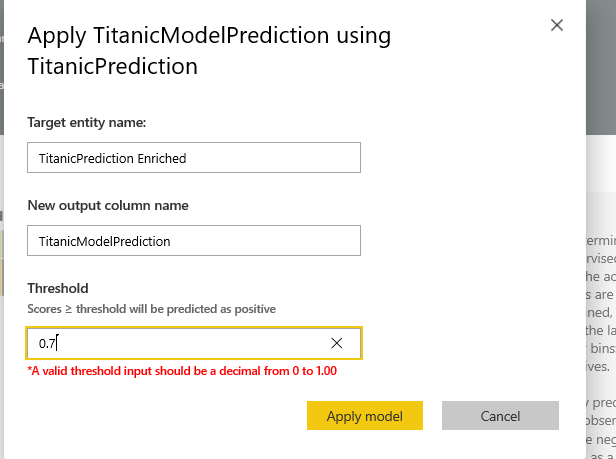
Now, we able to apply the model in test data, then retrieve the result in Power BI desktop. Click on the Apply Model.
Click to apply the model and change the Thershold to 0.7.
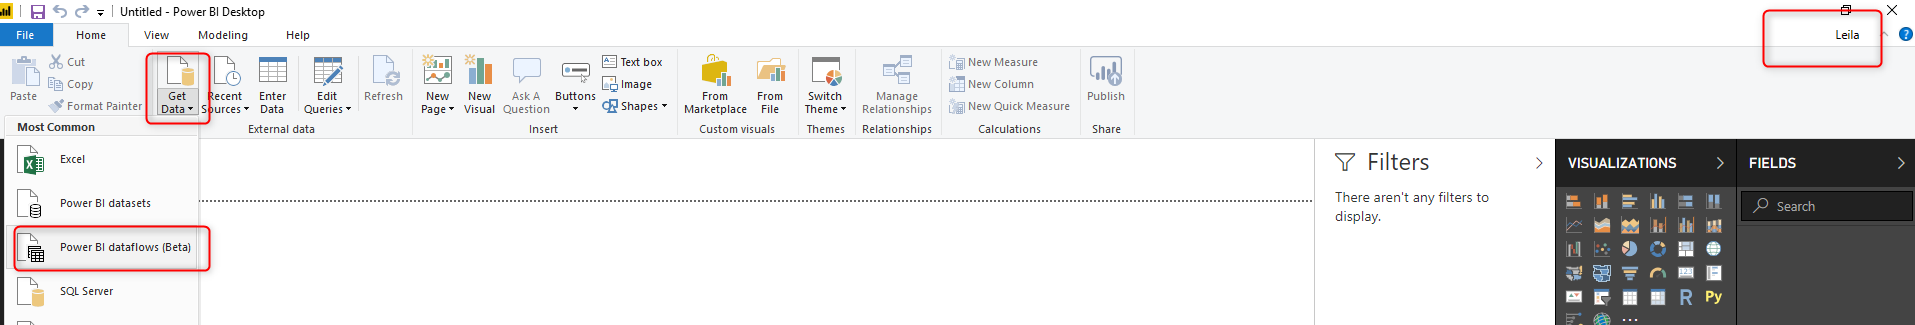
To see the data and prediction result in Power BI desktop, first open it then sign into premium account, click on the get data and choose the Data flow connector.
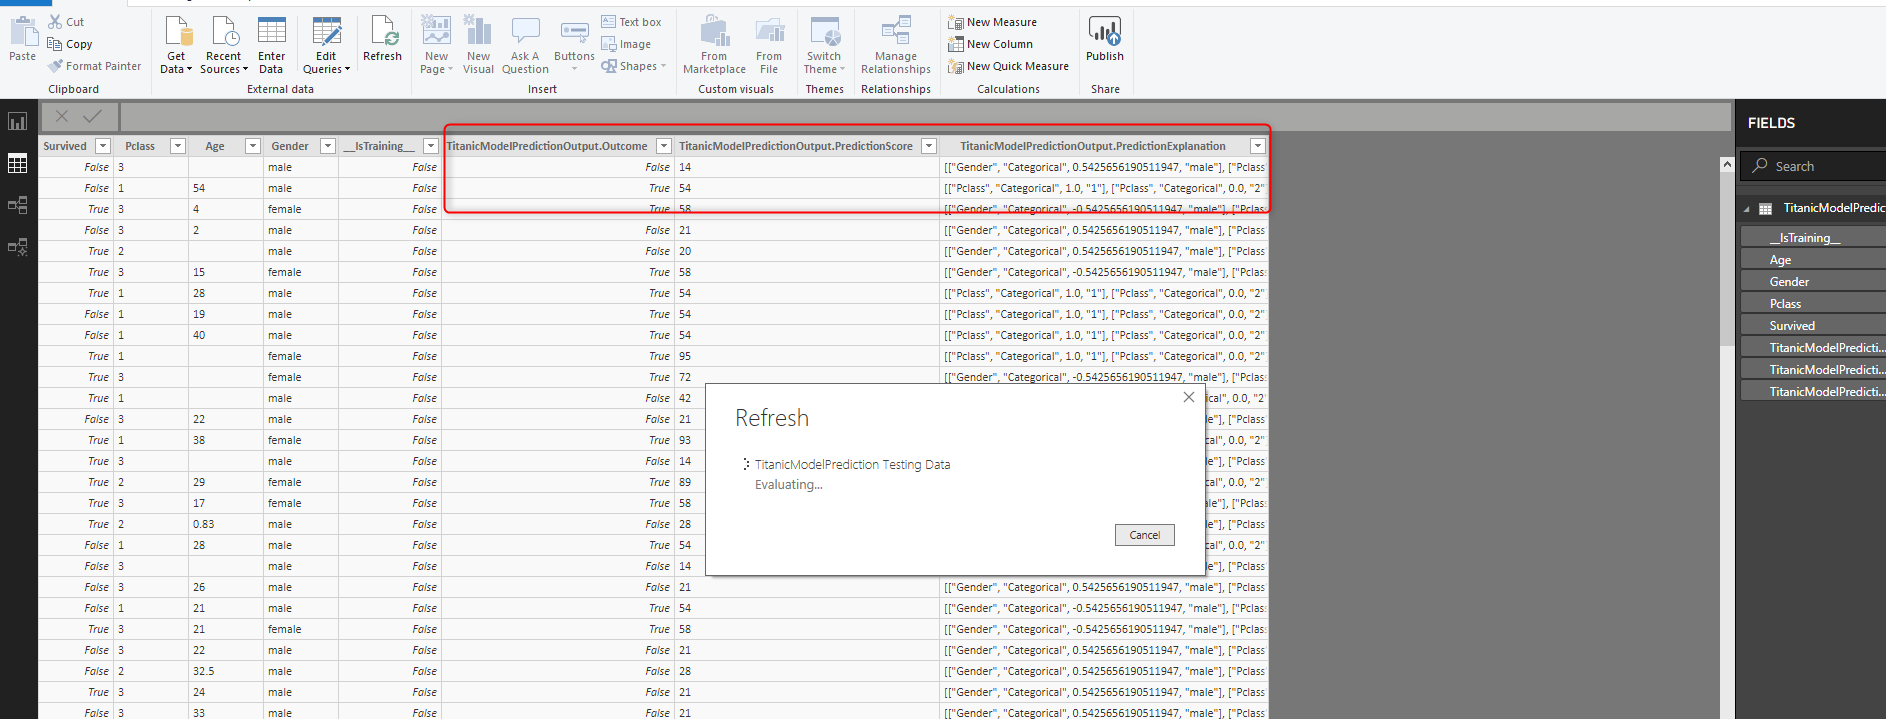
Then , you able to see all data flow you have , choose the related data flow and the prediction results

Then load it into Power BI desktop to see the result. Sometime you need to refresh the dataset to see the results.
There is a possibility to use other dataset for applying the model.


