

The Microsoft Business Applications Summit 2021 happened recently, just a couple of weeks after the Power BI Summit, and there were a bunch of exciting announcements and updates from the Power BI team. If you missed seeing them all in one place, this article and video are a nutshell of all of those in one place.
Microsoft Fast Track Recognized Solution Architect – Power Platform
First of all, I am honored to receive the Microsoft Fast Track Recognized Solution Architect award from Microsoft mentioned by James Philips in the keynote of Business Applications Summit 2021. Thank you all my blog readers who helped me being active and doing more.

Now let’s jump into the interesting stuff;
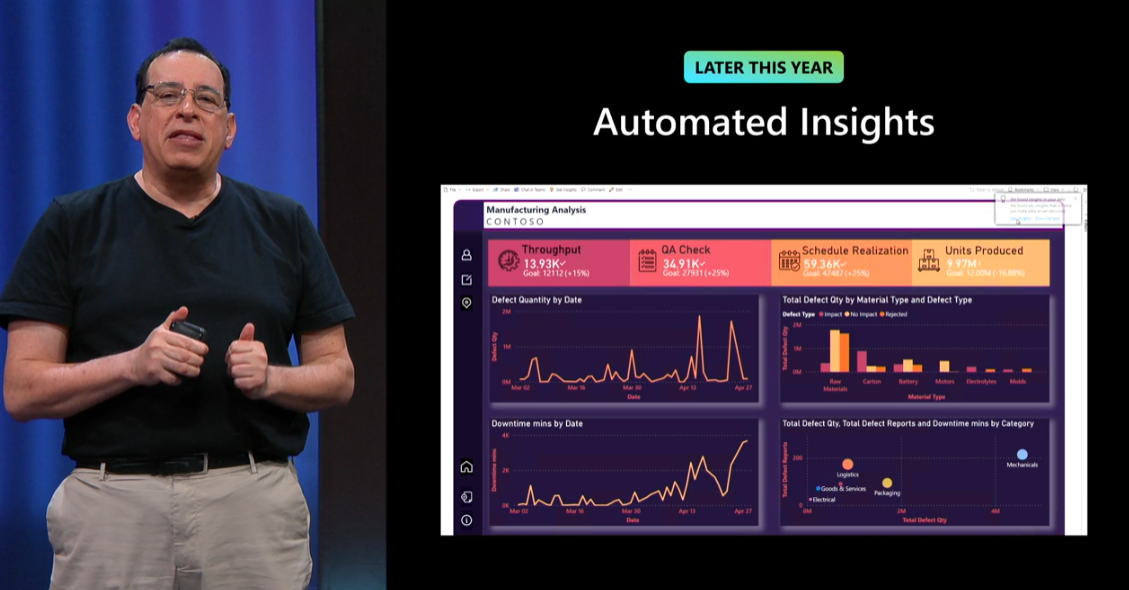
Automated Insights
Power BI is Combining AI functionalities into a single, and easy-to-use feature for end-users, named as Automated Insights.
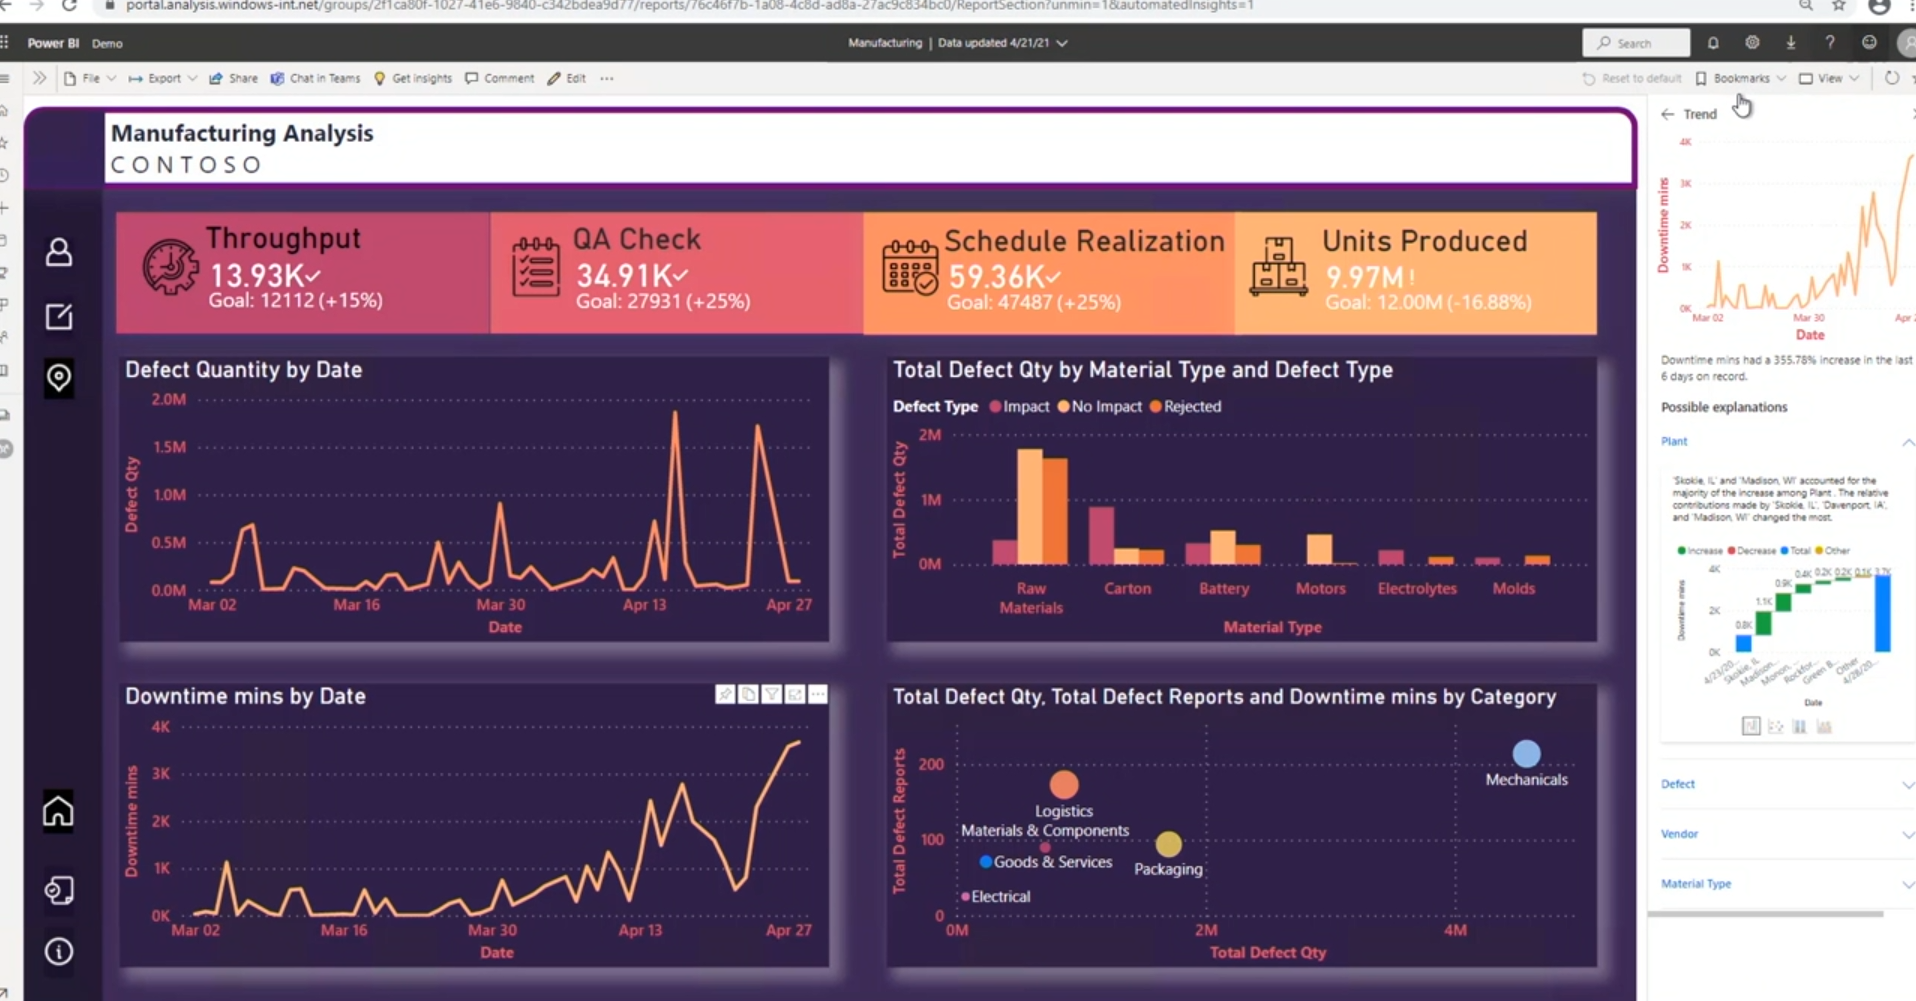
Automated Insights feature will be available later this year.
Power BI Integration with Power Automate
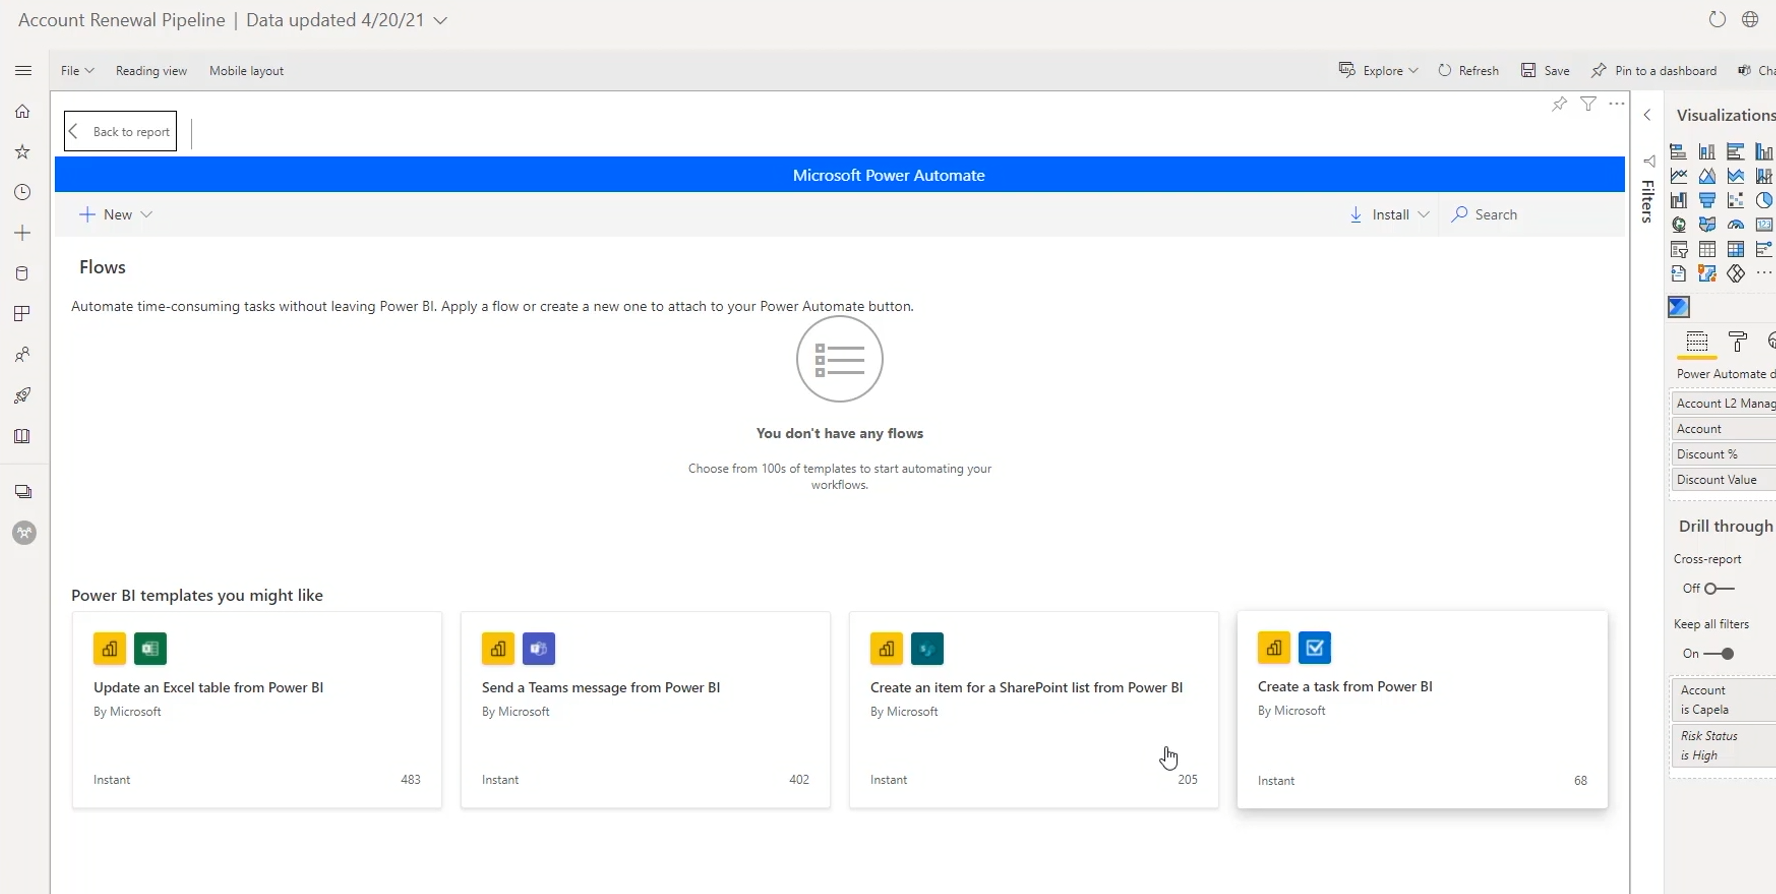
This feature is more than just a refresh of Power BI dataset. This is far more powerful. You can have a button in Power BI that triggers a flow in Power Automate, and then you can access Power BI data from there and do actions based on those. This is a massive feature that can be helpful in heaps of automation on data-related scenarios from Power BI.
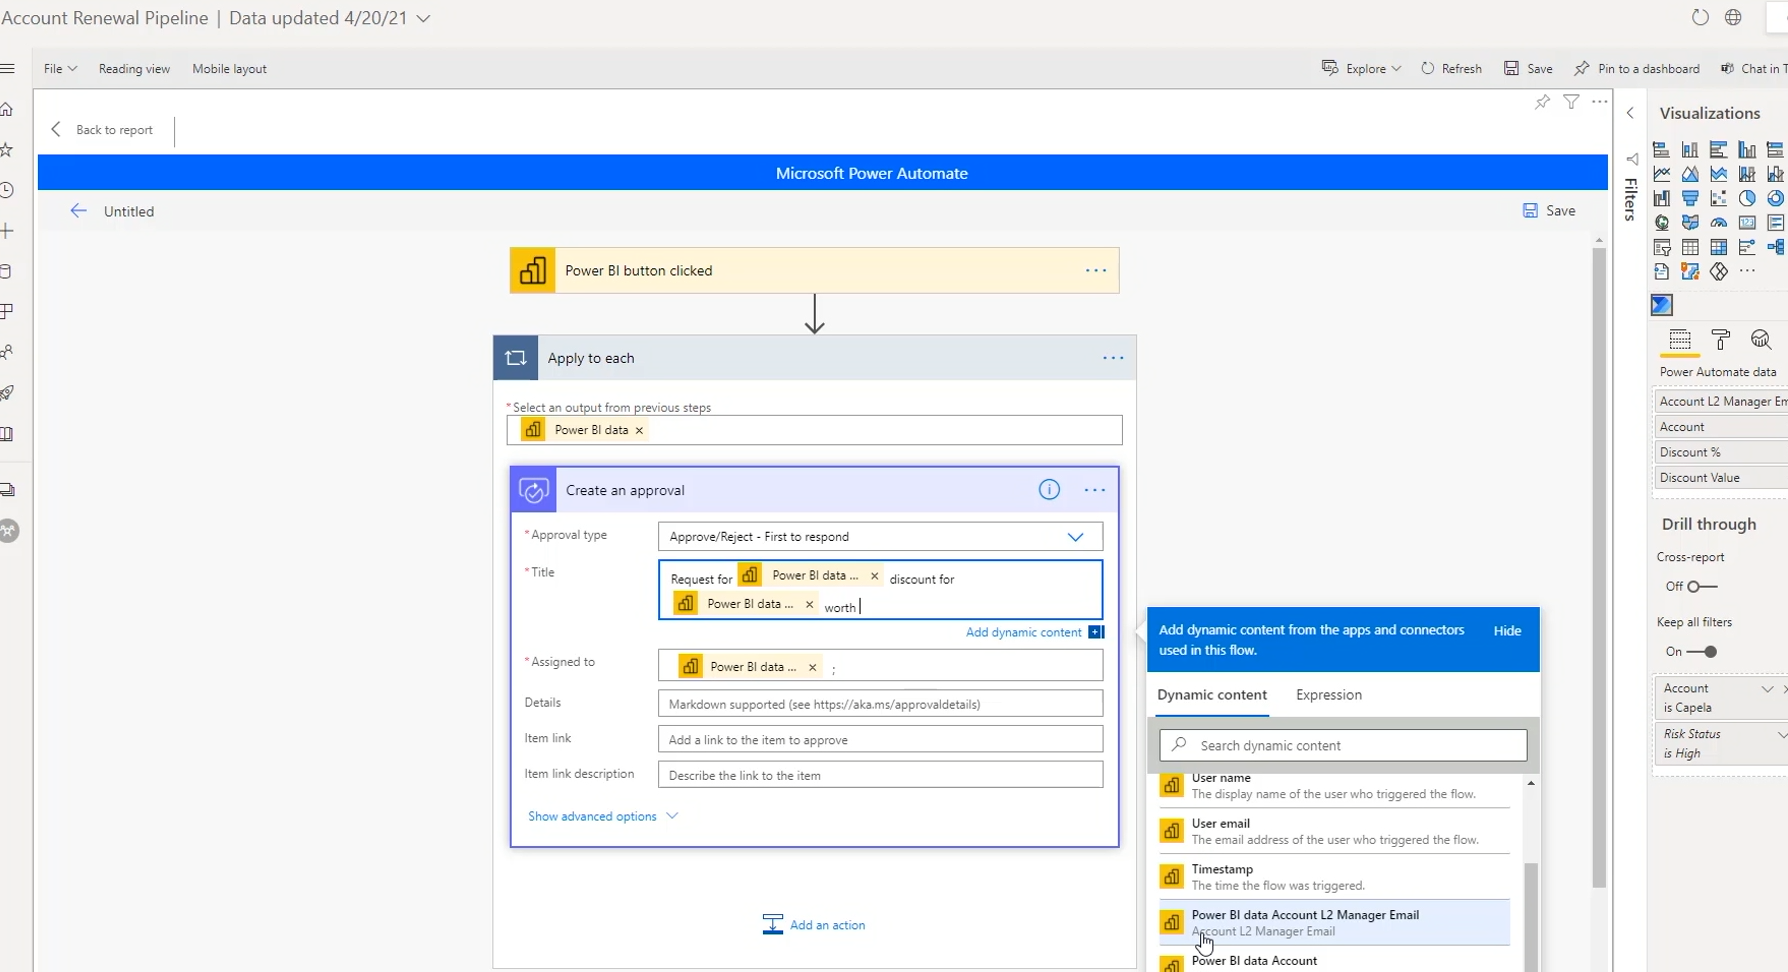
This fantastic feature is available right now, and you can use it.
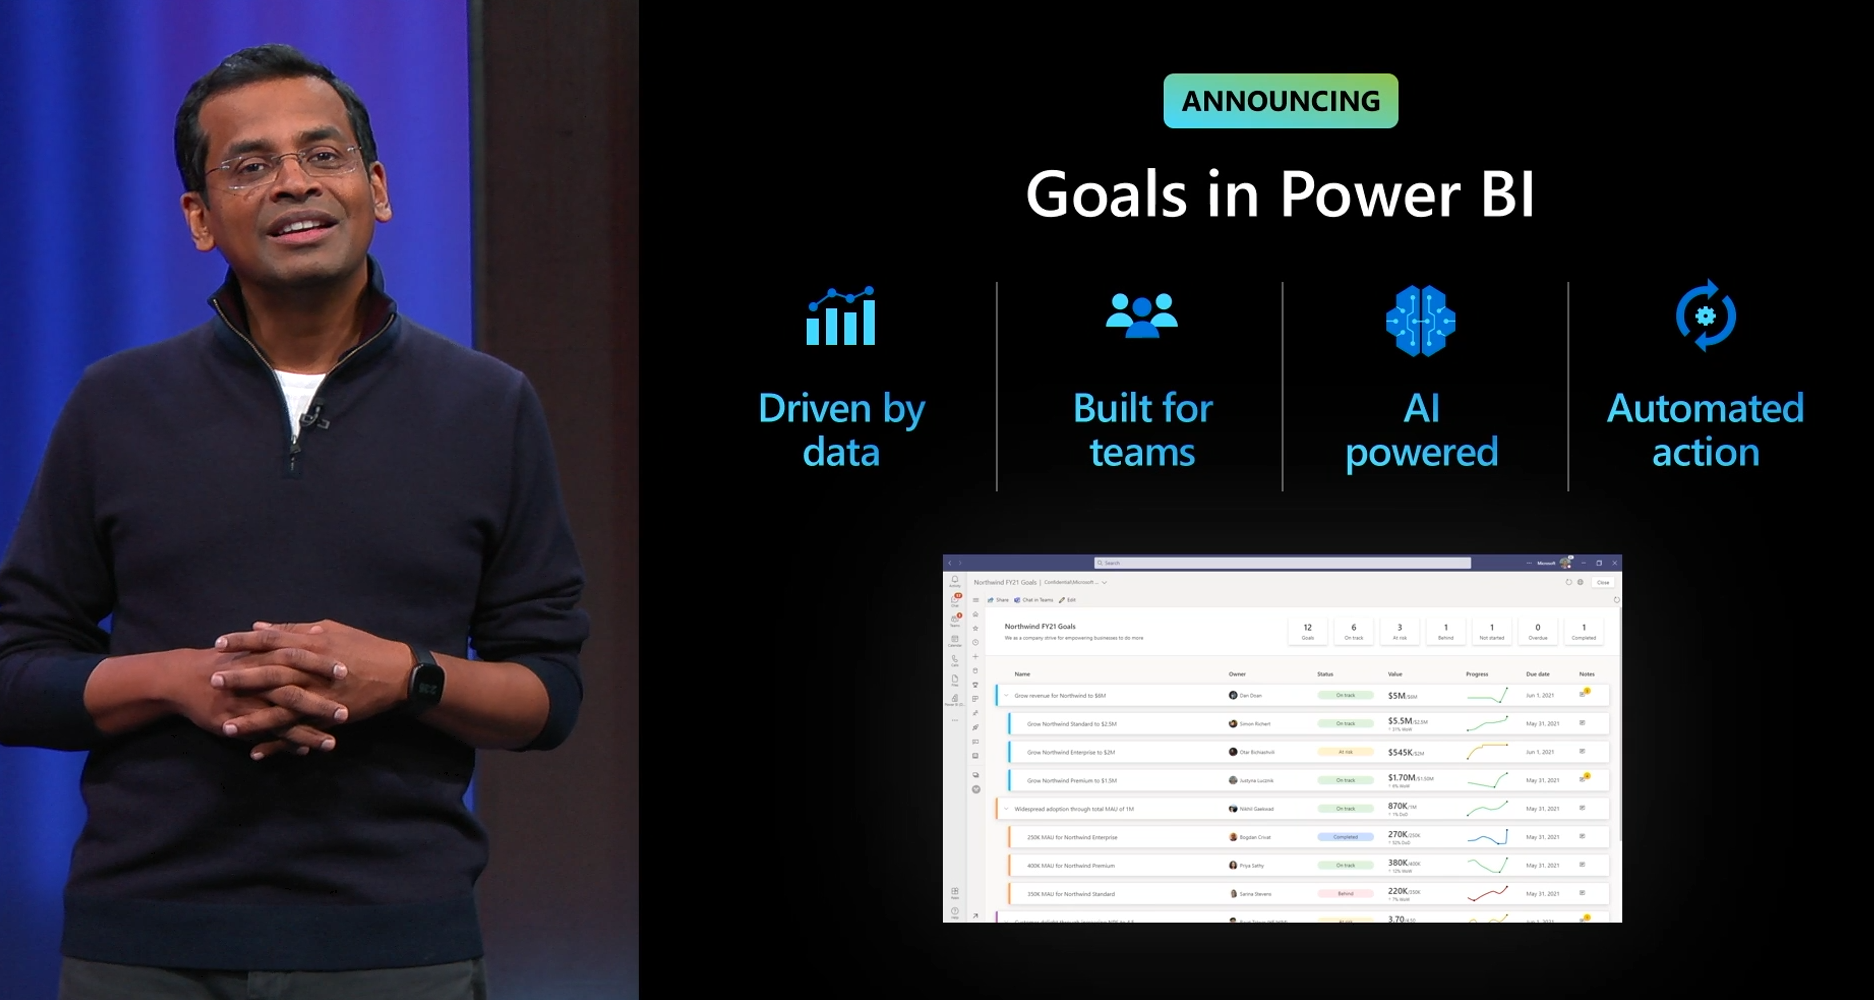
Goals in Power BI
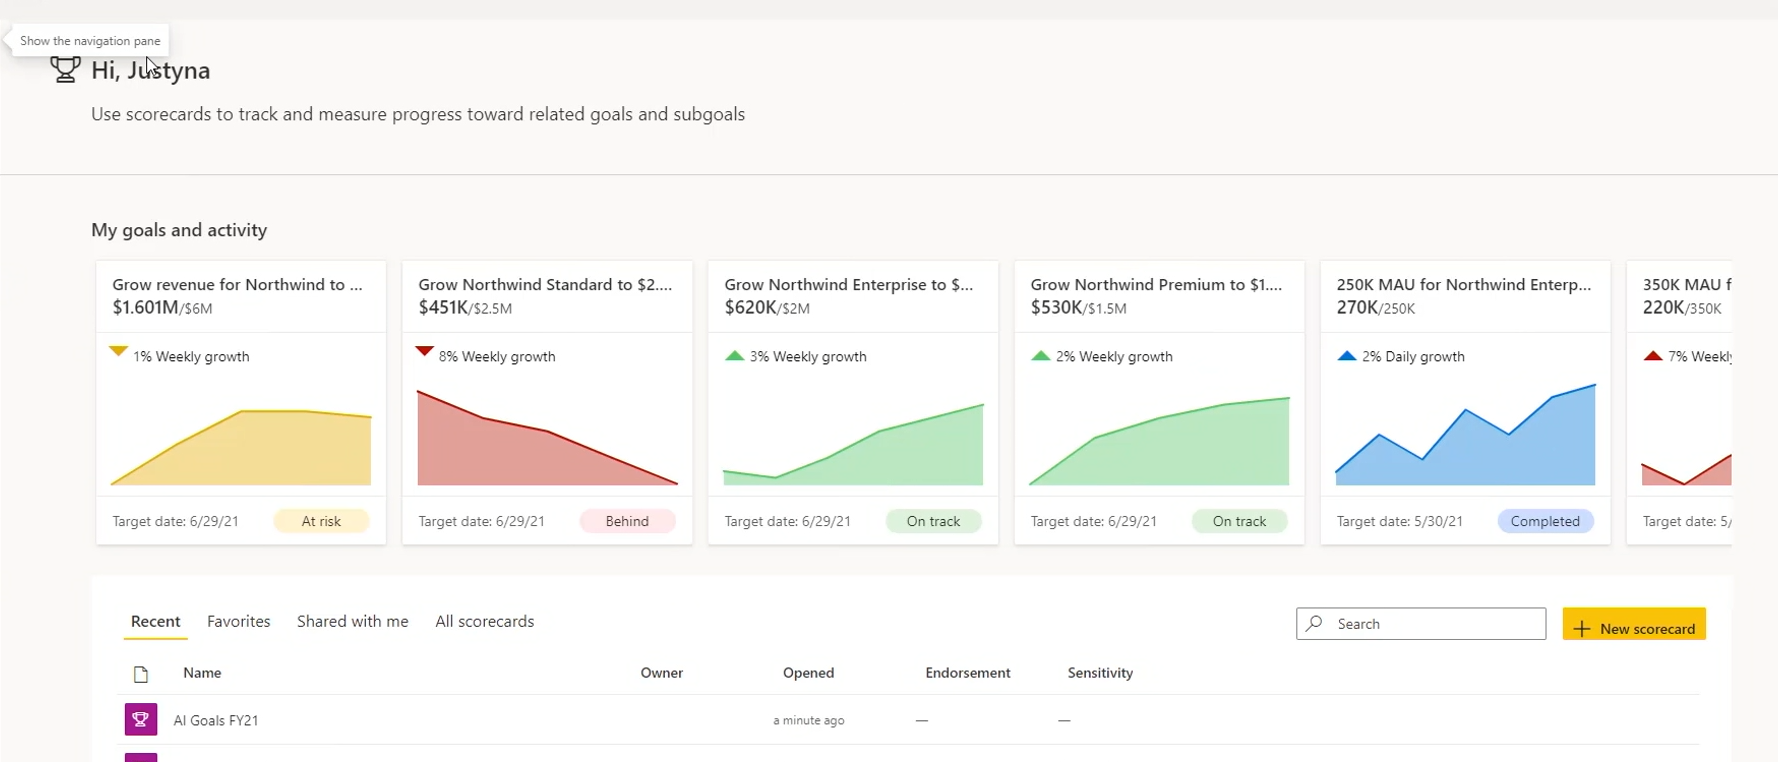
Goals in Power BI is a massive big feature that requires an article itself. Goals are new objects in the Power BI service that helps with data-driven analysis based on KPIs and scorecard.
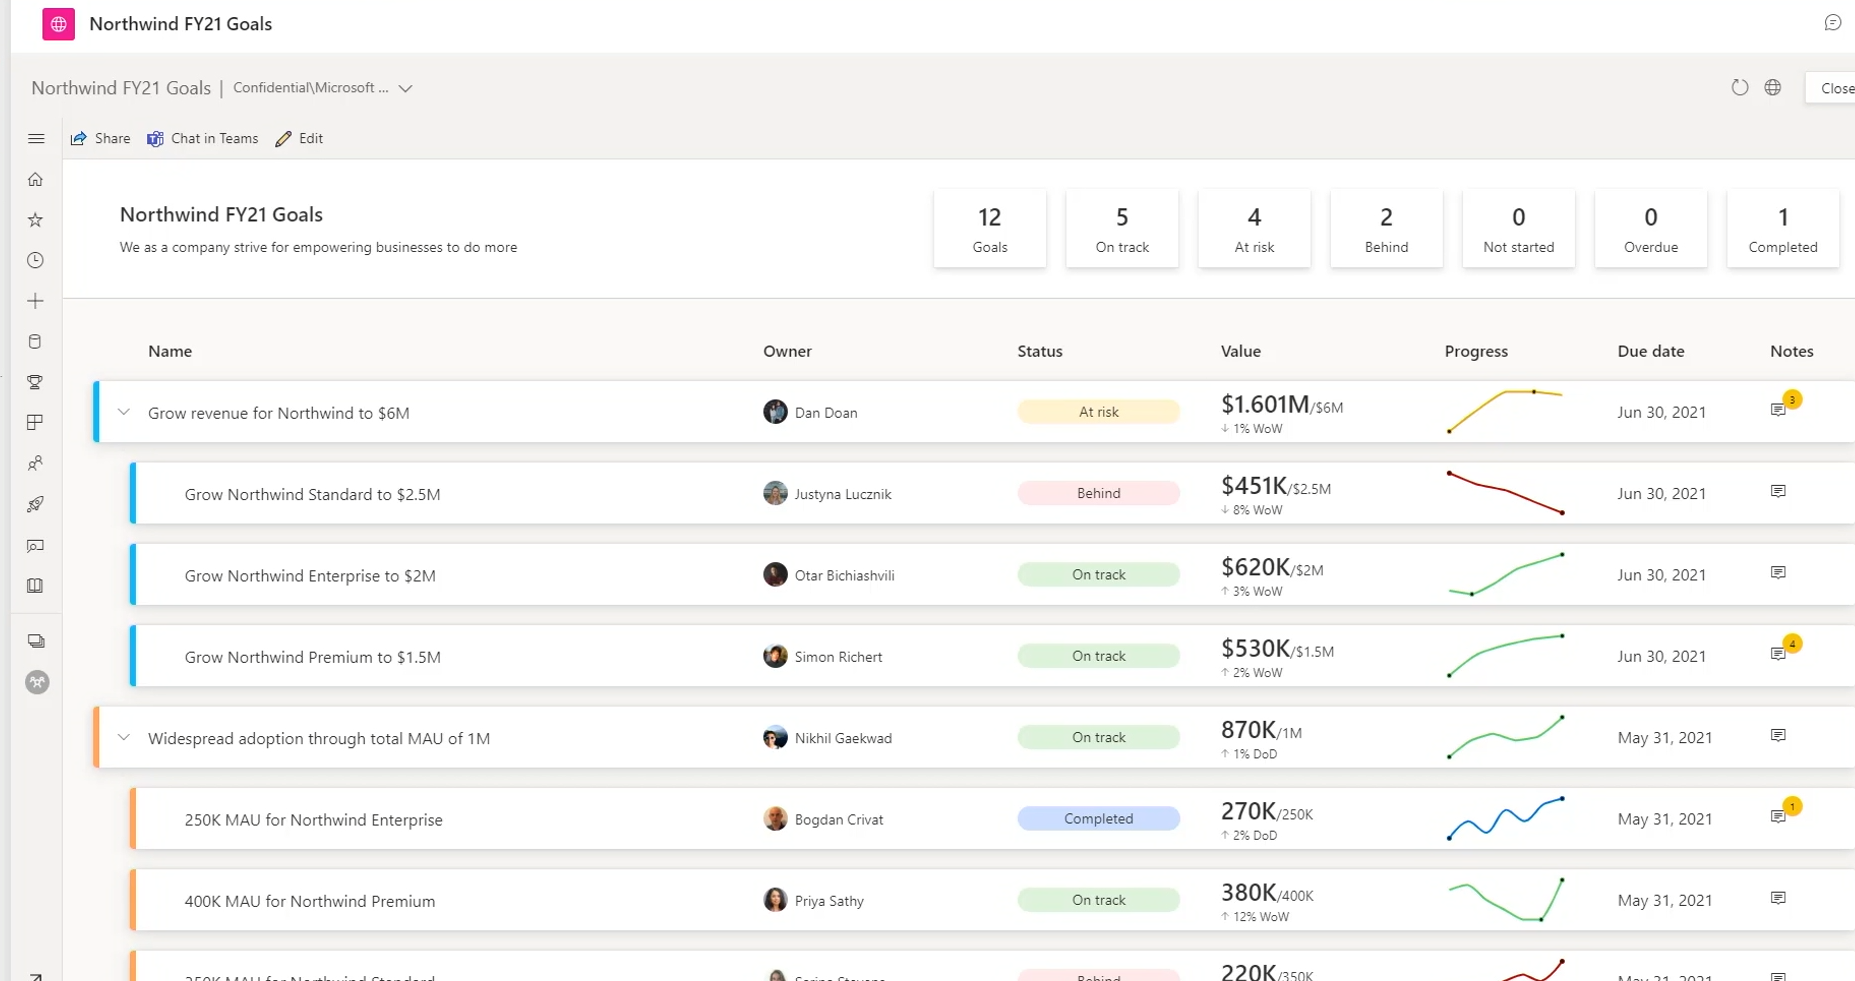
Goals can be defined such as KPI but with date criteria too.
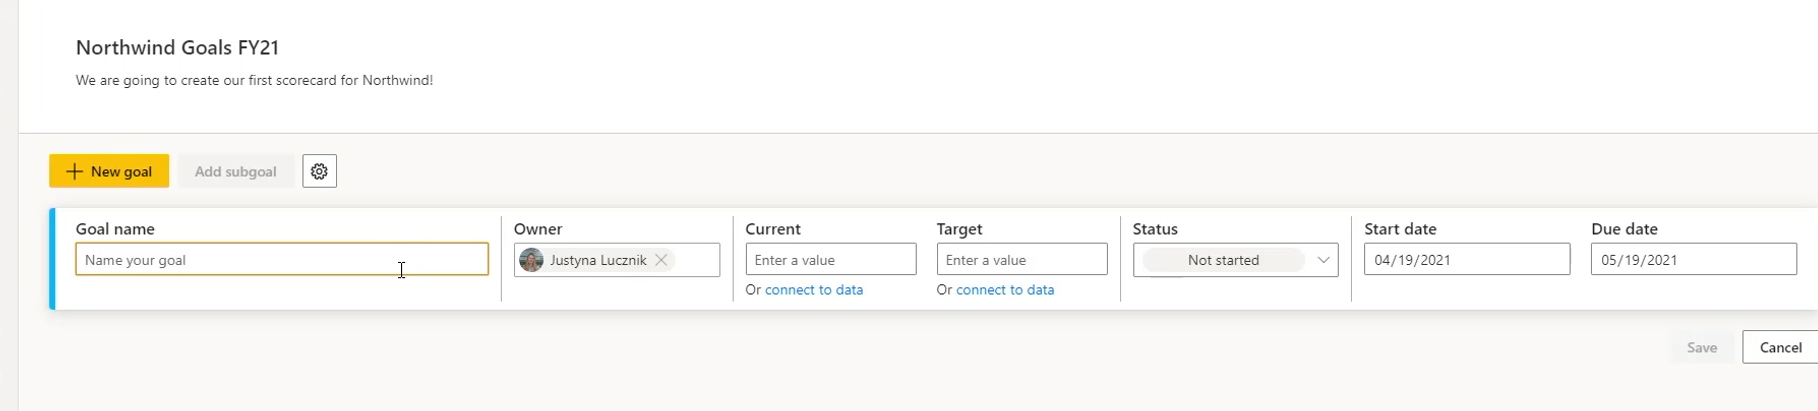
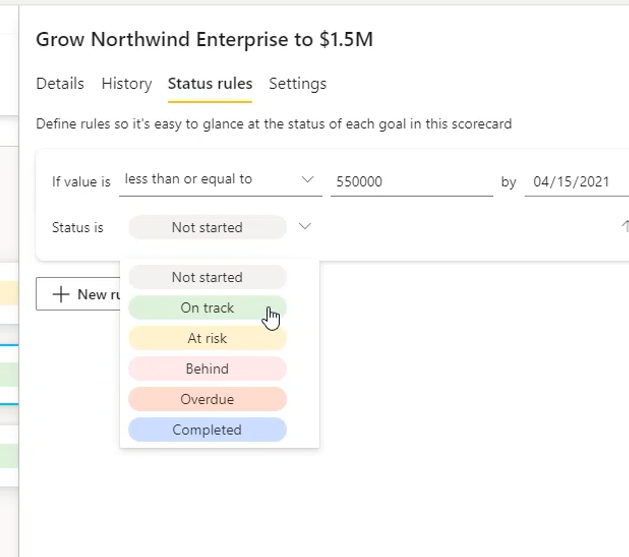
This can contain some powerful configurations for scorecards;
You can set the status rules
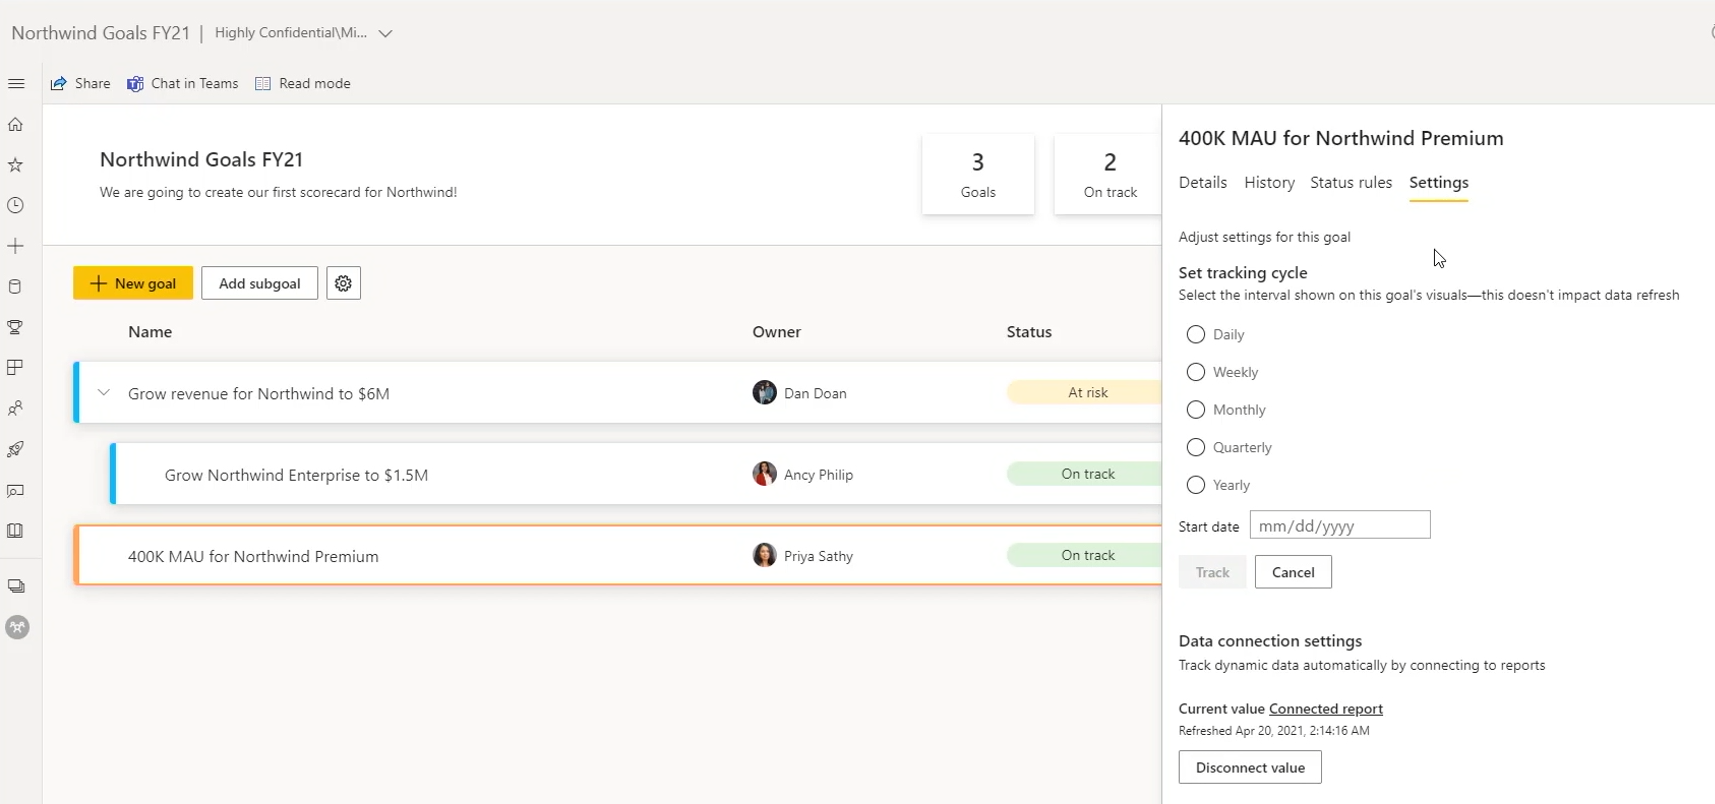
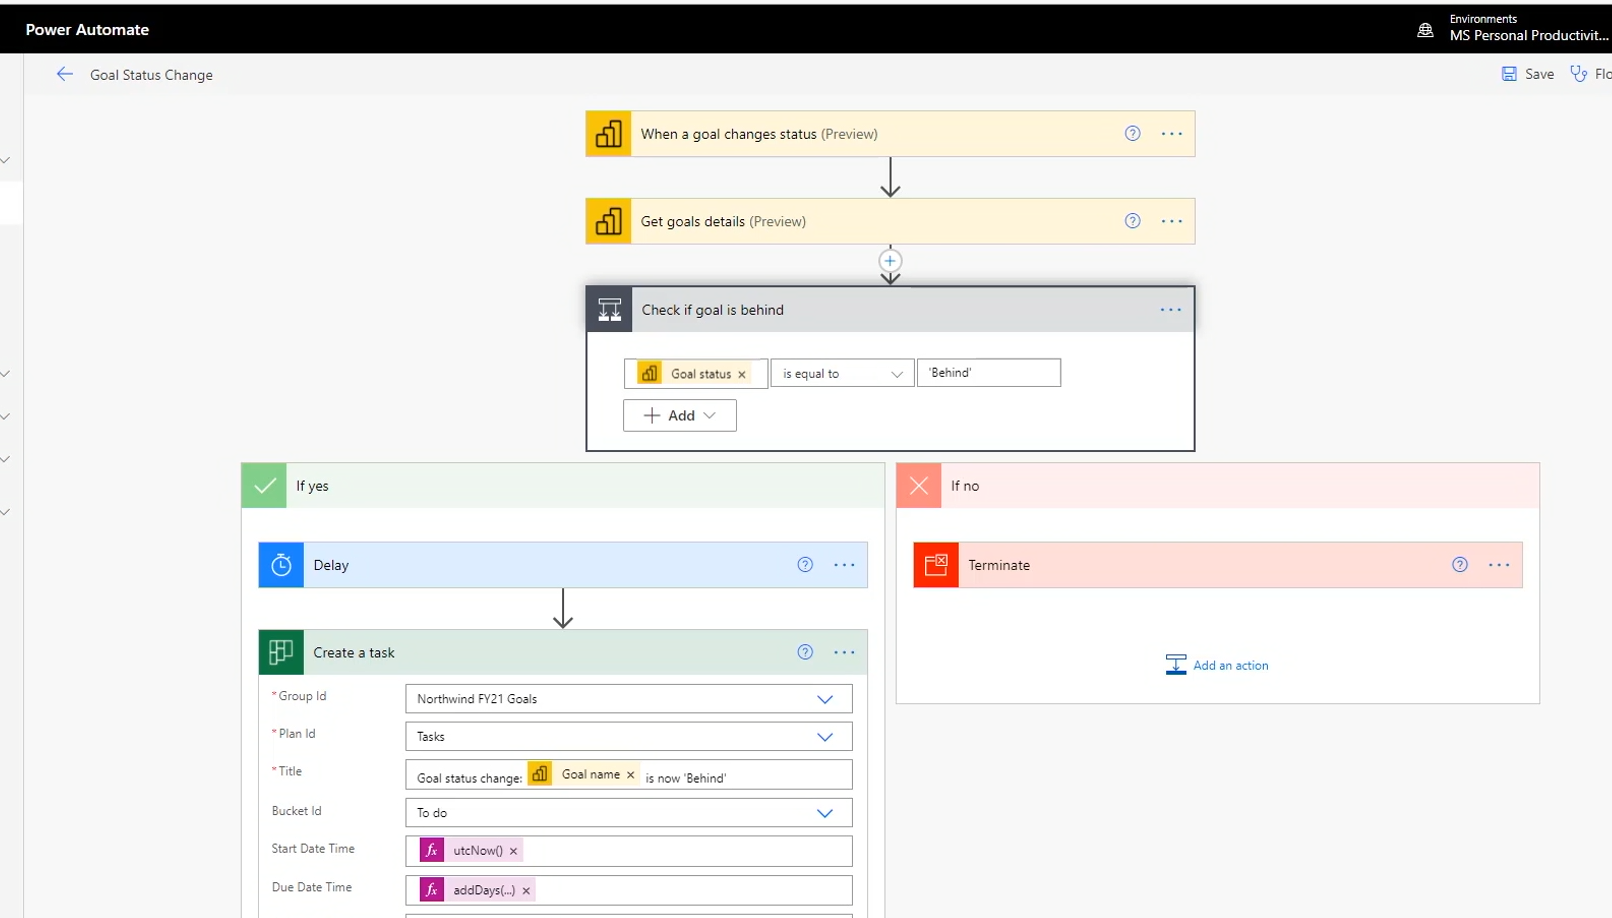
Goals then can be used for automation purposes, which is another ace in this feature. This is done using Power BI goals and Power Automate’s flow.
Goals can be consumed in many ways too;
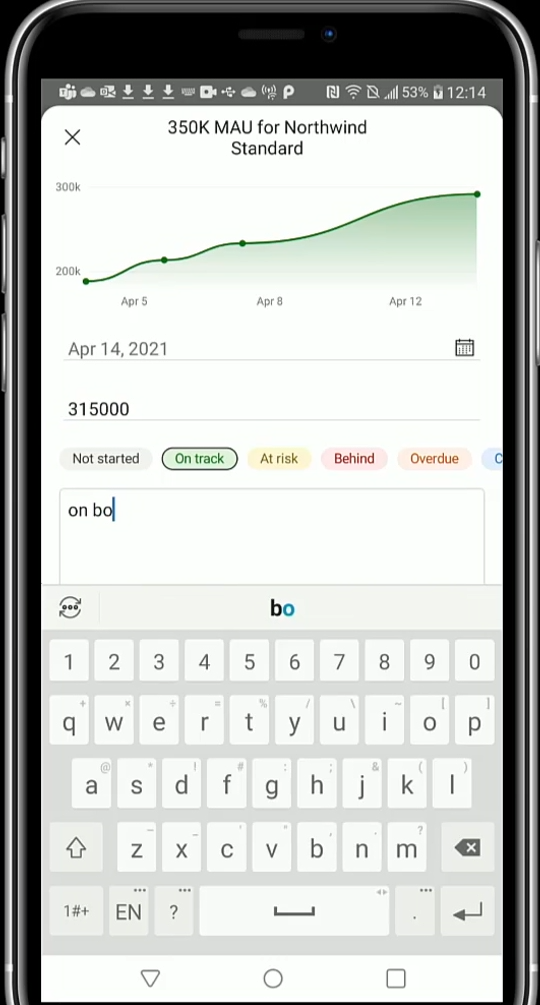
or even through mobile experience of Power BI;
Goals are available now if you want to use it.
Power BI and Hololens
You can use Power BI repots in the space using Hololens.

This enables you to pin Power BI objects to places and access them as you go. But this is not just for the expensive Hololens.
Power BI reports in space using Mobile
A similar experience is also available through the phone;


Power BI Spatial Anchoring is the name of this feature, and it will be available later this year.

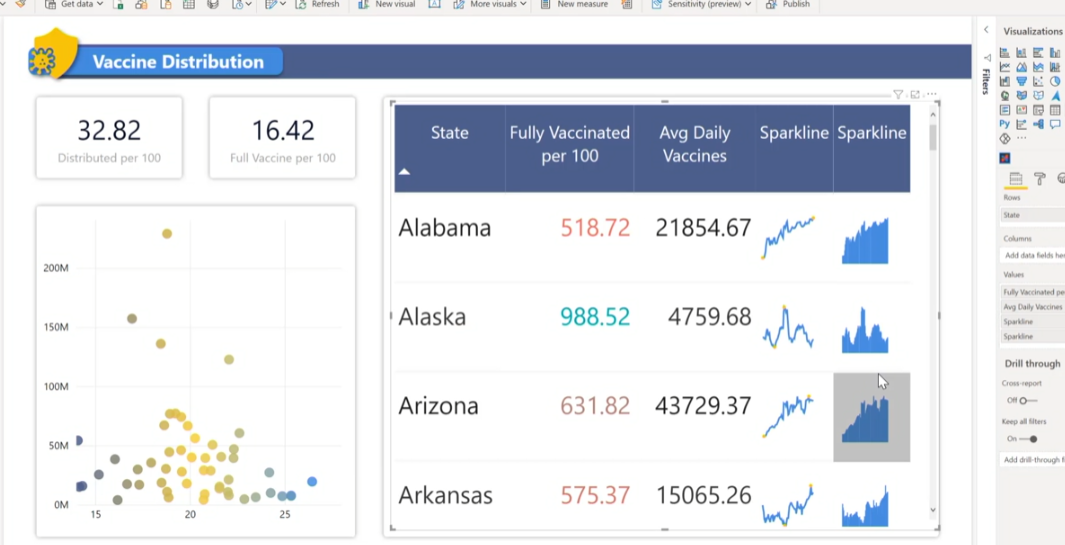
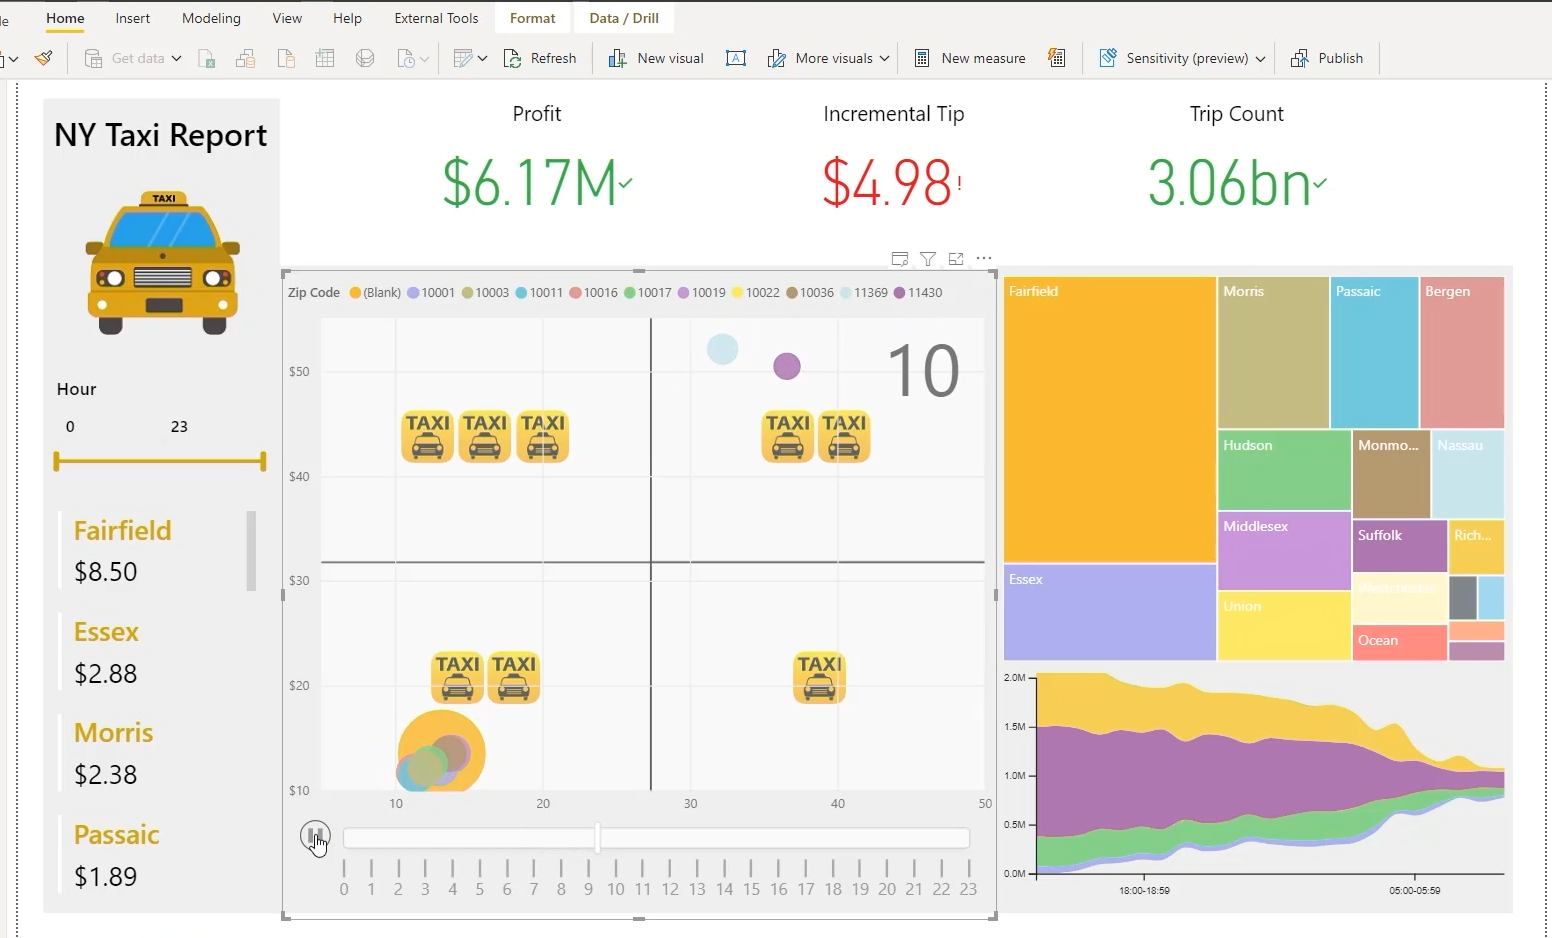
Sparkline in Power BI
Sparkline has been one of the most wanted features for Power BI for a long time, and here it is now;
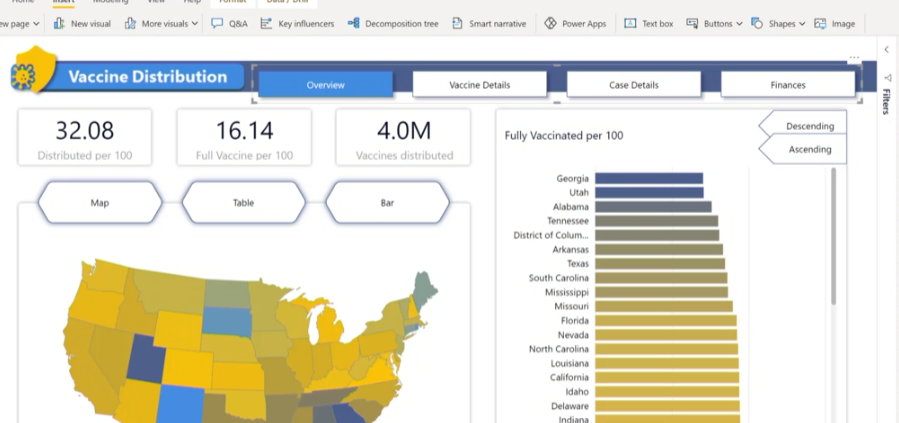
Easy-to-use Bookmarks
Bookmarks are a powerful visualization feature in Power BI, however, to get them working, you need to do a lot of extra work; such as creating the bookmark, setting the action for it, setting the target of the action, and doing it for every item (or maybe page, etc). This is now getting much easier, and you can have Navigator bookmarks, usable just with a few clicks.
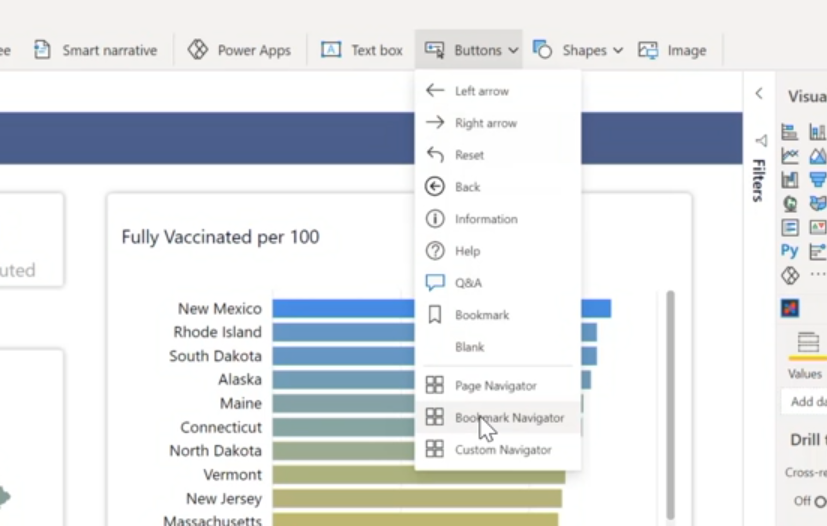
This lets you have customized bookmarks everywhere with a few clicks.
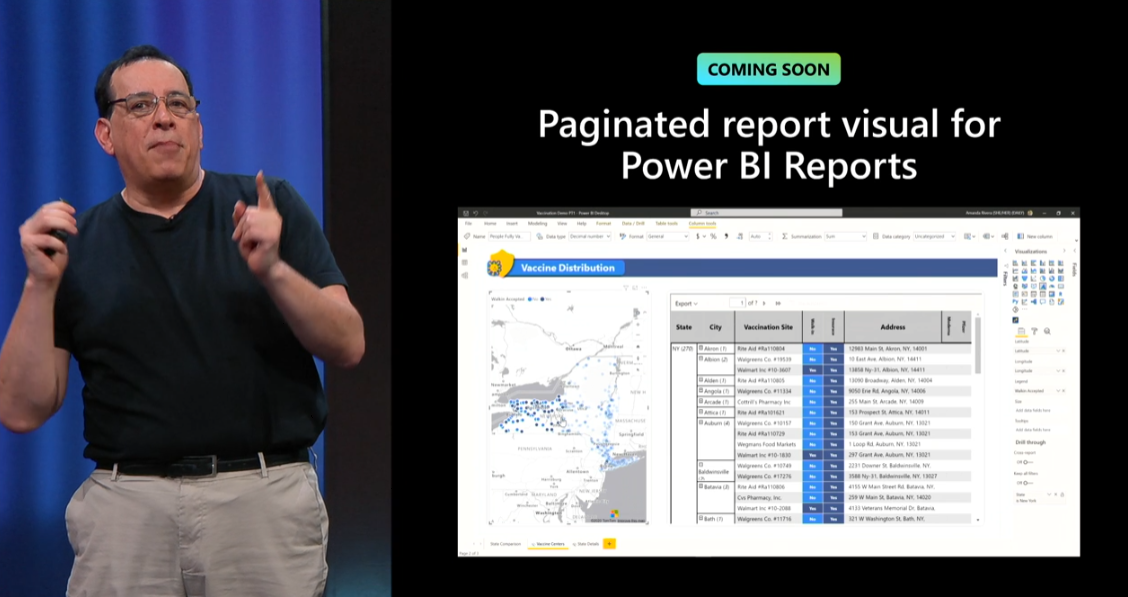
Paginated report visual for Power BI reports
Paginated reports can be part of Power BI reports. this is coming to Power BI soon.
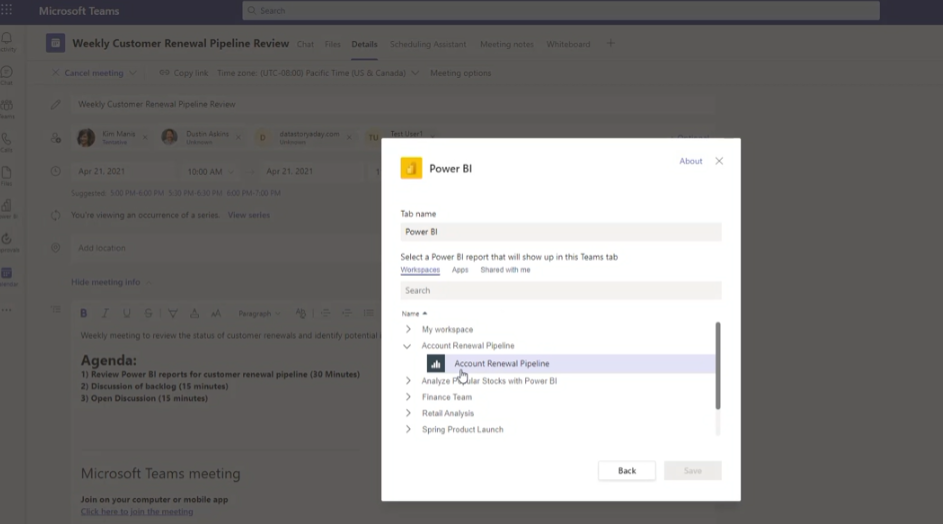
Power BI integration with Teams
Power BI integration with Teams is getting better and better. You can have Power BI reports part of the Teams meeting;
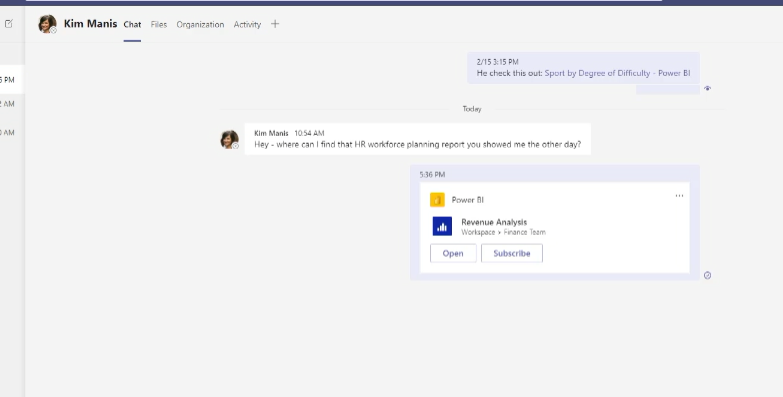
Or you can have Power BI reports shared through a Teams chat;
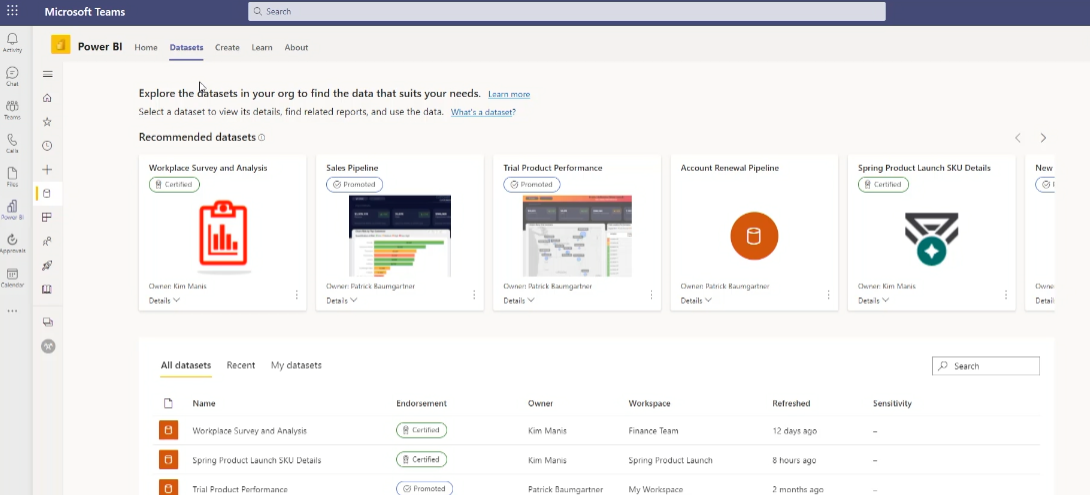
The access to the dataset hub is possible from Teams. Dataset hub is a place that you can control and monitor dataset related activities.
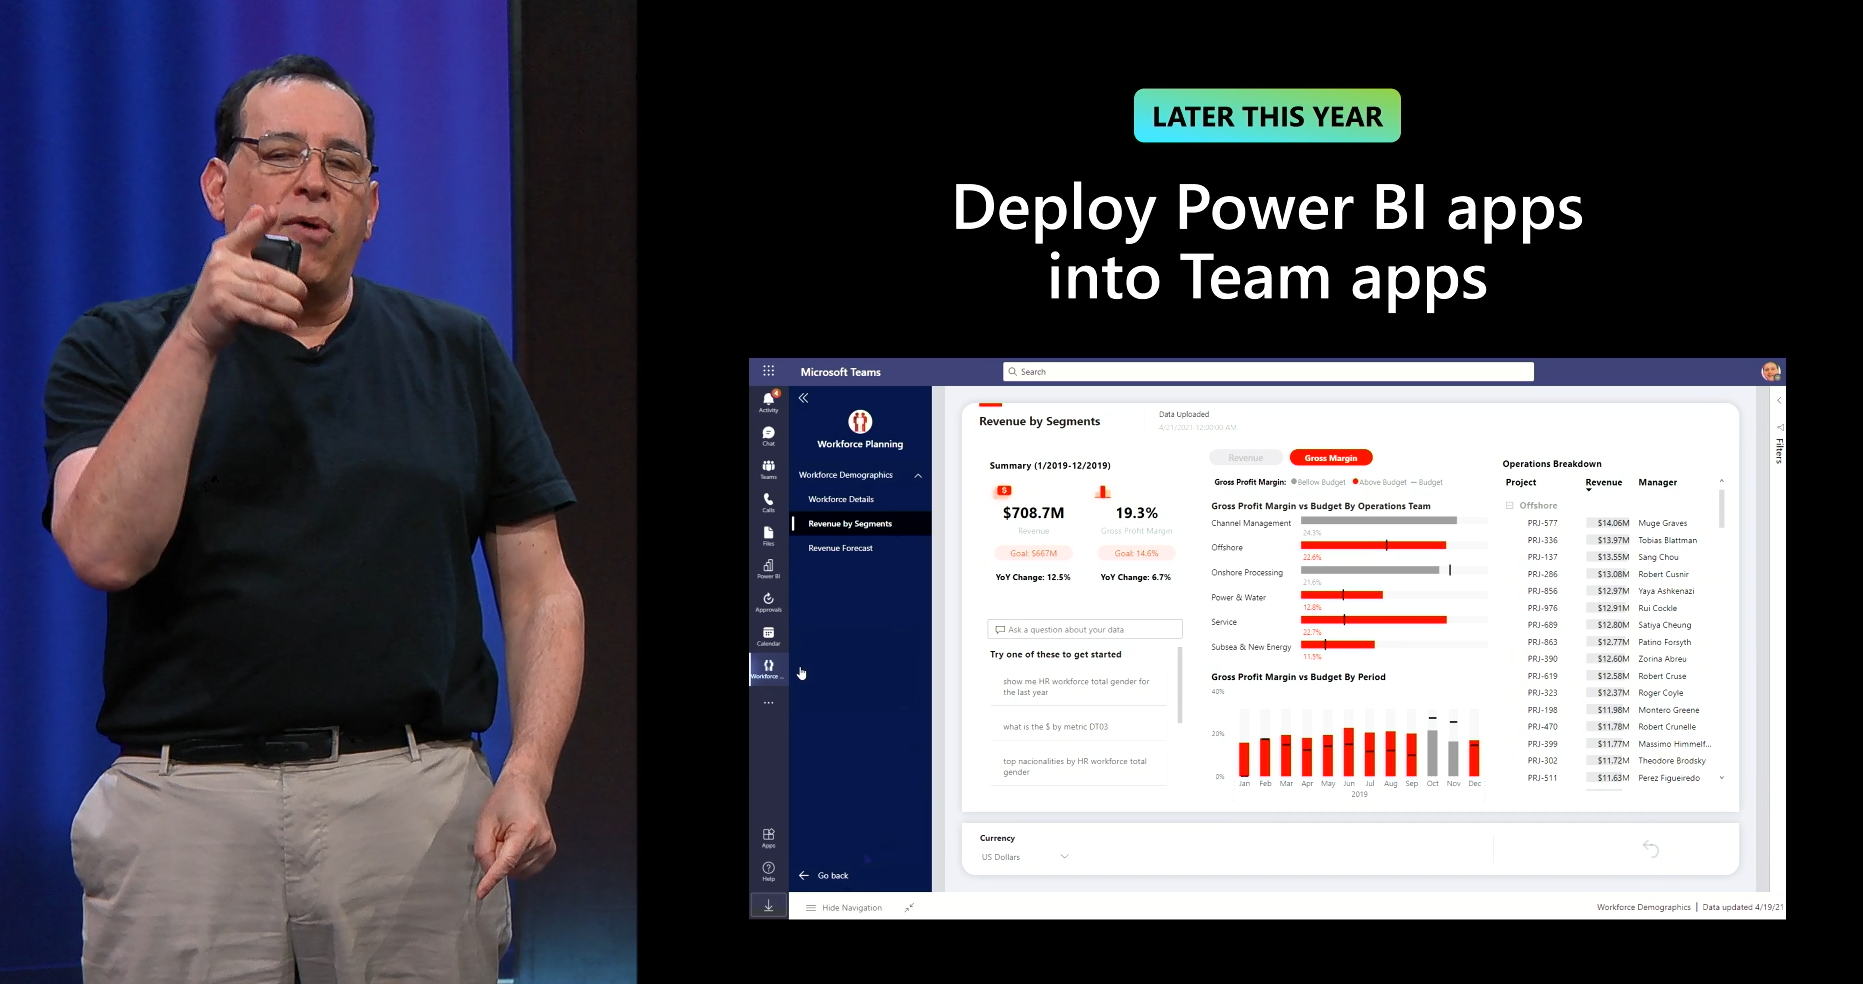
Power BI apps can be deployed as Teams app and be used there;
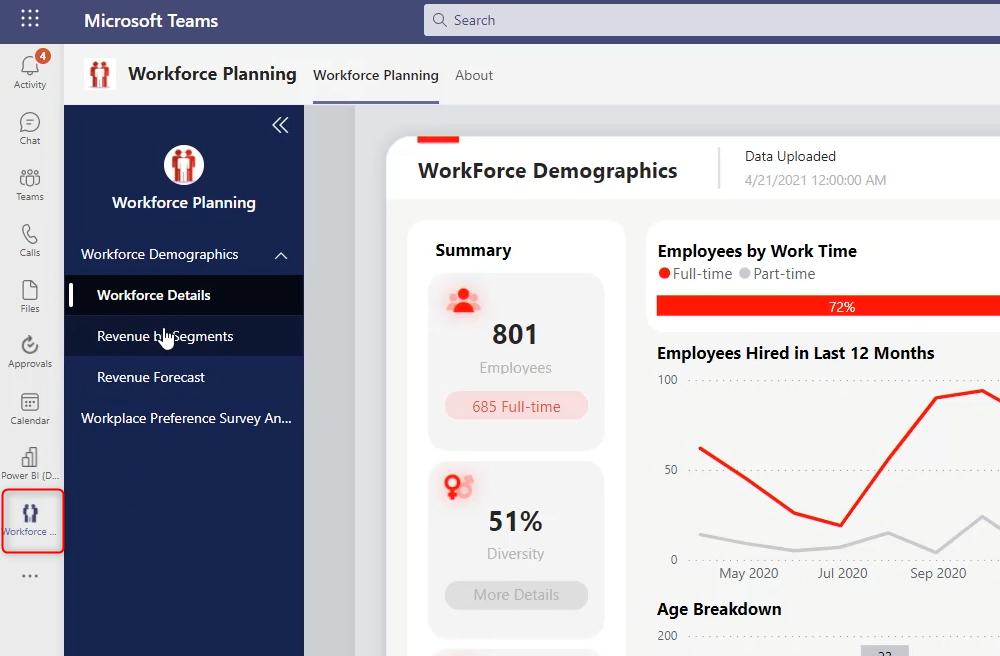
The Power BI apps deploy as Teams app is coming later this year in Power BI.
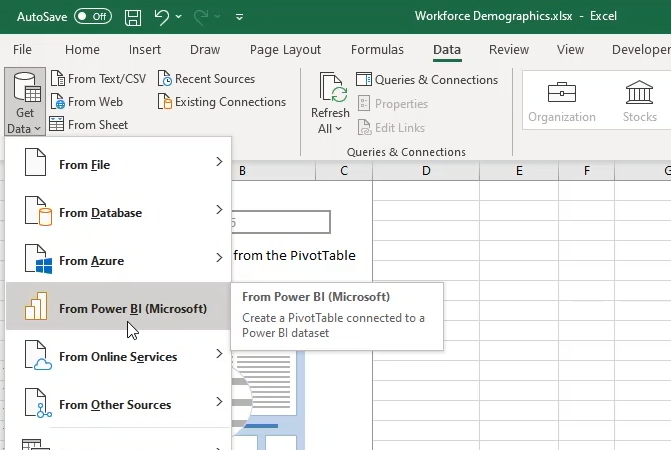
Power BI and Excel Integration
You can have an Excel file that gets data from a Power BI dataset, and uses the shared dataset.
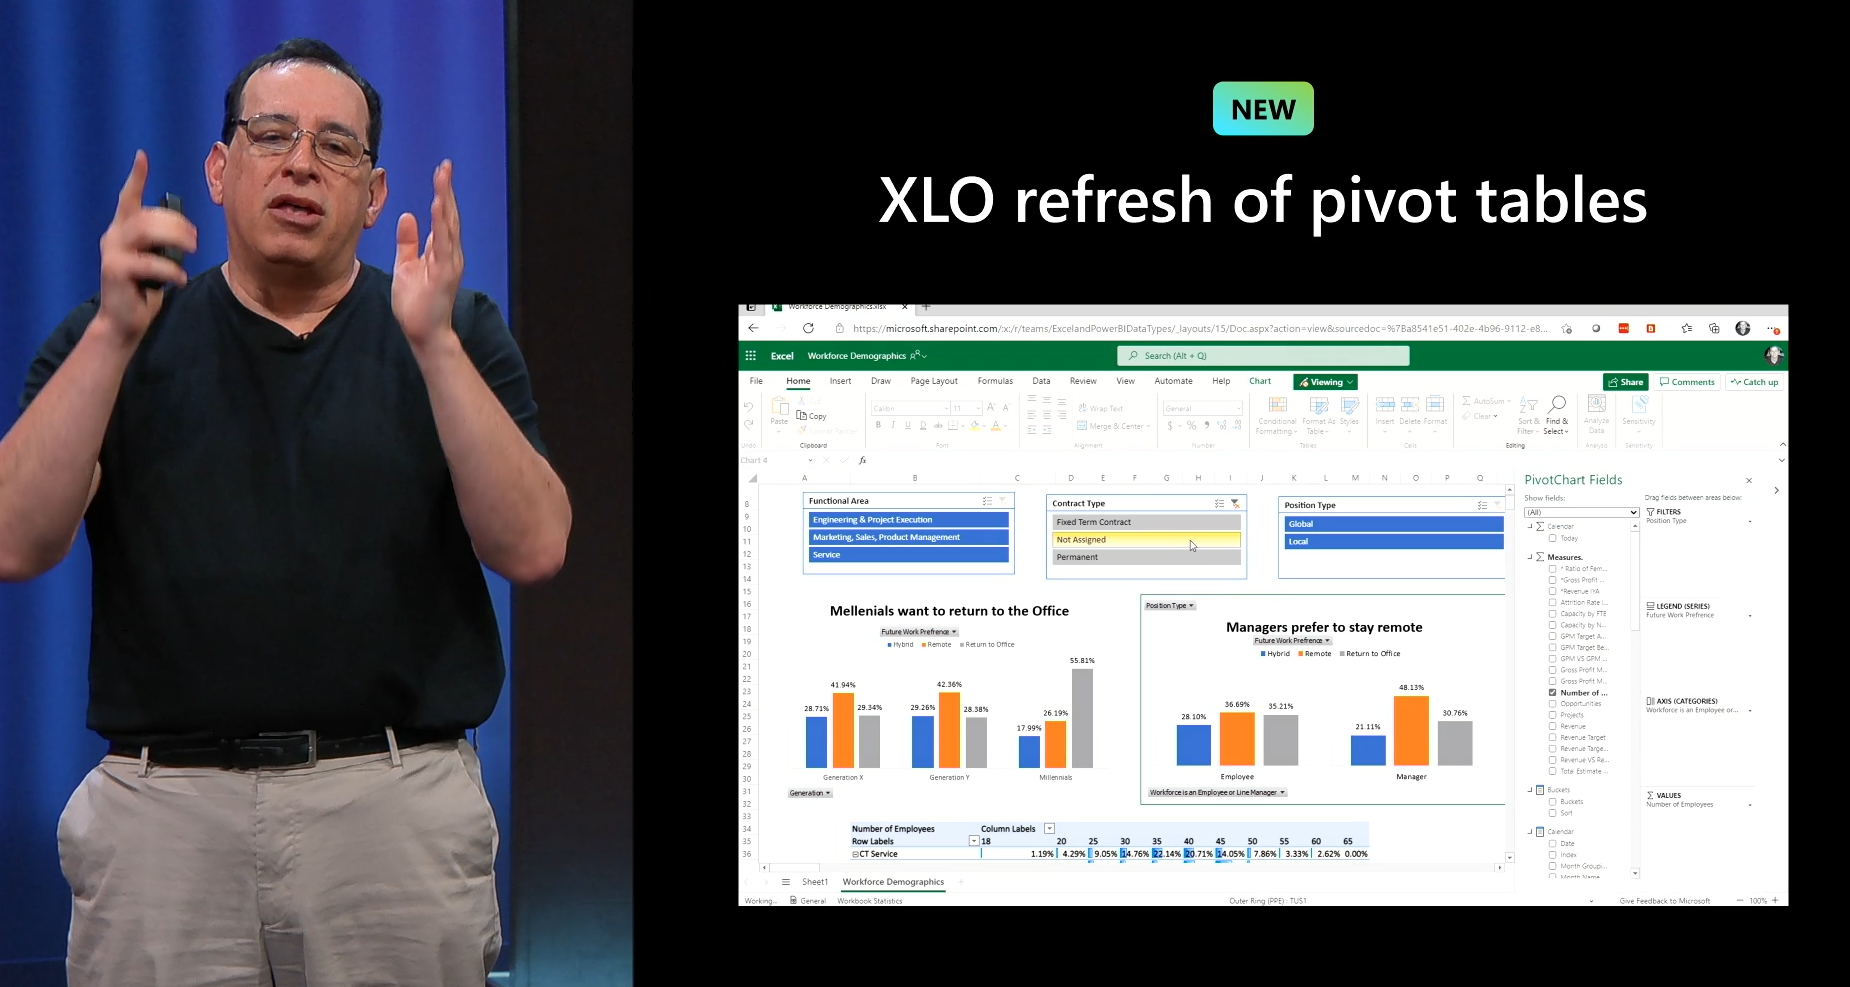
Pivot tables can be refreshed through Excel online;
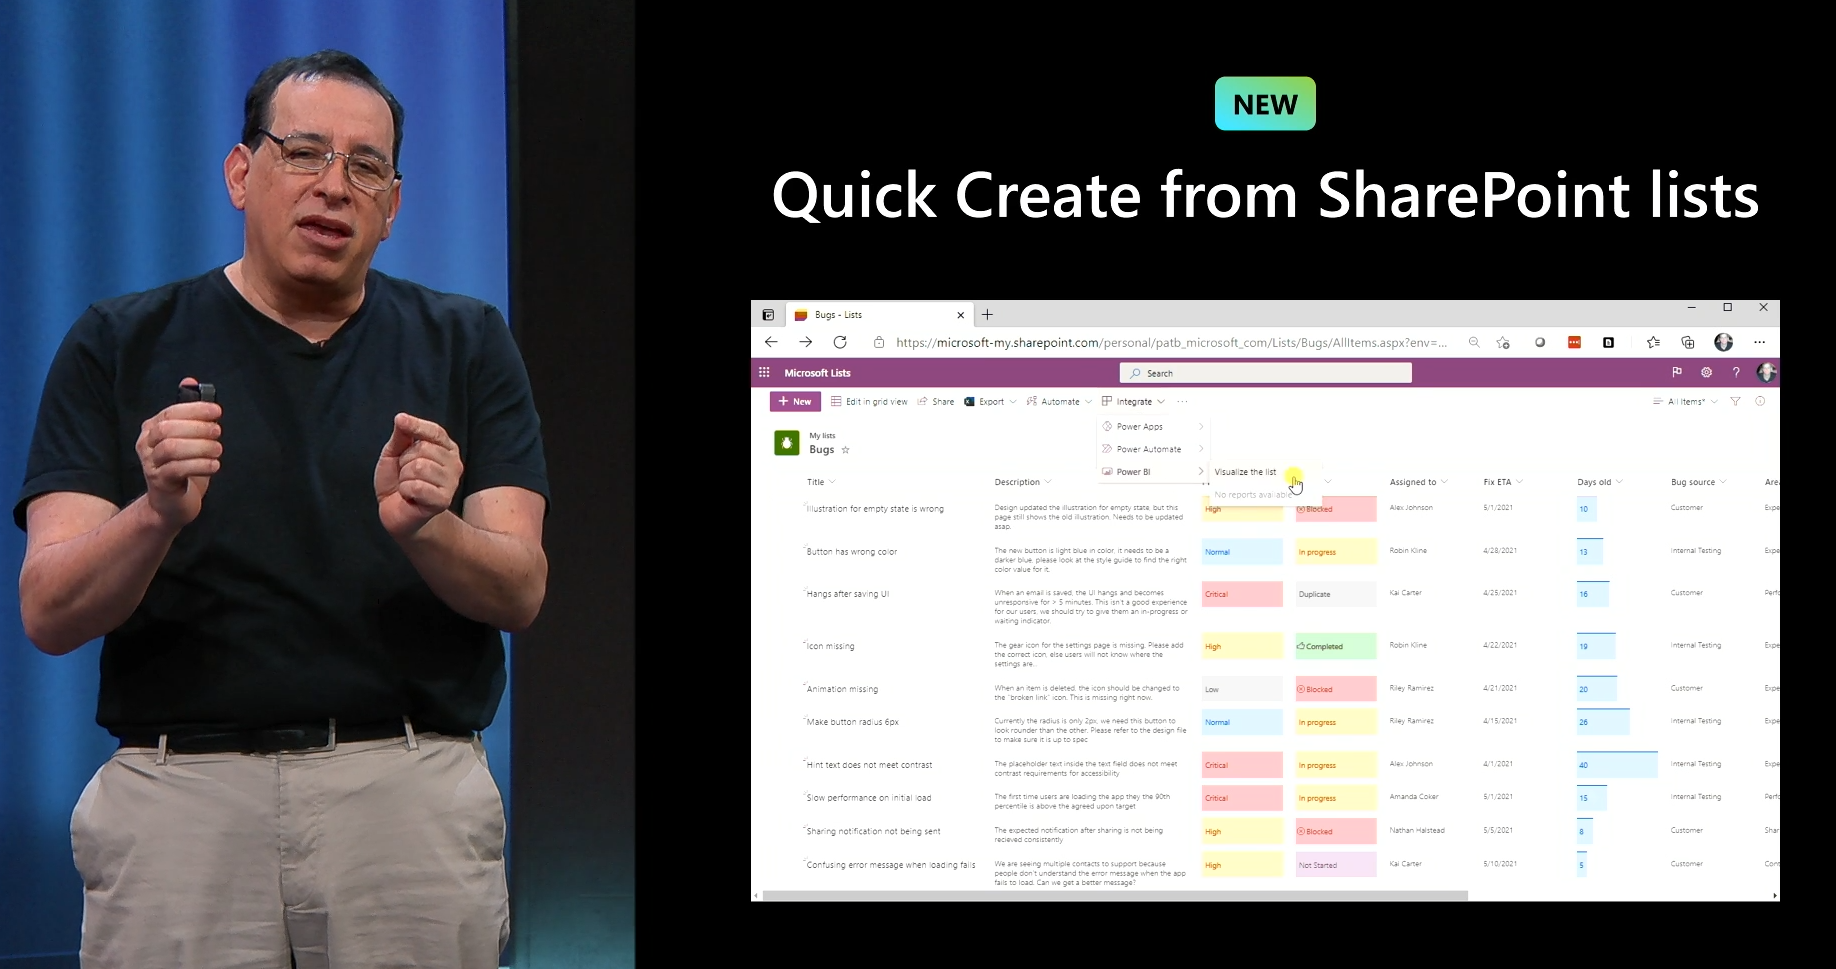
Power BI and SharePoint
You can already use SharePoint as a source to create a Power BI report, But this is now even easier. You can quickly create a Power BI report from a SharePoint list.
Data Sensitivity in Power BI
Data Sensitivity labels now passes from Azure Synapse into Power BI
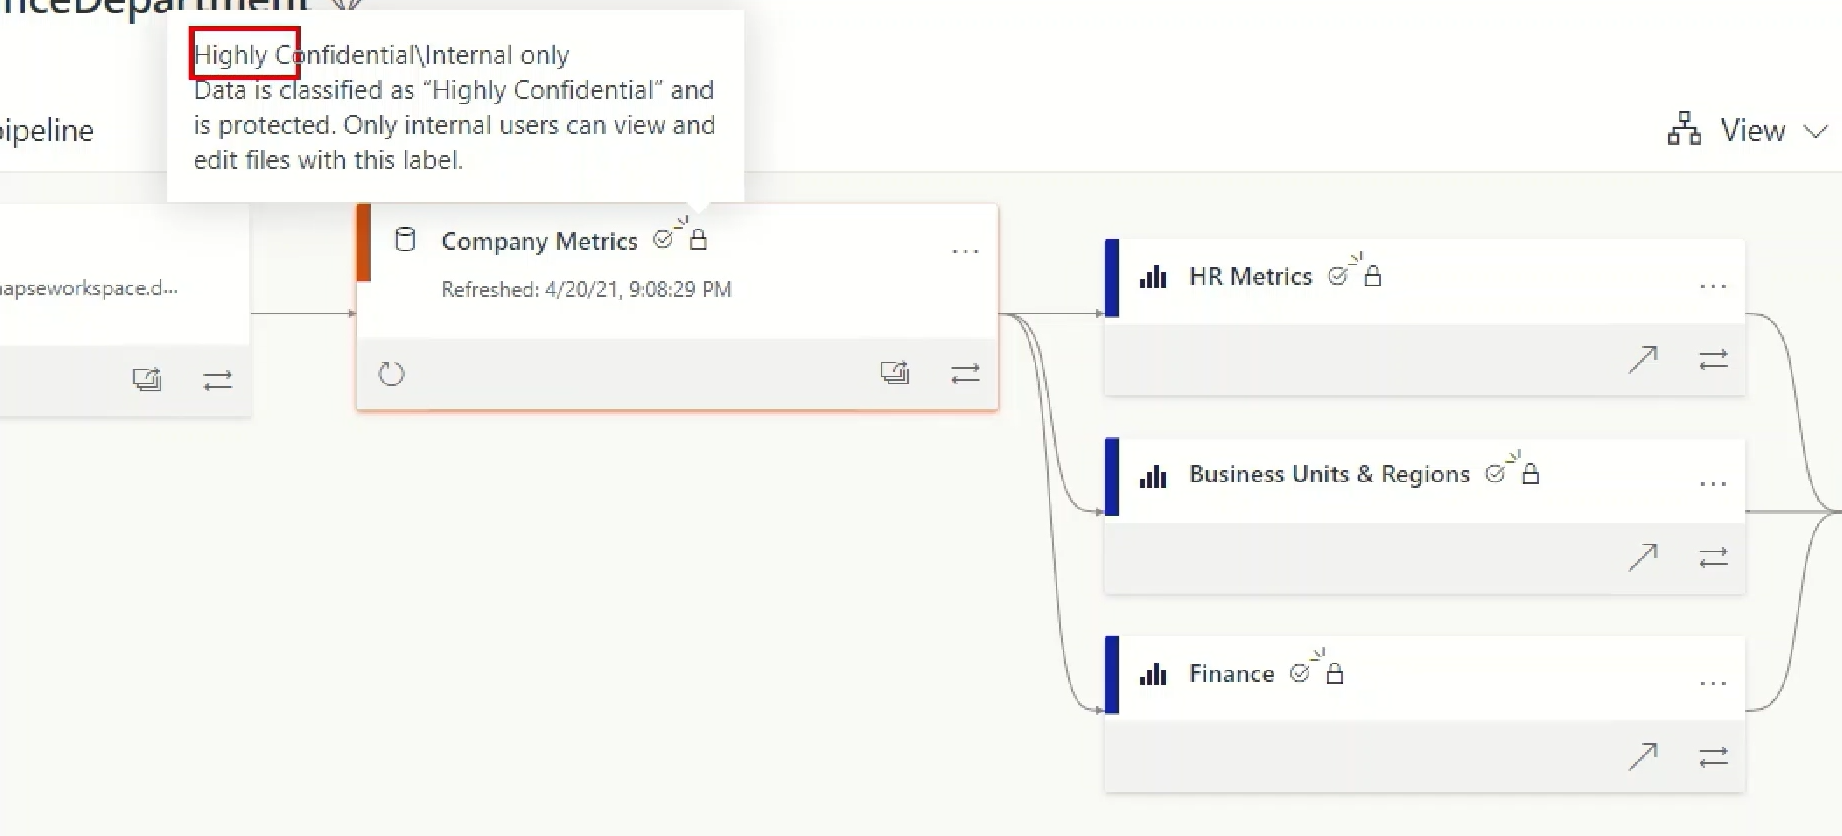
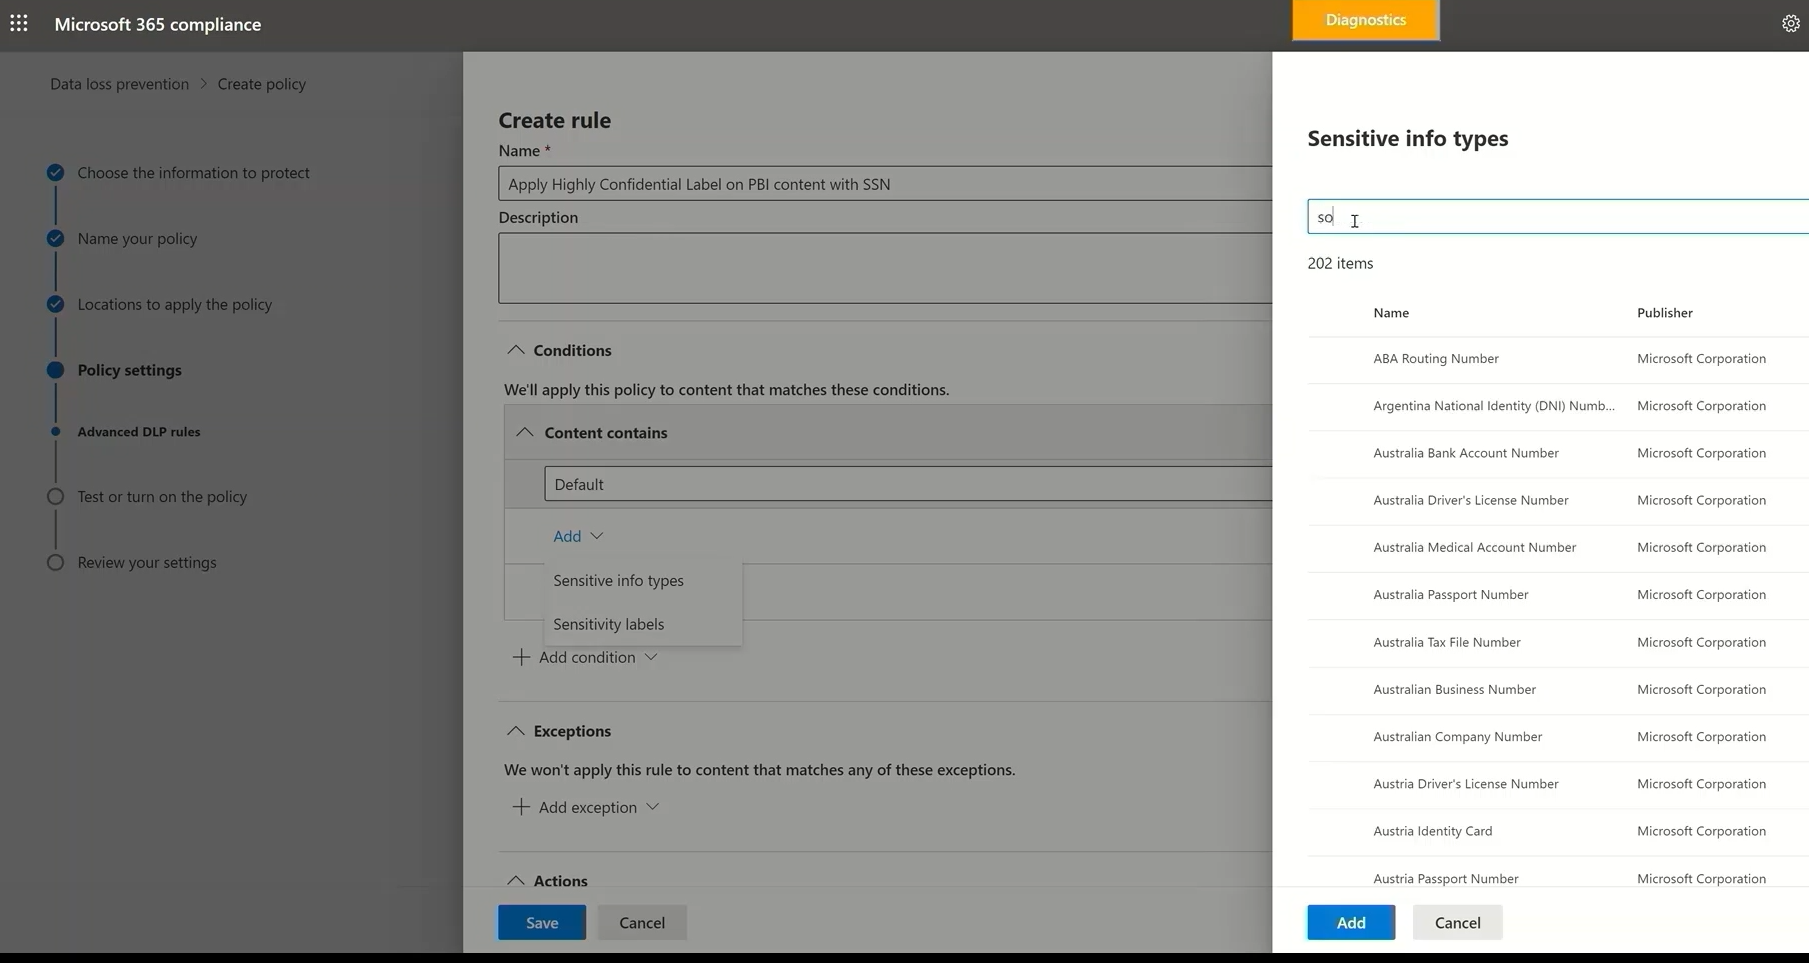
Data Loss Prevention policy can be defined;
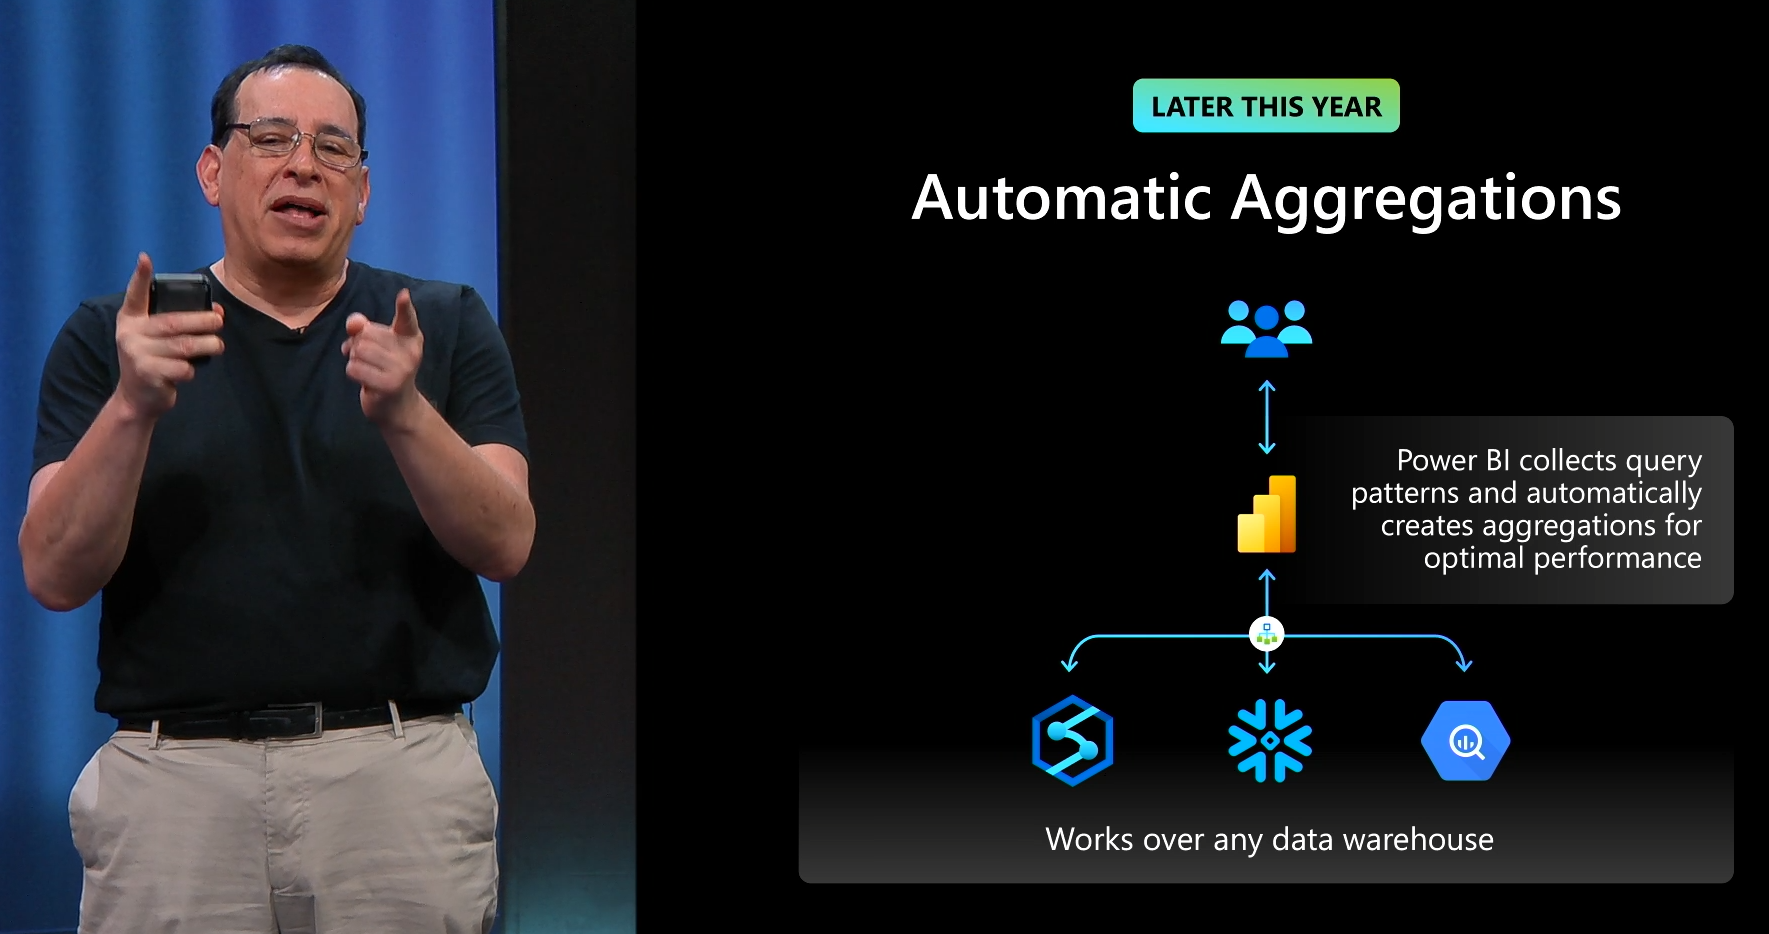
Automatic Aggregation in Power BI
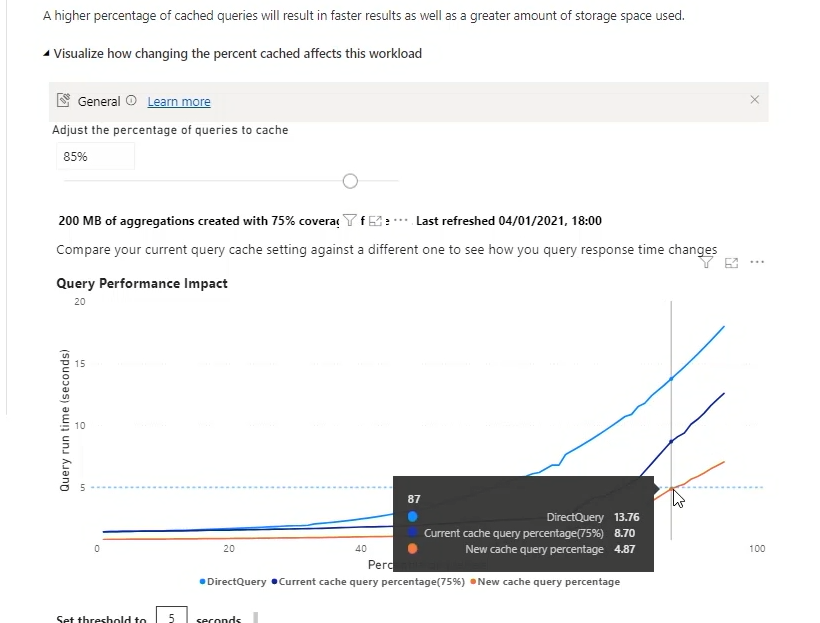
This is another big step in Power BI towards better performance of the reports. You can at the moment use aggregations to speed up the performance of your report, but this process requires some steps; such as creating the aggregated tables, setting up the configuration, and some other steps. Using Automatic aggregations, everything would be possible with just a few settings.
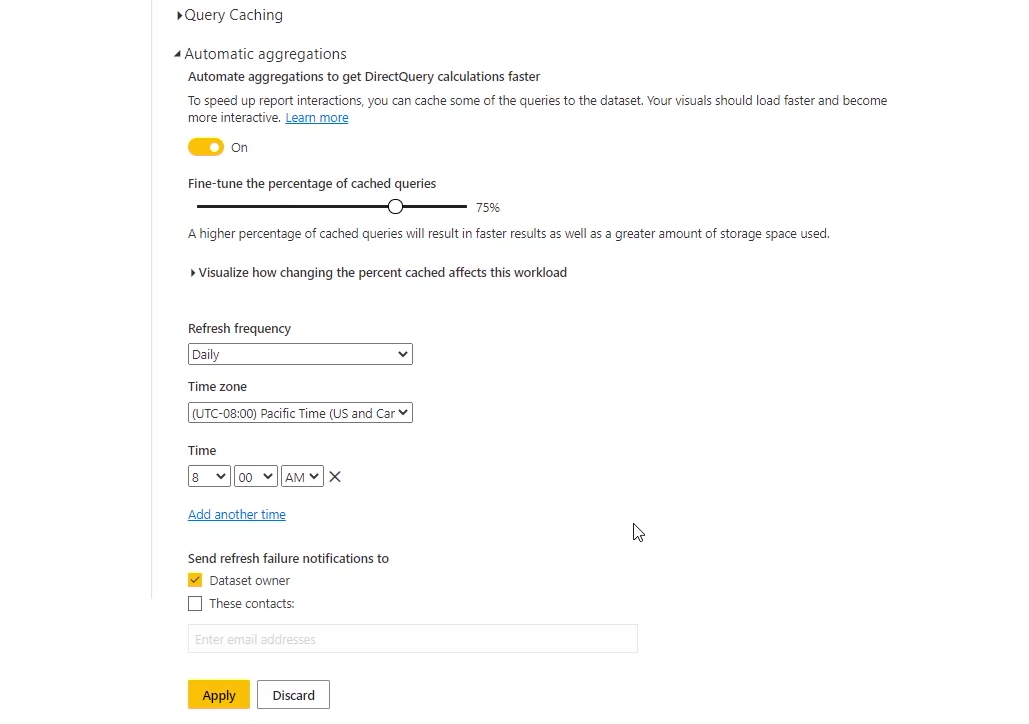
This in simple words, will make Power BI reports faster without needing a performance tuning expert’s touch.
You can also use a what-if analysis to gauge the performance based on the settings.
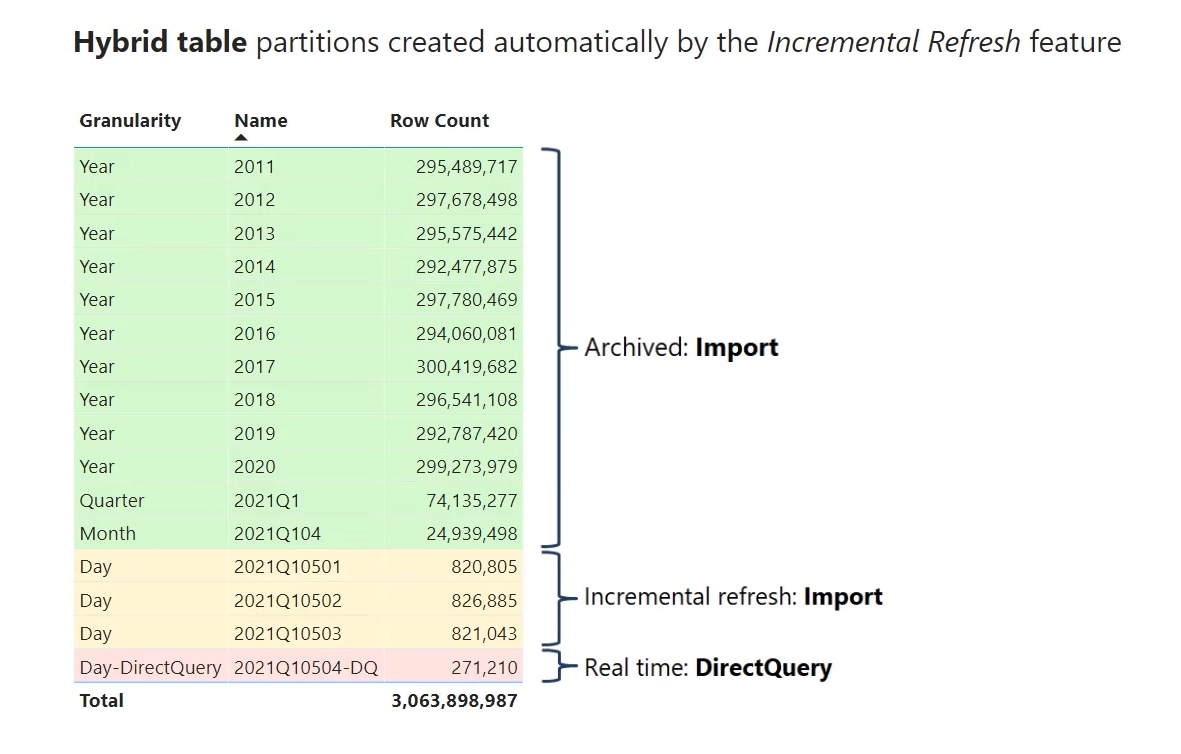
And last but not least, Hybrid tables coming to Power BI, allows you to have blazing fast performance and also real-time data.
Automatic aggregations comes to Power BI later this year.
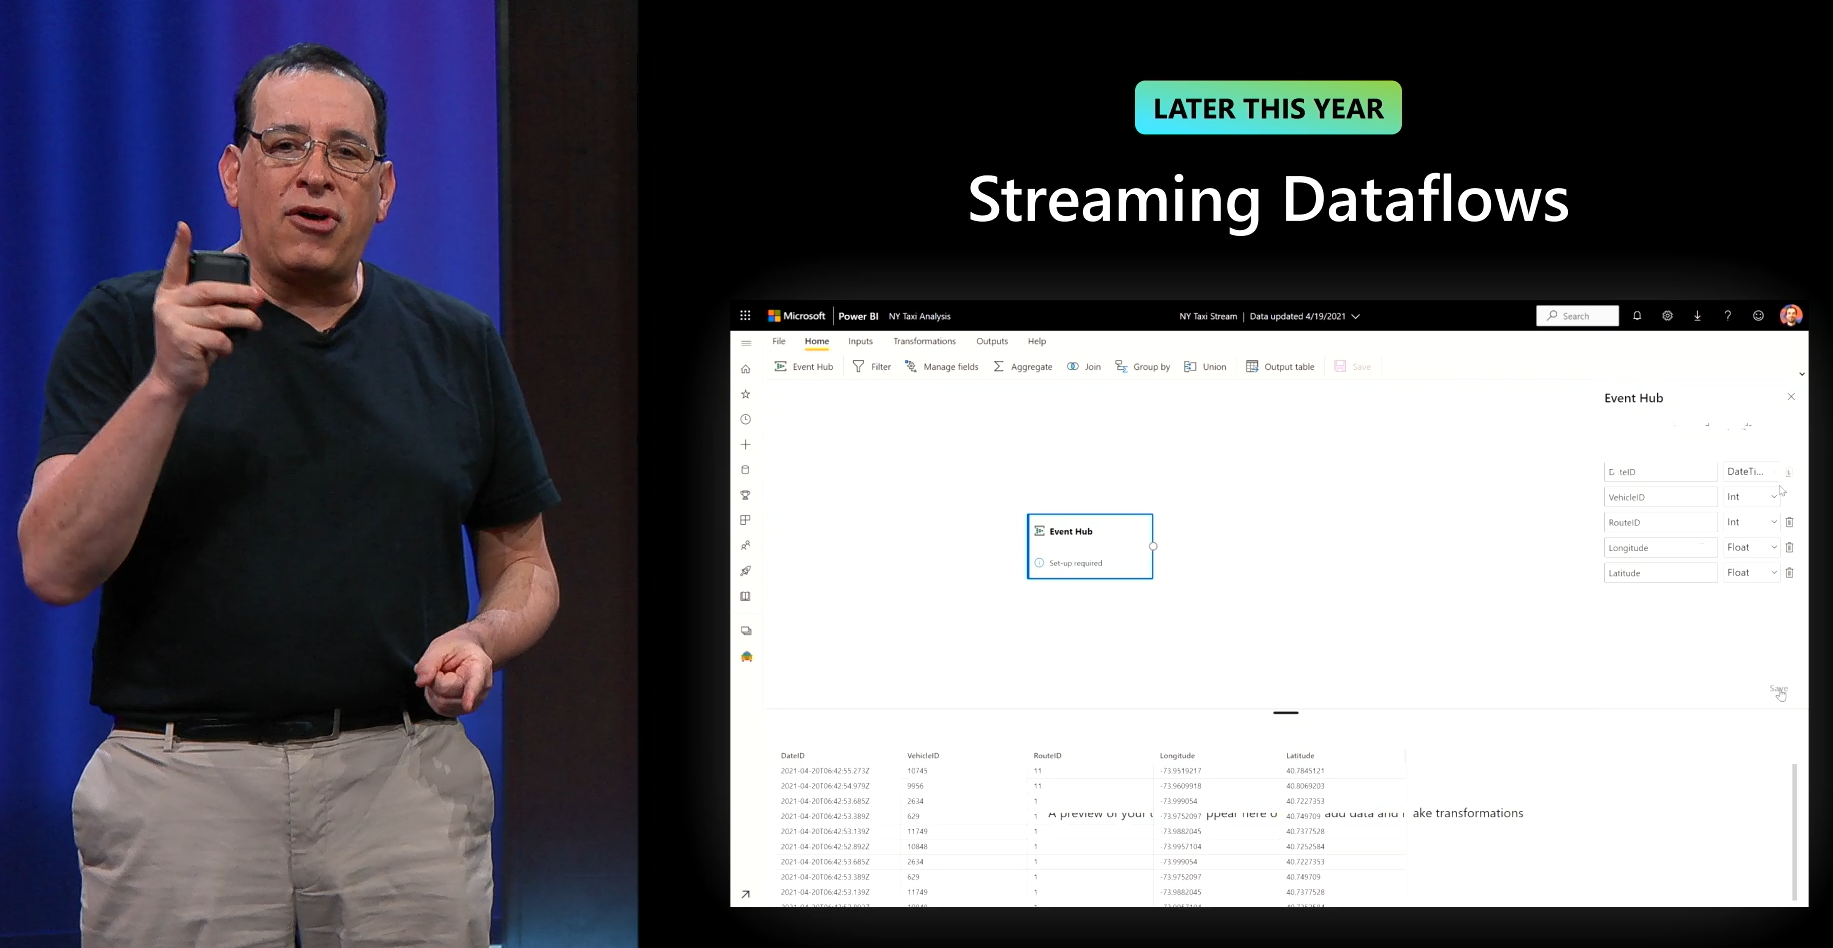
Streaming dataflows
Streaming data is not ugly anymore, you can transform it while it streams. This is possible using streaming dataflows.
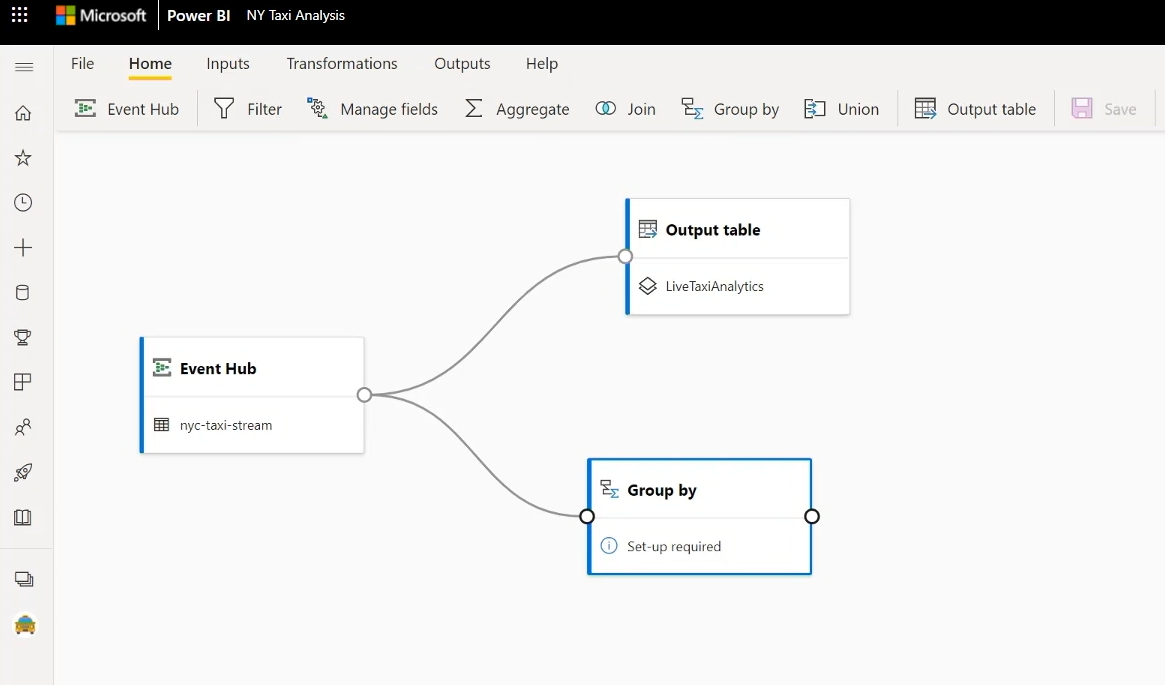
Streaming dataflows allows Power Query transformations on top of the streaming data. This feature will be available later this year.
Power Query Recent updates
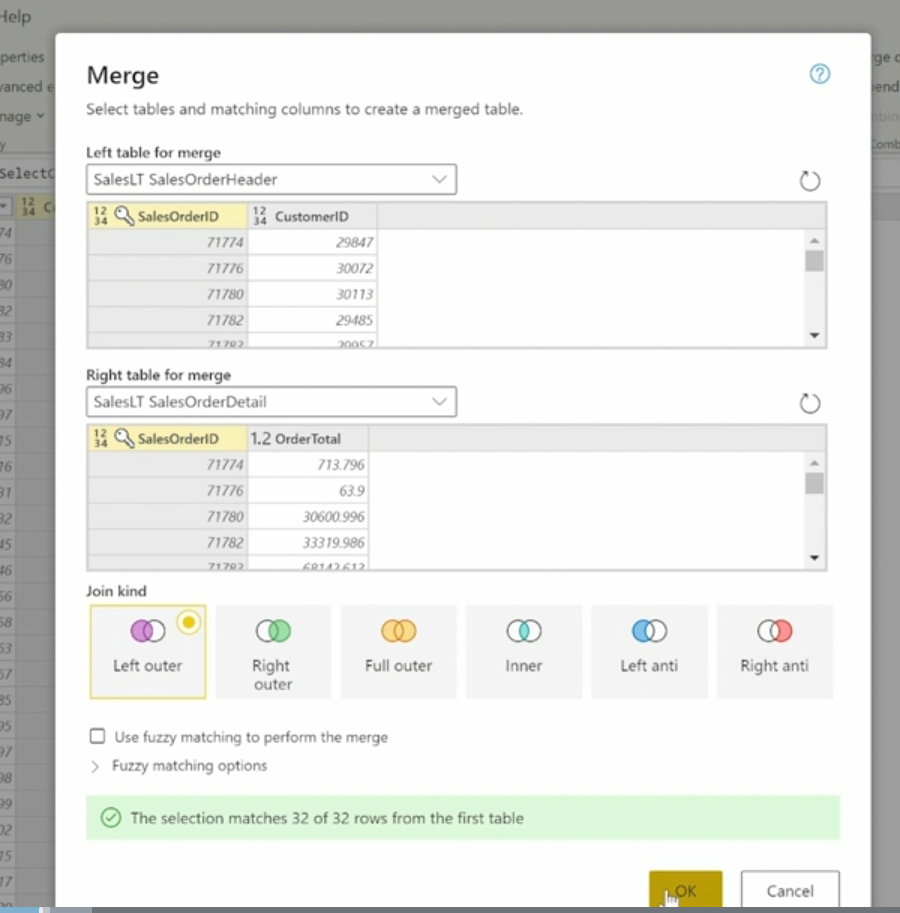
There has been massive super powerful updates in Power Query especially in Power Query online and the dataflow experience, this is not just the graphical experience as showed below;
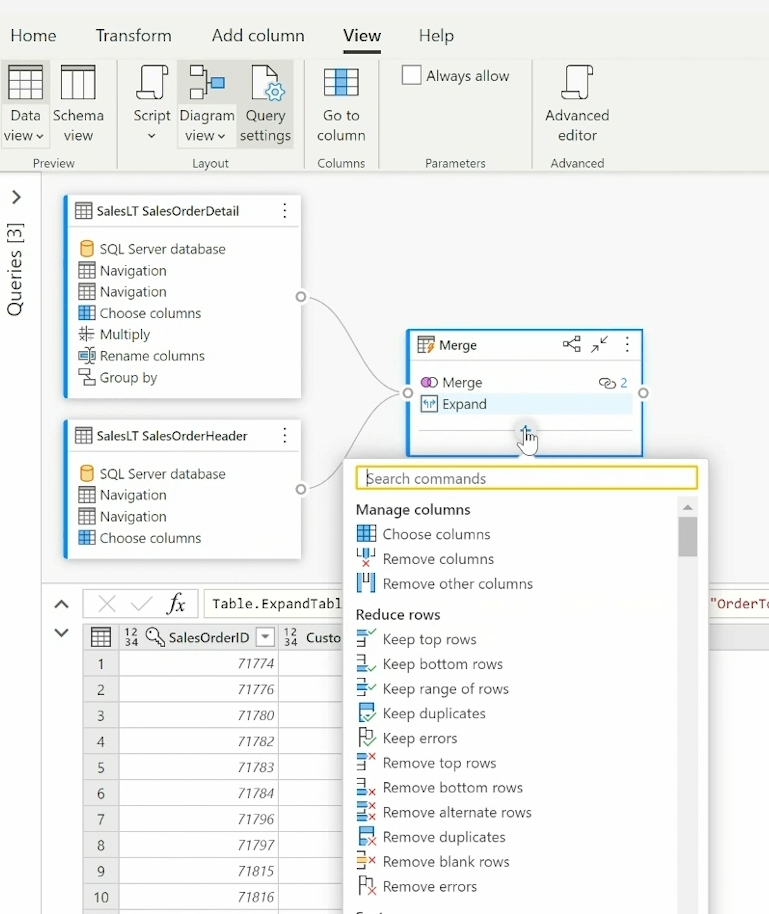
The mighty new diagram view, which is not just for queries, but also for steps;
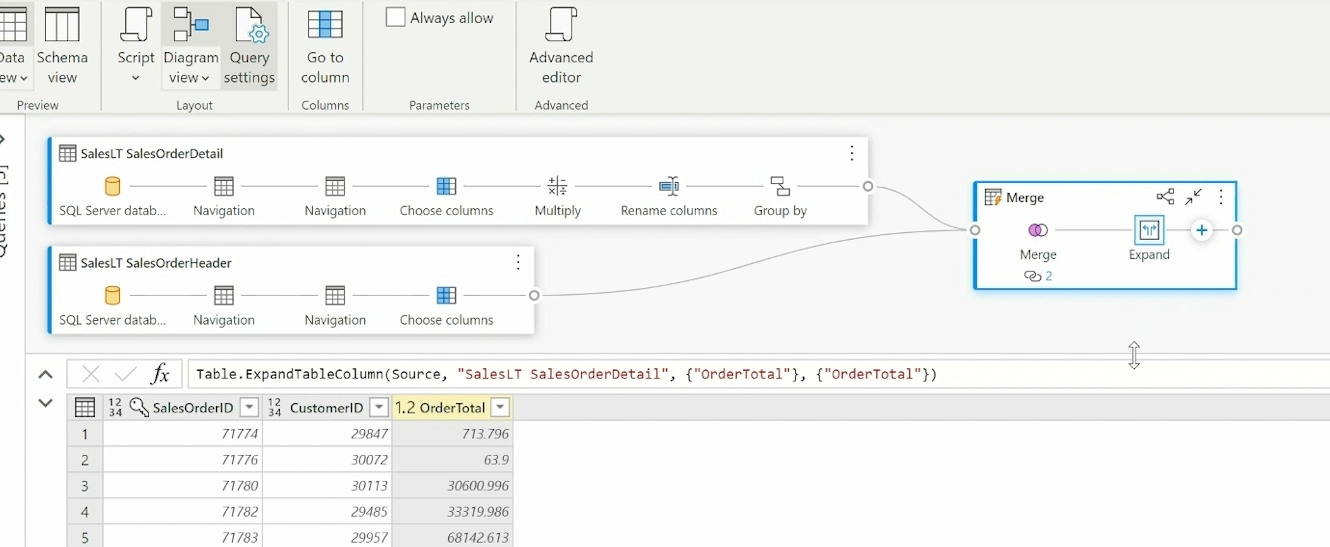
This is also very easy for adding new steps and transformations through the interface.
I have to say it this way that; exactly opposite of DAX that is still one of the challenges of many Power BI users, the Power Query becomes easier and easier every day. Everyone can use it.
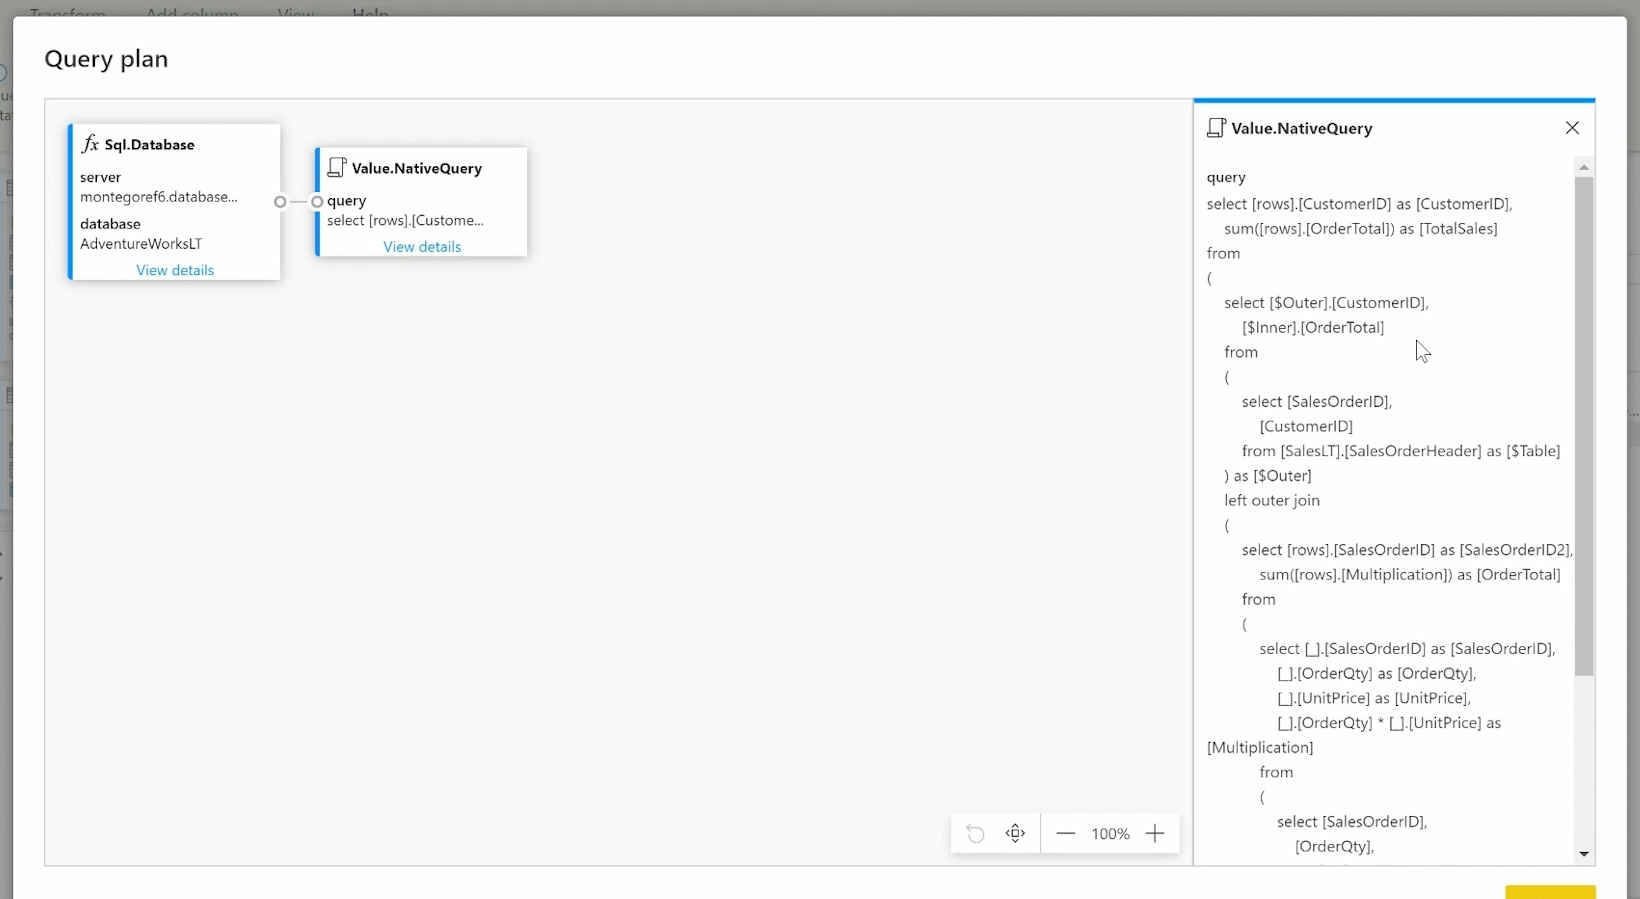
This is not just for the graphical part, but also for important back-end stuff such as Query plan.
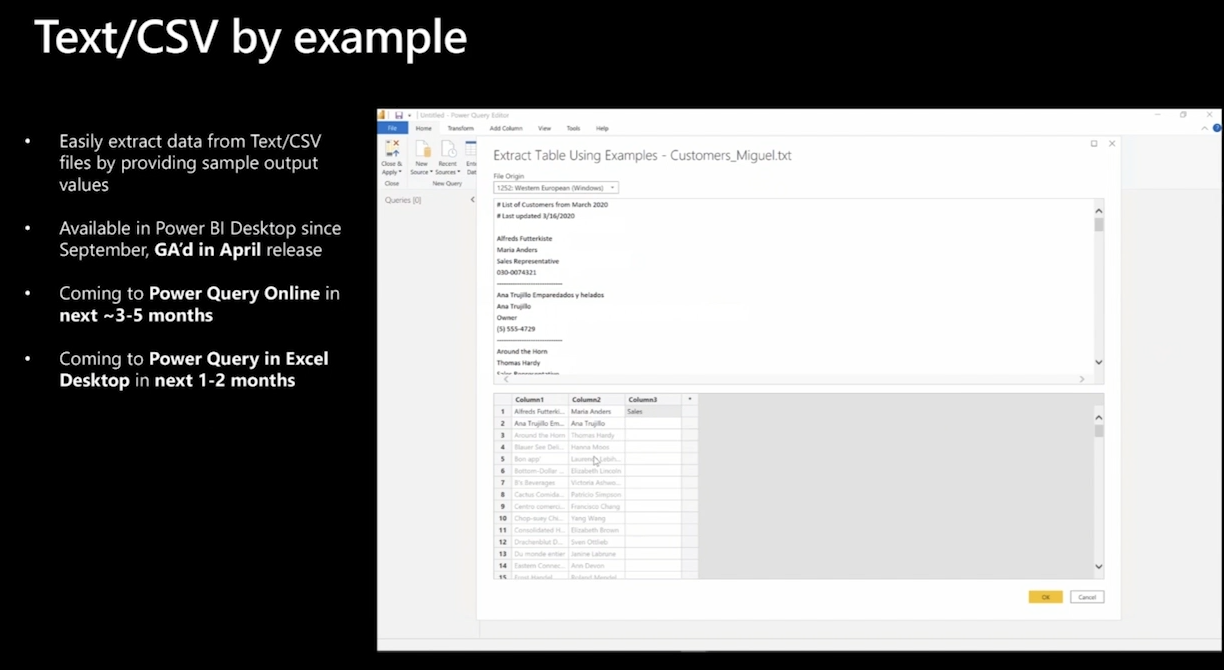
There are many other fantastic features already published in Power Query in Power BI Desktop that are coming to Power Query online soon. such as Text/CSV by example.
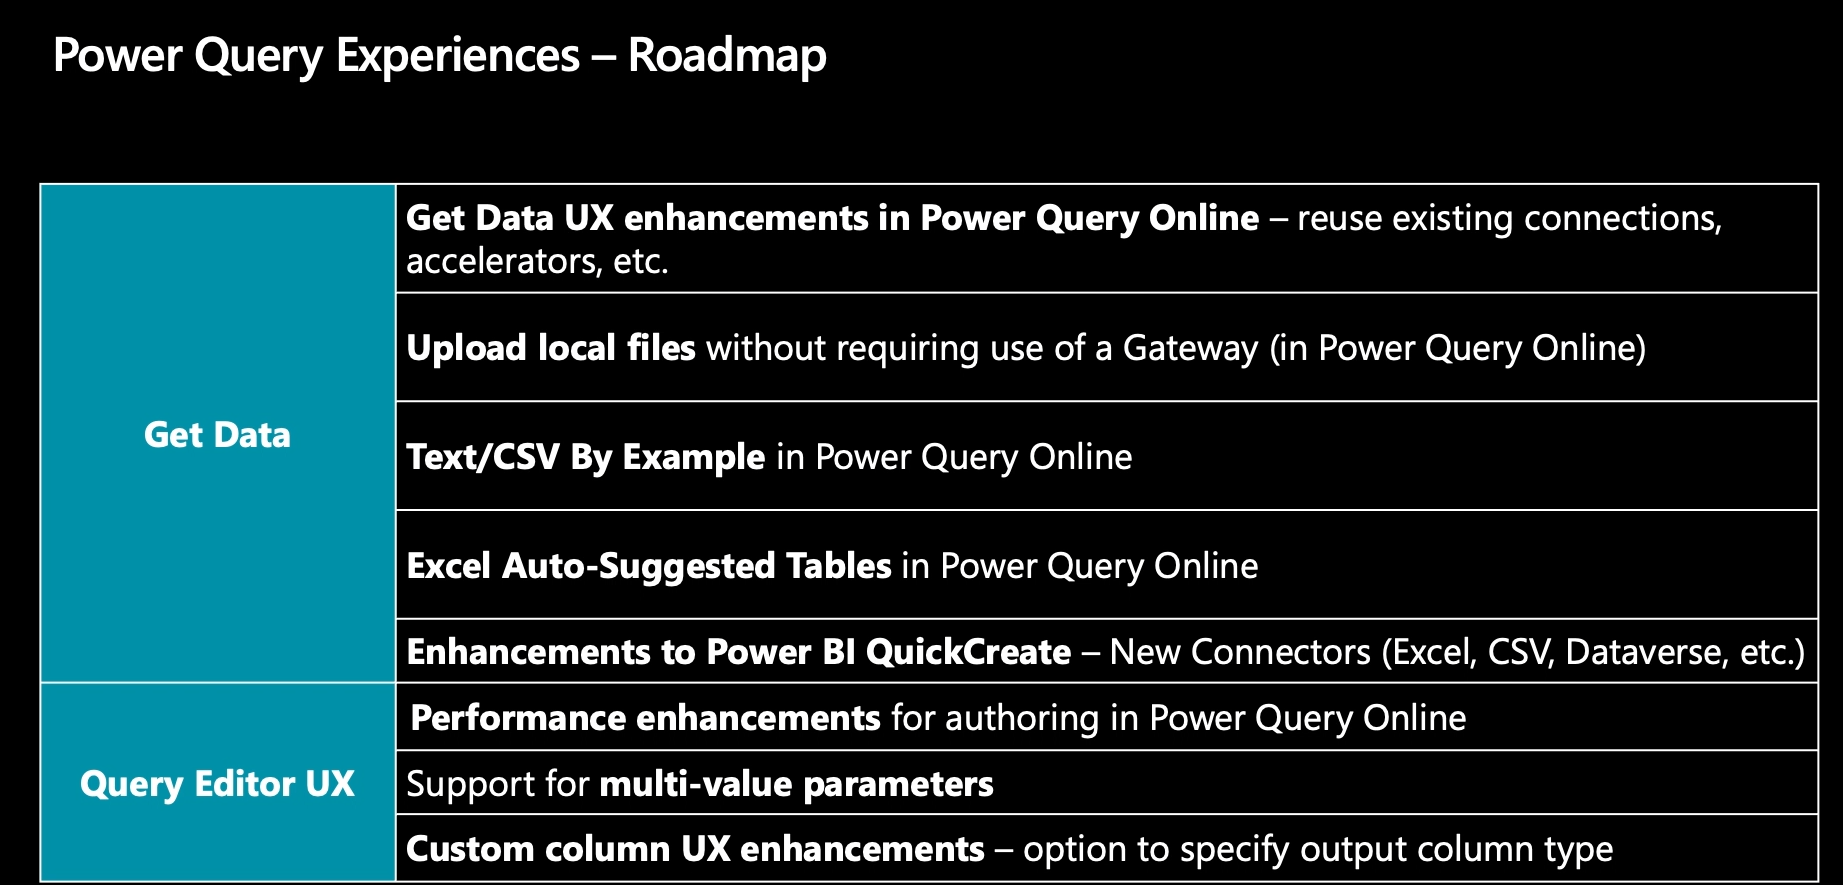
Power Query team has a great roadmap of upcoming features, which worth checking out and tuning in for it.
Video
Summary
In a nutshell, Power BI is up to many amazing upcoming features. I highly recommend watching the below sessions to learn more about the features mentioned:
- Data Prep in Power BI, Power Platform and Excel using Power Query
- Easily share insights with Power BI, Microsoft Teams and Excel
- Supercharge your applications with Power BI Embedded analytics
- Goals in Power BI
- Power BI (Peek into the future Part 1): Vision & Roadmap
- Power BI (Peek into the future Part 2): Analytics for everyone


Reza is author of more than 14 books on Microsoft Business Intelligence, most of these books are published under Power BI category. Among these are books such as Power BI DAX Simplified, Pro Power BI Architecture, Power BI from Rookie to Rock Star, Power Query books series, Row-Level Security in Power BI and etc.
He is an International Speaker in Microsoft Ignite, Microsoft Business Applications Summit, Data Insight Summit, PASS Summit, SQL Saturday and SQL user groups. And He is a Microsoft Certified Trainer.
Reza’s passion is to help you find the best data solution, he is Data enthusiast.
His articles on different aspects of technologies, especially on MS BI, can be found on his blog: https://radacad.com/blog.
This is a great list. Thank you for saving me the time of having to put it together. 🙂
Hi Reza,
Amazing post and always a pleasure to read. Was wondering if you know anything about the Hybrid Tables. Not sure if they were ever on Microsoft’s planned waves, but I can’t find them now. Has the feature been backlogged?
I need direct query for the last day records for a very large dataset, would you say a composite model with this same fact table in DQ and Import mode (filtered appropriately to avoid matching dates) would be the best option with what is available so far?
Thanks!
Paul
Hybrid tables should be a good use for your scenario.
In the meantime, there are a number of options you can use. one option is to create an aggregation with monthly/quarterly snapshots for older dates, and daily for new dates. This should give you a near direct query scenario.
Cheers
Reza