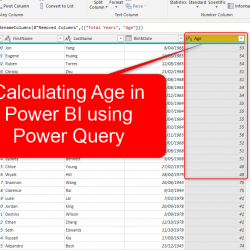
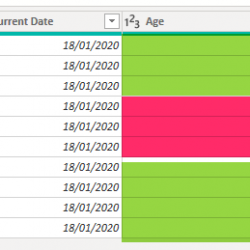
Scheduled Snapshot of the Power BI Data and Report

How many times you have been thinking to see is this possible to store the data of the Power BI report every day, every week or month. How many times, you thought of how to take a snapshot of the data in the Power BI dataset or report at a specific point of times? Well, Read more about Scheduled Snapshot of the Power BI Data and Report[…]

Using Data Category to Have a Better Visualization in Power BI

There are some field properties in Power BI such as formatting, which is obvious to use. However, some configurations on the field level, such as Data Category, is not very well known. Data Category is a configuration that can be helpful in multiple visualizations, In this short article, I’m explaining how to use this option Read more about Using Data Category to Have a Better Visualization in Power BI[…]

Get Images from Web Page Into the Power BI Report Using Power Query

Power Query can connect to a web page and get data from there, and I have explained it before in my article about movies data analysis. However, the default way of getting data from the web page doesn’t fetch images into your report. Images in a webpage come through their own URL. If you can Read more about Get Images from Web Page Into the Power BI Report Using Power Query[…]

Some Simple Ways to Debug Your DAX Measure Code in Power BI: Debugging Virtual Tables

Debugging DAX codes can be sometimes a bit of challenge, especially because measures are dynamic in their nature, and you won’t see their values in the data tab of Power BI, you will see their value when they are evaluated in a visual. Because sometimes measures are using nested functions and tables, the whole process Read more about Some Simple Ways to Debug Your DAX Measure Code in Power BI: Debugging Virtual Tables[…]

Find Error DAX Expressions, Export Tables, Gateway and APP Documentation all in Power BI Helper July 2019 Edition

What if you can find all details about DAX measures, and find all of the expressions that have an error in their syntax? Power BI Helper July 2019 version can do that for you. But not just that, it can also export a data table into CSV format, no matter how big it is. In Read more about Find Error DAX Expressions, Export Tables, Gateway and APP Documentation all in Power BI Helper July 2019 Edition[…]

Find the Best, Worst, and Middle Values Using Simple Clustering with Power BI Scatter Chart

Machine Learning and AI can be advanced areas, however, there are some easy to use methods for that especially in the Power Platform and Power BI. Leila has written tons of blog articles about AI in Power Platform. However, as a visualization point of view, I want to show you a feature that you might Read more about Find the Best, Worst, and Middle Values Using Simple Clustering with Power BI Scatter Chart[…]

What Fields to Hide in Your Power BI Solution?

To tidy up your Power BI solution, there are some options, and one of them is hiding fields from the report view. This option, although simple, has a significant impact on making your Power BI solution very tidy and clean and easier to maintain. However, you might wonder what are fields that have to be Read more about What Fields to Hide in Your Power BI Solution?[…]

Conditional Column in Power BI using Power Query; You can do anything!

There are many scenarios that you might want to implement a conditional expression. When the conditional expression’s logic is on a row-by-row basis, the best is doing it in Power Query rather than DAX (there are exceptions always), The Add Conditional Column in Power Query is a very helpful option, but often many people find Read more about Conditional Column in Power BI using Power Query; You can do anything![…]

Organize Power BI DAX Measures in Folders

Although very simple, still I see many Power BI reports with no organized way of separating measures. When you use Power BI for a while, you will gradually have more DAX measures and calculations, and having them organized under folders is always helpful. In this very short article, I’ll explain how you can use Display Read more about Organize Power BI DAX Measures in Folders[…]

Budget vs. Actual Model in Power BI: Calculations and DAX

In the previous article, I explained how you can build a data model for budget vs. actual, where the grain of the two fact tables is different. The model works perfectly as a star schema. As long as you slice and dice data in the level of granularity that both tables support, then you don’t Read more about Budget vs. Actual Model in Power BI: Calculations and DAX[…]