Integrate Power BI into Your Application: Part 3 – Embed Content
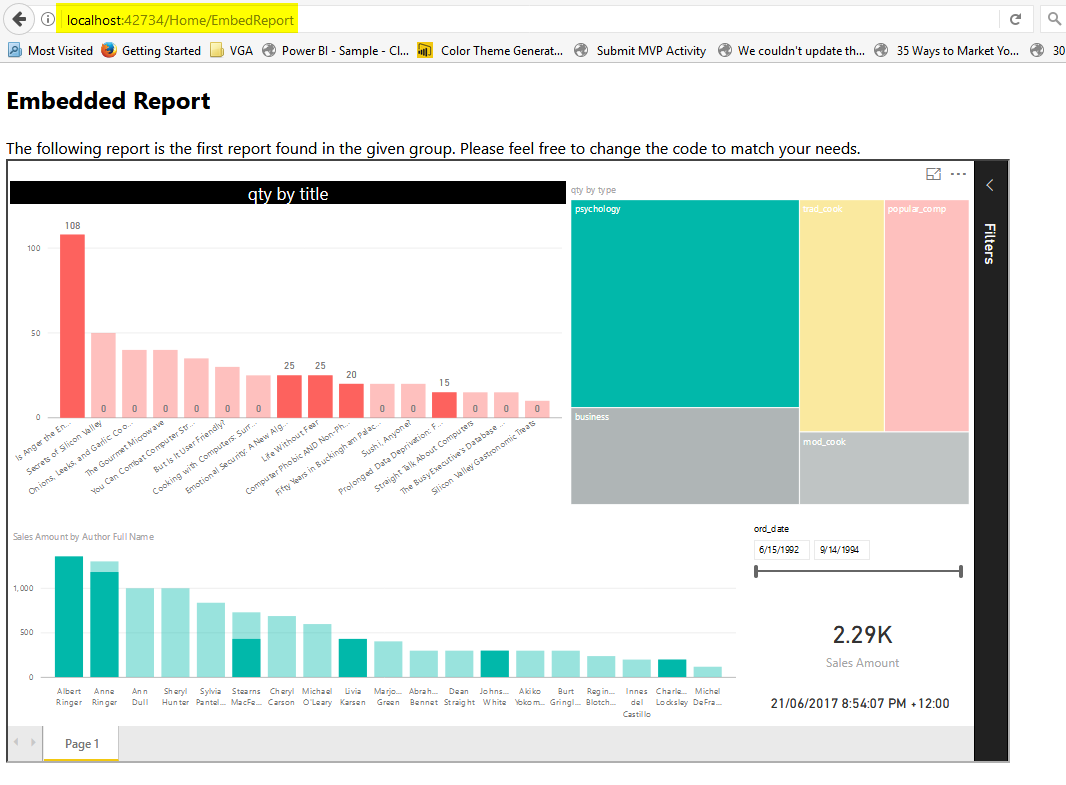
In the part 1, you learned how to register an application to be able to interact with Power BI service and Azure environment. In the part 2, you learned how the authentication process works and how you can get the access token. In this part, I’m going to explain what is the process of embedding Read more about Integrate Power BI into Your Application: Part 3 – Embed Content[…]