
In the previous posts from Part 1 to 6, I have explained how to do machine learning process.
The data cleaning such as SQL transformation, select specific columns, remove missing values, Edit meta data, and normalize data. Also, I have explained how to find relevant attributes using Feature Selection Feature to identify which feature are more important than the other. Then I shown how to split data using Split Data component to train and test the model. Then, I show how to train and test the model.
In this post I will show how to evaluate the results and also how to interpret the evaluation measures.
So in the previous Part we came up with the below process. we just create a model (see below picture)
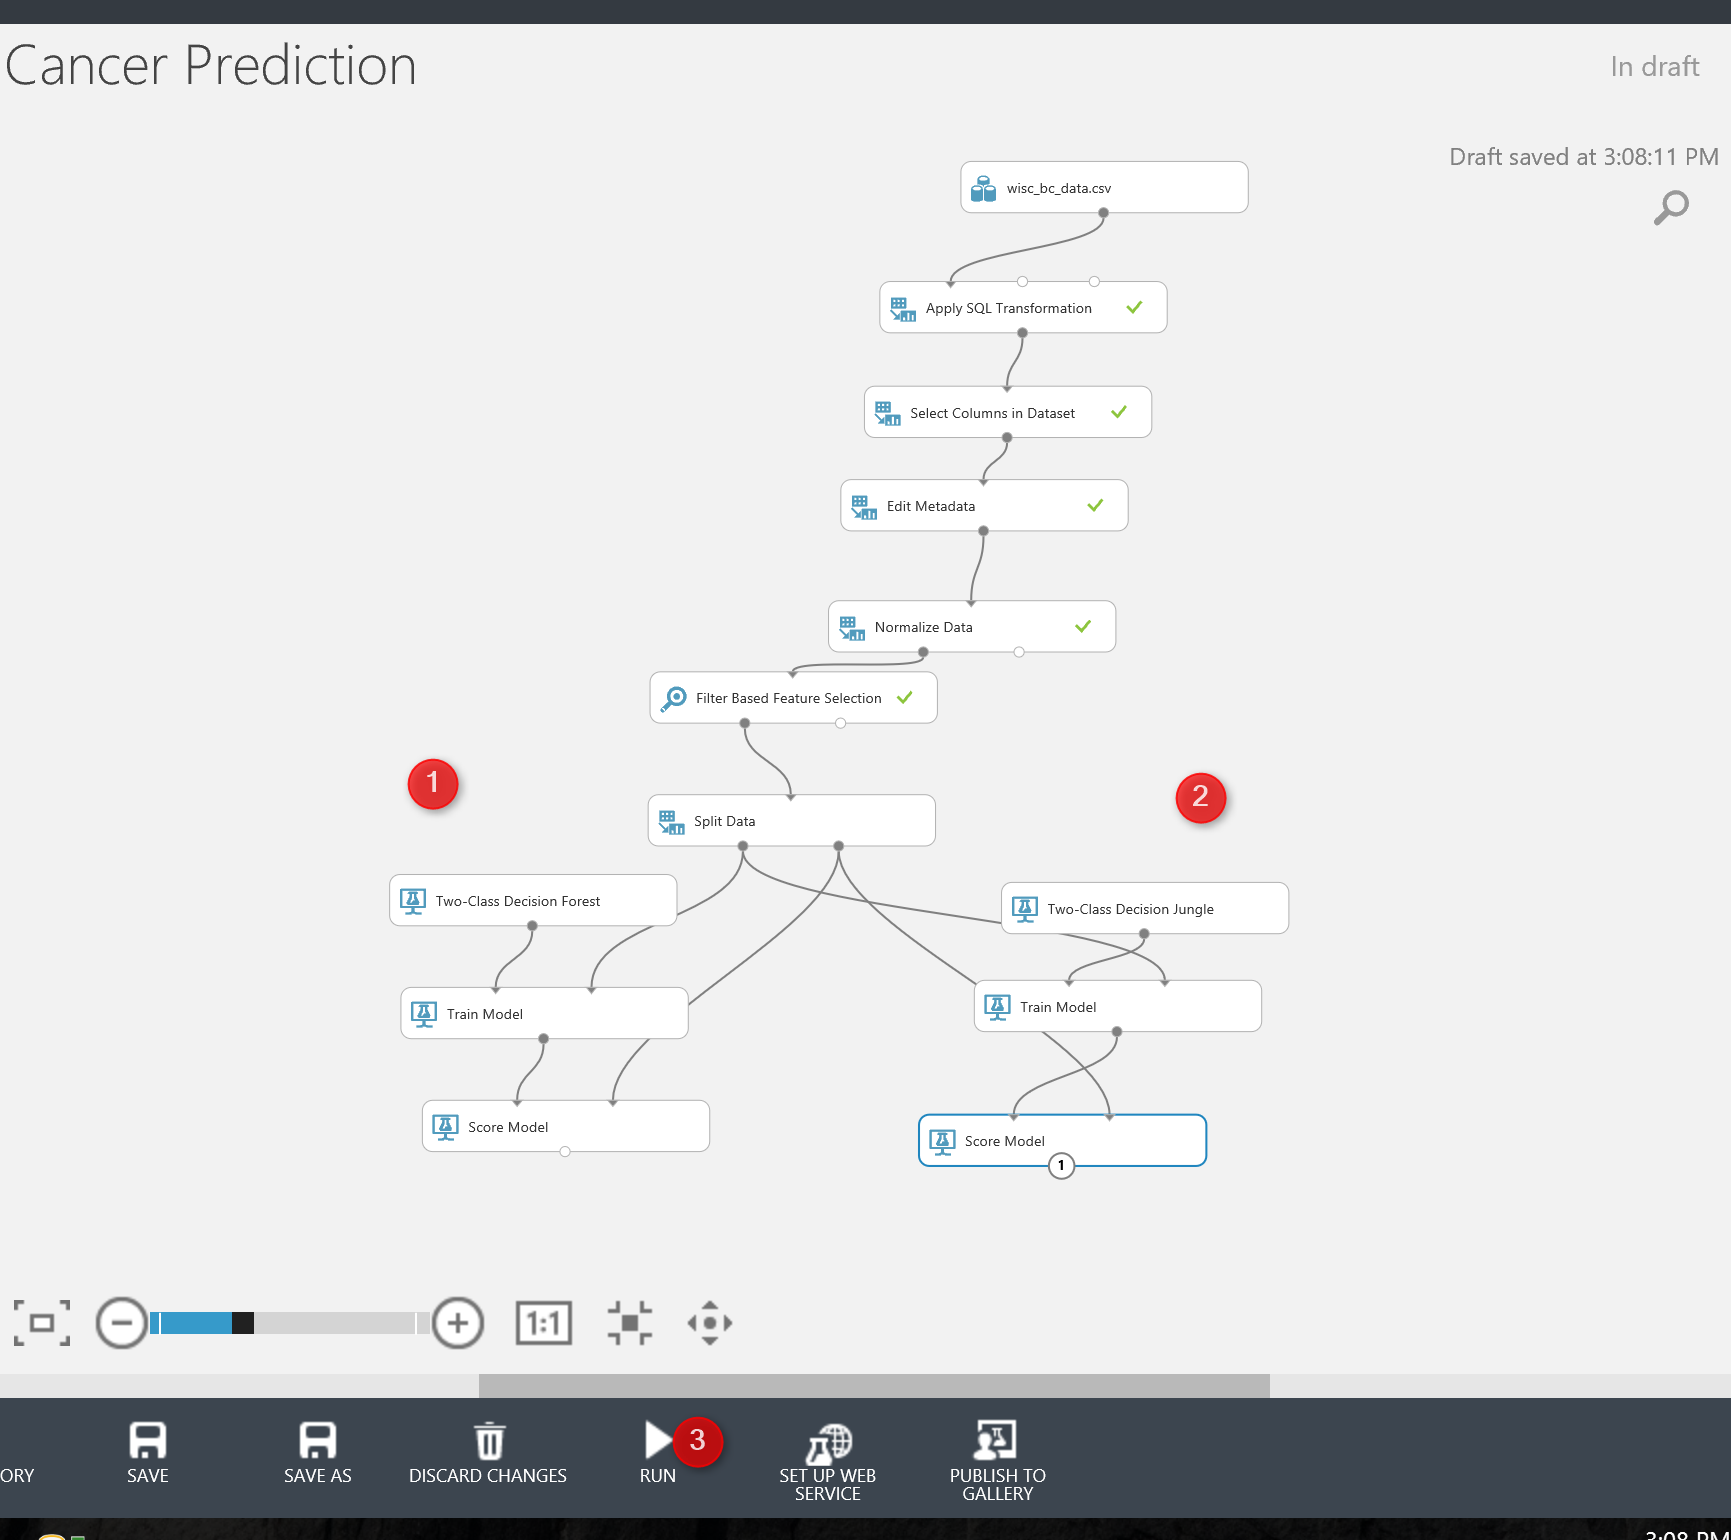
Now we need to evaluate the model. There is a component name Evaluate Model. Just drag and drop it to the experiment area (see below picture) . Evaluate model has two input node. In this experiment, we have two models, so we have two score model (as you can see in the below picture). Then connect the output node of Score Model (Testing) to the input of Evaluate Model (see number 2 and 3).

Now lets check the Evaluate model components.
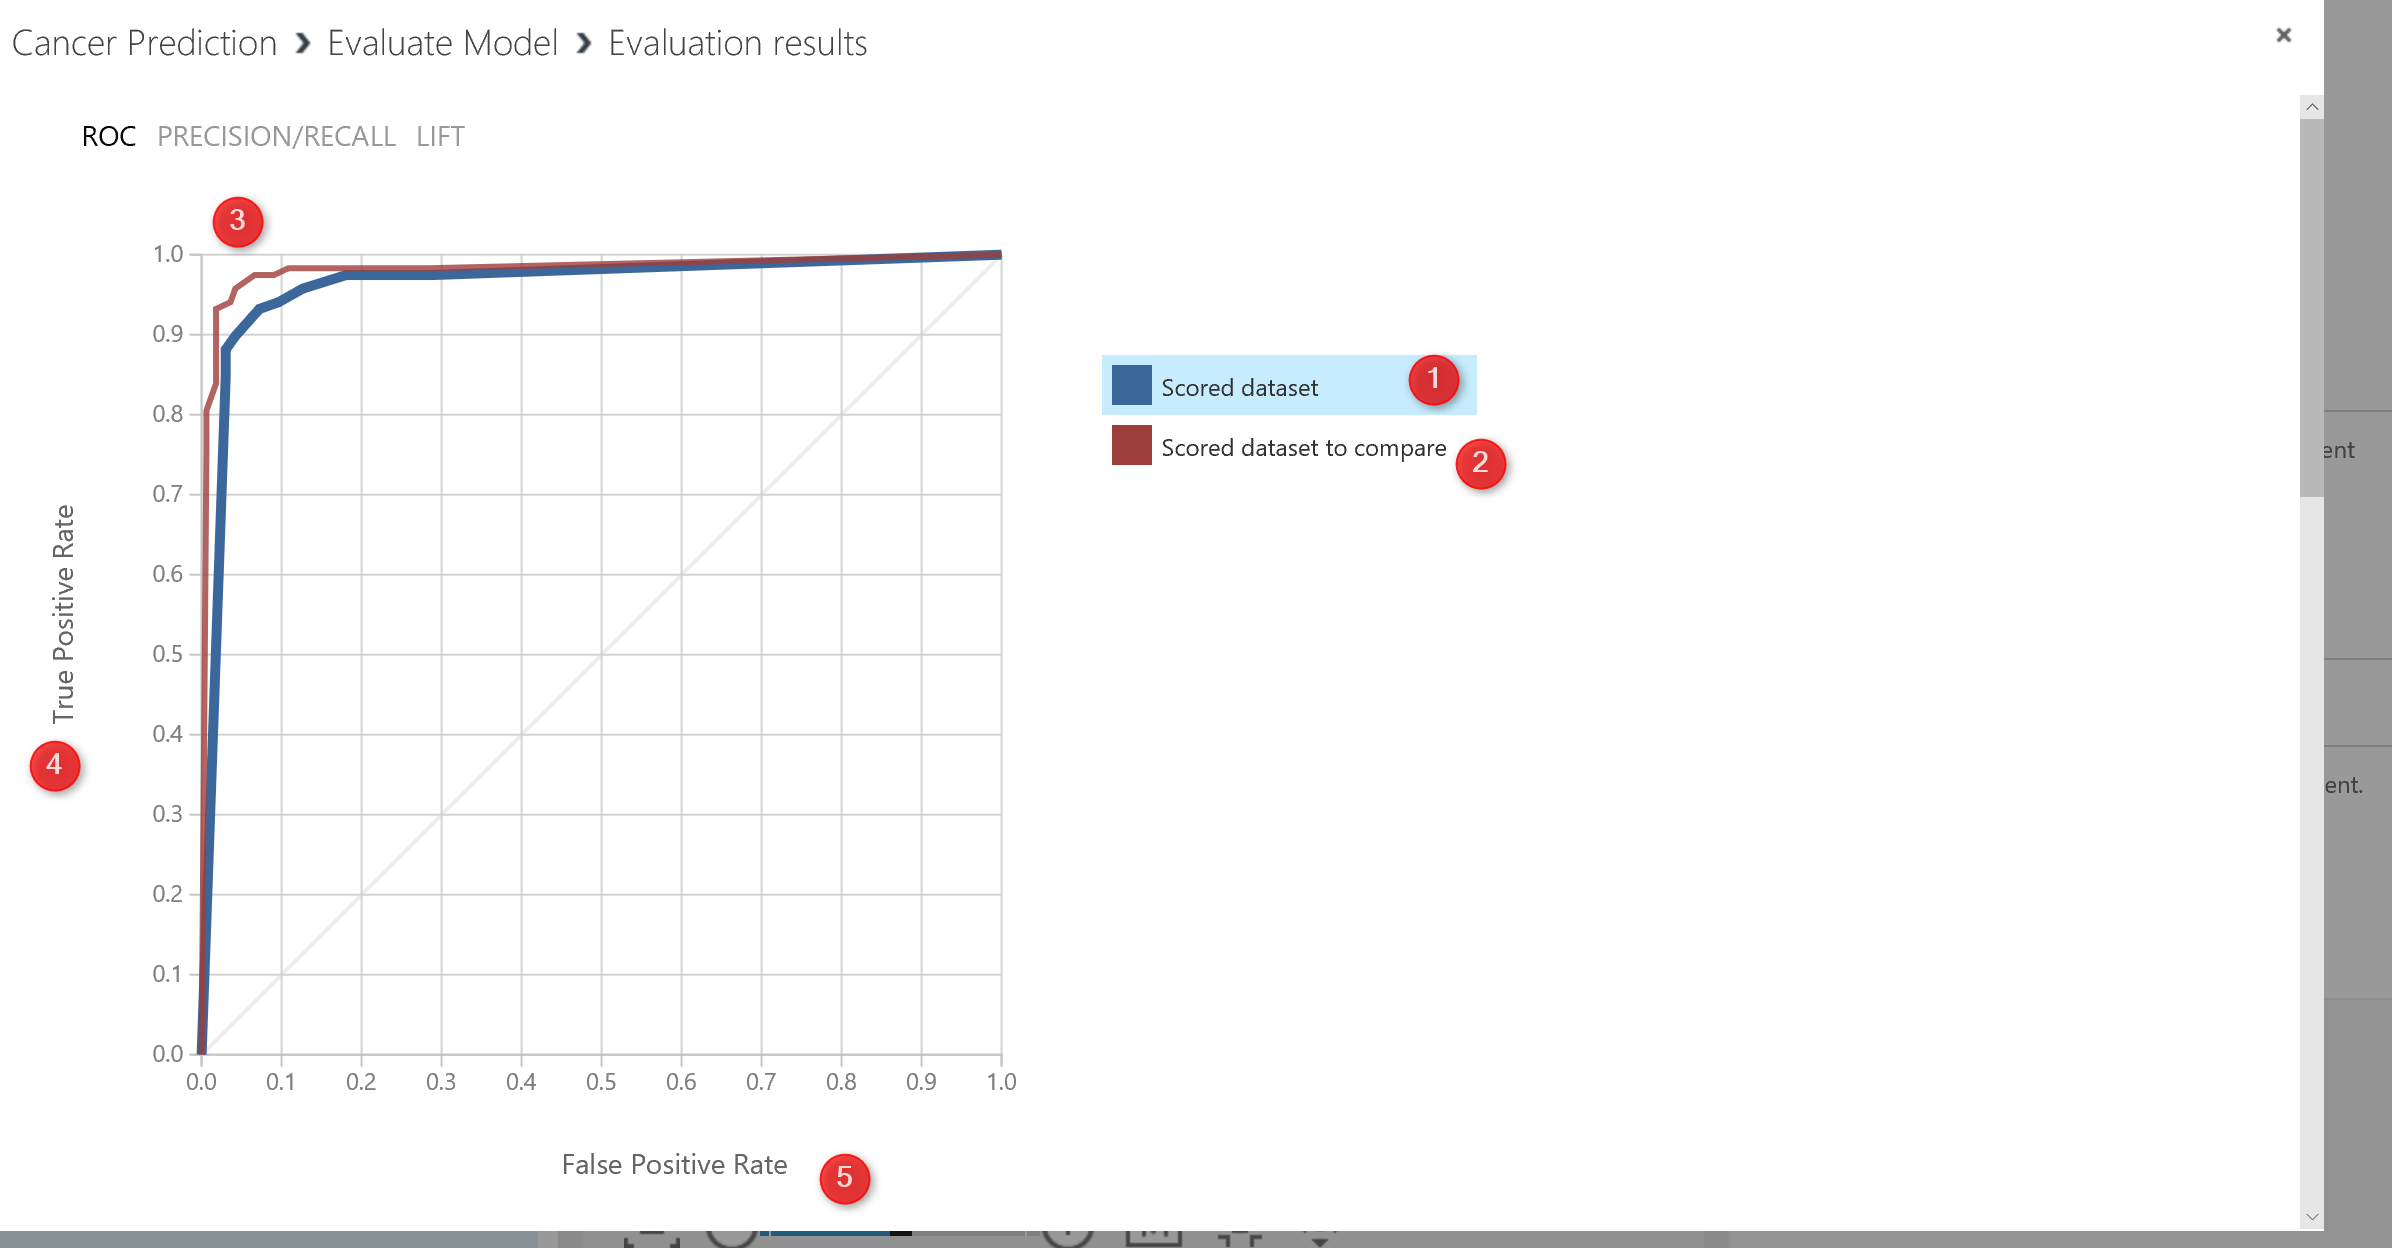
just right click on the output node of the Evaluate Model to see the result of the evaluation via Visualize icon. You will see the below image right after. We have a chart as below. the legend show to colour as blue and red. The blue one is related to the left side algorithm (in our experiment) and the red one related to the right side algorithm)used to check the performance a two-class algorithm.
in this chart the first chart is “ROC” is receiver operating characteristic curve. The plot is use to check the performance of the binary classification. we have two value in x and Y axis. True Positive and False Positive Rate.
But, what is True Positive and False Positive ?
In a Two-Classification Problem, the prediction and real world scenario may have below situation. The evaluation will look at the test dataset to compare the
True Positive: if values in real world is 1 (for instance in our example, Benign) and out algorithm correctly predict patients will Benign so we call it true positive (the higher number better) 🙂
False Negative: In the real world scenarios, the patient become Benign but in our algorithm predict they will Malignant. which means in real case it is true but in Prediction it is Negative. 🙁
False Positive: In real world scenario, the patient become Malignant but in our model, we predict they are Benign which is incorrect so we call it False Positive. 🙁
True Negative: In real word scenario, the patient become Malignant and our machine learning pr3ediction is that they will become Malignant 🙂
So in ROC chart as below we are going to see the relation between True Positive and False Positive. As you can see below picture, as the line close to the Y axis, it means that it is has better performance. That in below picture both charts has good performance.
if you scroll down the evaluate model page, you will see the below picture . as you can see we have some values that help us to evaluate the mode’s performance.
first we have the True Positive, False Negative, true negative and false positive value in the right side of the page (below picture number 1).
Also we have some other measure for evaluating the model performance:
Accuracy: The accuracy is about the (∑TP+∑TN)/Total population
So in the below picture in number 2, you will see it is 93%. as much as accuracy higher better.
Recall: The recall is the ∑TP/(∑TP+∑FN). That measure how model is good in predicting the true positive cases comparing the total case that happen true. in our example is 93%.
Precision: The precision is the ∑TP/(∑TP+∑FP) . in our example is 90%
F1 Score: The F1 Score is the ∑2TP/(∑2TP+∑FP+∑FN) which is 91%.
The bar chart for Threshold and AUC (the area under the ROC curve) shown in below picture. It shows 94% which is great. The Threshold for 50% . so it always good to have a AUC more than
threshold, which means more True positive than False Positive.

Over all, all the two algorithm perform well.
As I have mentioned it, to enhance the performance algorithms, there are three main approaches:
1. it always recommend to run multiple algorithms to see which algorithms best fir the dataset and able to predict the data better.
2. Do Cross Validation, to check the result of Machine Learning on each dataset sample
3. Check the different parameters for algorithms. each algorithms has its own parameters list, it is important to find the best parameters that cause better performance. This can be done in Azure ML via Hyper Tuning Parameters.
In the next Post I will show how to enhance the performance of model via Cross Validation and Hyper Tune Parameter Component.


