Anomaly Detection in Power BI
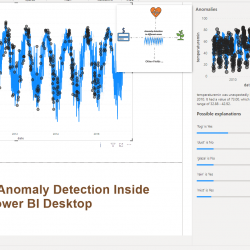
Anomaly detection is one of the popular topics in machine learning to detect uncommon data points in the datasets. For example, in a greenhouse, the temperature and other elements of the greenhouse may change suddenly and impact the plant’s health situation. Identifying the anomaly data in a credit card transaction, or in health data received Read more about Anomaly Detection in Power BI[…]