
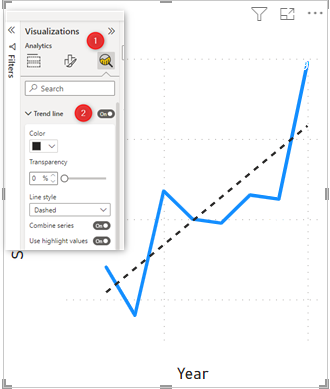
Calculating the trend of a line chart can be possible using the Analytics tab under the format section of the chart.
What if we need to store this calculation and reuse it or show it as a separate chart?
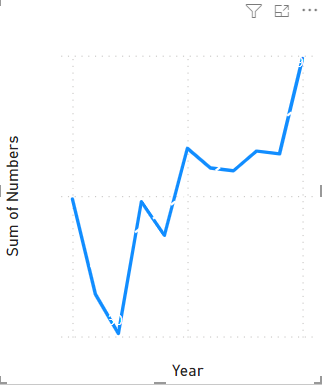
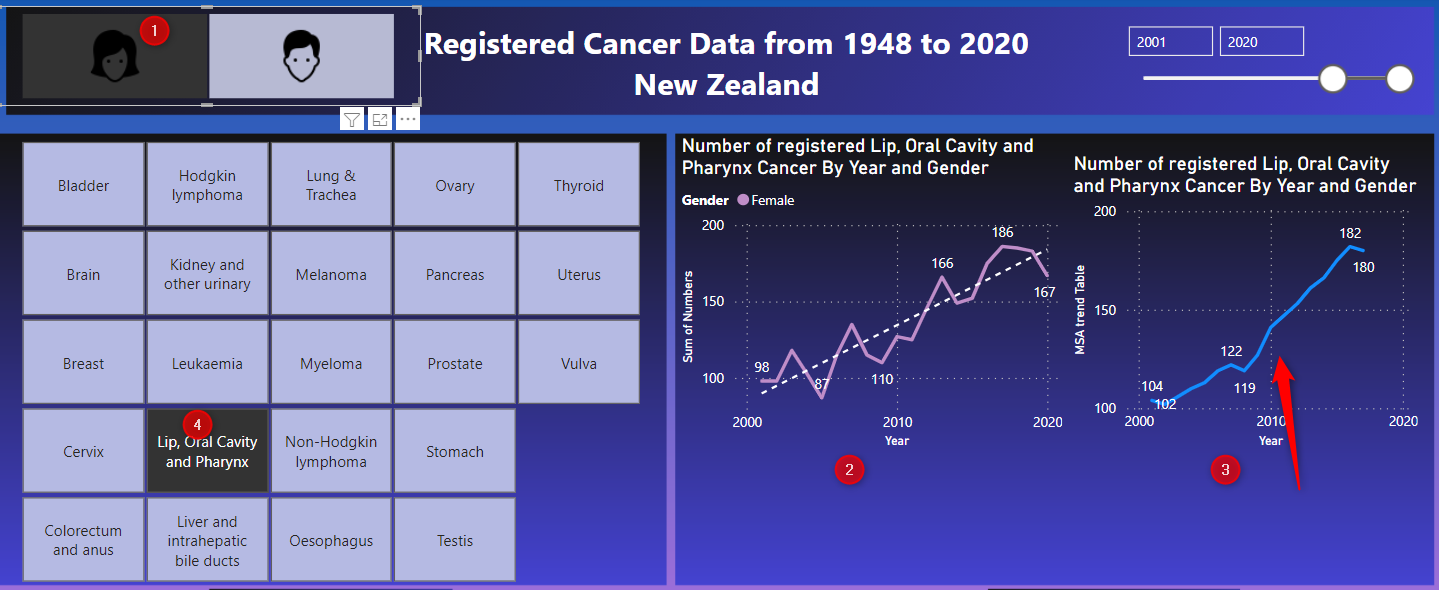
Actual Chart as below
The trend of the chart

The first question is about calculating the trend of a line chart or any data with time and value. There are many ways of calculating the trend of data.
One simple way that helps to calculate the trend of a chart is the Moving average.
What is the Moving average?
Imagine I have the below data. This data is about the number of Overy cancer in New Zealand from 2013 to 2020. We aim to calculate the average of 3 rows of data and replacing with the first row, which we call it Moving Average for N time.
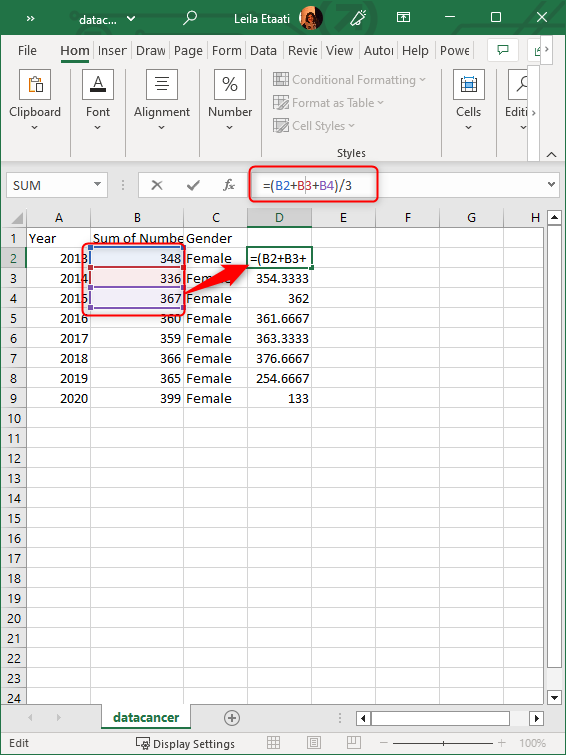
We continue to do it to calculate for the second row as
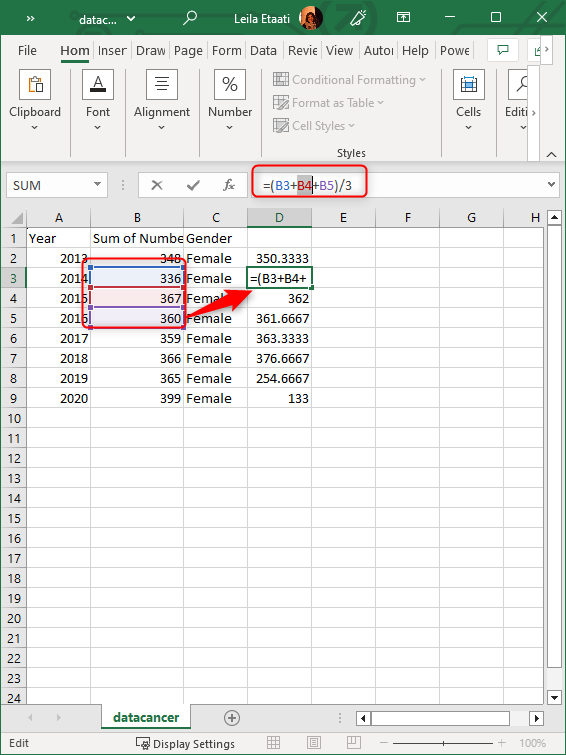
The calculation will be done for all rows, till we don’t have the anymore data ahead ( 3 rows ahead) as you can see it will finished on row 2018 as 2018 is the average of 2018, 2019 and 2020.
so in the moving average we will miss some data point but replacing with average of data.
Less data point but help us to see a clear trend.

Using DAX to calculate the Moving Average
As I struggled with tongue cancer, I get interested to check the data related to it. I get some data about oral cancer from New Zealand Statistic website, As you can see in below report, for women from 2001 to 2020 is increasing unfortunately. the first line chart show the original data with a line chart that the trend option is on.
the second chart is the calculated trend using moving average calculation for each 3 period ( year in this example)
MSA trend Table =
var currectyear=SELECTEDVALUE(Registered[Year])
var years_=FILTER(ALLSELECTED(Registered),Registered[Year]<=currectyear+2 && Registered[Year]>=currectyear)
var nextrecordsum=SUMX(years_,Registered[Numbers])
                        return
                        if(COUNTROWS(years_)=3,
                       ROUND( nextrecordsum/COUNTROWS(years_),0))
I could not create a table measure as everything change by context.
in first variable
var currectyear=SELECTEDVALUE(Registered[Year])
I stored the selected year ( current year selected ) in currentyear variable
in next calculation
var years_=FILTER(ALLSELECTED(Registered),Registered[Year]<=currectyear+2 && Registered[Year]>=currectyear)
I need to find the next two years in one table, so first I filter all my table ( table name is Registered) all years greater than or equal current year
so for example if the selected year is 2012, it is going to filter the whole Registered table to only include 2012,2013, and 2014
next I need to calculate the moving average using SUMX, Round function .
variable nextrecordsum holds the sum of all number of oral cancer data for above tabel ( in former example number of register cancer for 2012,2013 and 2014)
next we check if the number of rows is 3 if yes then we divide the calculated sum to the number of years
otherwise, it means we reach end of data
var nextrecordsum=SUMX(years_,Registered[Numbers])
                        return
                        if(COUNTROWS(years_)=3,
                       ROUND( nextrecordsum/COUNTROWS(years_),0))


