Data Preparation; First and Foremost Important Task in Power BI

I’ve talked about Data Preparation many times in conferences such as PASS Summit, BA Conference, and many other conferences. Every time I talk about this I realize how much more I need to explain this. Data Preparation tips are basic, but very important. In my opinion as someone who worked with BI systems more than Read more about Data Preparation; First and Foremost Important Task in Power BI[…]

Self Service BI- Power Query-Section 1: Search for Data

In this Video I tried to gather some information about Dog Breeds from different 3 websites : http://www.mans-best-friend.org.uk/dog-breeds-alphabetical-list.htm http://www.dogbreedslist.info/ https://en.wikipedia.org/wiki/List_of_dog_breeds I have explained how to get data from these websites even they don’t provide any API.    

TechDays Hong Kong 2015: Azure Data Factory vs. SSIS

6

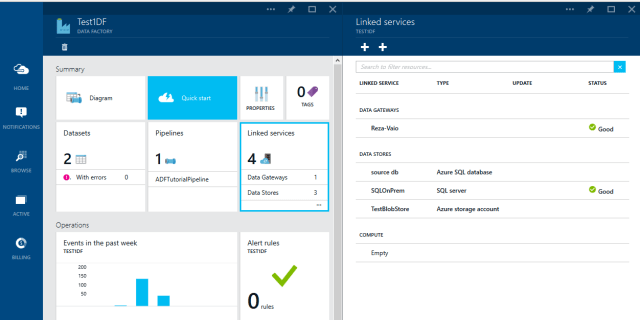
It has been long time passed from my presentation in Hong Kong TechDays 2015 on Mid February, I’ve been really busy so far and hadn’t chance to upload my presentation files here. I would like to thank all audience of my session on Azure Data Factory vs. SSIS, and provide you the link to my presentation slides. In this session you will see comparison between SSIS and Azure Data Factory on different factors such as developments, features, deployments, user experience, environment, and etc. For each comparison factor you will see a table comparison of these two products and their pros and cons for different situation.

[…]

DMX practice for Tourist Recommendation System

  there is a first experience with DMX I employed  DMX in my .NET code last year to create a travel mining model for predictions travel budget, length of travel, destination. I need to predict via different algorithms. so I have  added a reference to Microsoft.AnalysisServices.AdomdClient to my C# project using Microsoft.AnalysisServices.AdomdClient; public AdomdConnection connection = Read more about DMX practice for Tourist Recommendation System[…]

CodeCamp Christchurch 2015- SQL and BI

CodeCamp Christchurch 2015- SQL and BI I attended the CodeCamp Christchurch  2015 16th May. It was a great event. there are very nice presentation by Martin, Warwick, Simon and Nick .   there were plenty of nice sessions. I really enjoyed the power bi preview present by Simon.   my session started at 3.30 pm, Read more about CodeCamp Christchurch 2015- SQL and BI[…]

Walk-through Steps: I’m New to BI, Where to Start? – Part 0: Prerequisites

rady

This is the first part which published at the last! I previously published 7 posts for the series of “I’m New to BI, Where to Start?”. However I got some feedback from audience that are not coming from the world of Database, and they are not familiar with relational database structure, primary keys, foreign keys, constraints, indexes, T-SQL…. So I felt the requirement for a preliminary post that links to some references to have better understanding of prerequisites to starting BI. Business Intelligence is the art of fetching information to support decisions based on the story behind the data. With this definition the first and foremost prerequisite is to understand data and how to work with it.

[…]

Walk-through Steps: I’m New to BI, Where to Start? – Part 7: Azure

Many organizations nowadays are in transition from on-premises to cloud, and many of them use hybrid solutions where part of the computing will be done in cloud and the rest on-premises. The trend nowadays is to use cloud to have better maintenance, lower costs, more reliable solutions, lower administrative efforts, and powerful shared resources. In BI world there is a high demand for solutions to be on cloud, some computing services such as data transfer and ETL to be done on cloud, some data analysis and mining solutions happens on cloud, and even data to be stored on cloud data warehouse at some stage. There are many BI vendors in the market, but there are few who provide BI on the cloud.

[…]

Walk-through Steps: I’m New to BI, Where to Start? – Part 6: Data Mining

dmm

Data Scientist is a hot job nowadays in the market and there are lots of demand for it. Data Science origins from the BI field and sits under umbrella of Business Intelligence, because the data science and data mining helps decision makers in their decision making process. To have an idea about how data mining can solve real world issues, think about loyalty program of the super market that you usually use close to  your home. Loyalty program simply analyze your purchase history and based on that it comes up with some suggestion and prediction about your next purchases and will promote that through your cell phone text messages or email or even flyers directly addressed to your home address.

[…]

Walk-through Steps: I’m New to BI, Where to Start? – Part 5: Power BI

pbi

Power BI is not a strange word these days, there are many blog posts, videos, news, and speakings about it. Power BI is Microsoft Cloud BI services that released recently. Power BI is not only Cloud BI but also it offers good self-service BI stack as well. Power BI has five main components which are:

  • Power Query: For data extraction, transformation, and load into model.
  • Power Pivot: Data Modelling tool.
  • Power View: Data Visualization tool
  • Power Map: 3D Geo-spatial data visualization tool.
  • Power Q&A: Engine for natural language questions and answering

[…]

Walk-through Steps: I’m New to BI, Where to Start? – Part 4: Data Visualization

logo

Data Visualization is the front end of your BI system. It will be seen from the user’s point of view as the whole BI system! The reason for that is users only will see this part of the BI system, they won’t see Data Warehouse, ETL,  andData Governance… What they see is only dashboards and charts explaining data values. So it is essential to do the data visualization right and effective. A good data visualization should be able to tell story behind the data. A bad data visualization won’t help users even if you have a good data warehouse or ETL design. So you should spent time to analyze ever dashboard, chart, and table and make that a good story teller to the user.

[…]