Power BI From and To Date Filtering with One Slicer

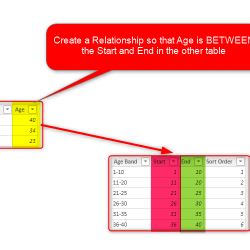
It happens that you might have two fields as From and To date (or Start and End date) in your dataset, and you want a date slicer in the report. The date slicer has to filter records in a way that the FROM and the TO dates are in the range of dates selected in Read more about Power BI From and To Date Filtering with One Slicer[…]

Power BI Pattern: Find Start and End Date of Task from Children

The project and task planning management systems have the concept of each task starting and ending with a date. Tasks can be a child of other tasks, and the parent tasks should take the whole range that the child task’s date includes. You need to parse the parent-child hierarchy of tasks (which can be many Read more about Power BI Pattern: Find Start and End Date of Task from Children[…]

Power Query Transformation Pattern: Convert Status Log Dates Table to Start and End Date Table in Power BI

I have previously explained how to analyze the data of a status log table and a from/to date table (like a subscription pattern). I also explained that in some scenarios a from/to table works better than a status log table. In this article and video, I’ll explain how you can transform or convert a status Read more about Power Query Transformation Pattern: Convert Status Log Dates Table to Start and End Date Table in Power BI[…]

Power BI HR Pattern: DAX Measures for the Last Position to Date: Last Status to Date

One of the common patterns in Power BI is to have a table with different statuses throughout time and then wanting to get the latest status up to a selected date. A simple example of that is to have a table with position(role) changes of employees and then wanting to see their latest position based Read more about Power BI HR Pattern: DAX Measures for the Last Position to Date: Last Status to Date[…]

Subscription Pattern in Power BI – DAX Measure for Active Subscribers or Open Tickets For All Dates

One of the common patterns of a data model is the subscription pattern. In this pattern, we have subscriptions (or tickets, or issues, or whatever else you want to call it) open date and close date. The way that this data is stored in a table makes it a bit challenging to get informative insight Read more about Subscription Pattern in Power BI – DAX Measure for Active Subscribers or Open Tickets For All Dates[…]

Dynamic Banding or Grouping in Power BI – Using DAX Measures – Choose the Size of Bins

In the previous article/video, I explained how to create dynamic bins by choosing the count of bins in a slicer in the Power BI report. In this article, I’ll explain, how you can do it the other way around, which is by selecting the size of the bin, you will have bins and buckets dynamically Read more about Dynamic Banding or Grouping in Power BI – Using DAX Measures – Choose the Size of Bins[…]

Dynamic Banding or Grouping in Power BI – Using DAX Measures – Choose the Count of Bins

Banding (or binning or grouping) is a scenario that can be implemented both statically and dynamically in Power BI. Dynamic banding means selecting the bin (or band) configuration, and the banding changes based on the user selection of the slicer. Imagine that we have a count of customers by their age groups, but then we Read more about Dynamic Banding or Grouping in Power BI – Using DAX Measures – Choose the Count of Bins[…]

Age Banding in Power BI Using TREATAS DAX Function – Relationship Based on Between

One of the most common types of banding or binning is banding based on a range. Let’s say, for example,  you want to have a group of customers based on their age group. The age group banding can be created in Power Query at the data transformation stage. It can be created using the Grouping Read more about Age Banding in Power BI Using TREATAS DAX Function – Relationship Based on Between[…]

Calculating Stock on Hand Using DAX: Power BI Inventory Model

You don’t have always the luxury of having a snapshot fact table that has the stock on hand value for every single day, at every single workshop, and for every single product. Even if you want to build such a table, it can get easily gigantic. In this blog post, I am going to show Read more about Calculating Stock on Hand Using DAX: Power BI Inventory Model[…]

Budget vs. Actual Model in Power BI: Calculations and DAX

In the previous article, I explained how you can build a data model for budget vs. actual, where the grain of the two fact tables is different. The model works perfectly as a star schema. As long as you slice and dice data in the level of granularity that both tables support, then you don’t Read more about Budget vs. Actual Model in Power BI: Calculations and DAX[…]