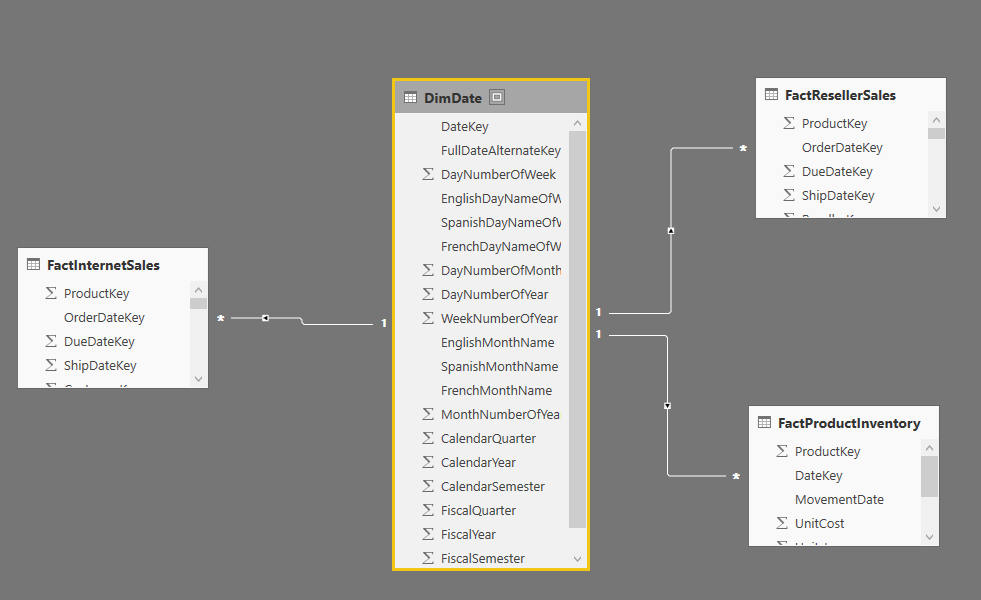
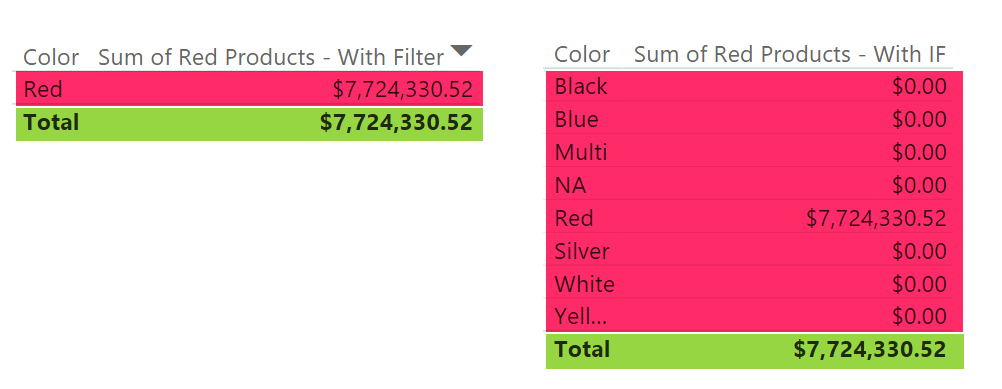
Do You Need a Date Dimension?

I’ve hear this question many times; “Do you think we need a date dimension?”.  some years ago, date dimension has been used more, but nowadays less! The main reason is that there are some tools that are using their own built-in date hierarchy. As an example Power BI has a built-in date hierarchy that is Read more about Do You Need a Date Dimension?[…]

Previous Dynamic Period DAX Calculation

Parallel Period is a function that help you fetching previous period of a Month, Quarter, or Year. However if you have a dynamic range of date, and you want to find the previous period of that dynamic selection, then Parallel Period can’t give you the answer. As an example; if user selected a date range Read more about Previous Dynamic Period DAX Calculation[…]

Stacked Chart or Clustered? Which One is the Best?

Column chart and Bar chart are two of the most basic charts used in every report and dashboard. There are normally two types of these charts: Stacked, and Clustered. At the first glance they seems to do same action; showing values by categories ans sub categories. However, they are different. Your storytelling of data would Read more about Stacked Chart or Clustered? Which One is the Best?[…]

Sort By Column in Power BI

Power BI users Sorting in most of the visualizations, you can choose to sort ascending or descending based on specified data fields. However the field itself can be sorted based on another column. This feature called as Sort By Column in Power BI. This is not a new or advanced feature in Power BI. This Read more about Sort By Column in Power BI[…]

Flawless Date Conversion in Power Query

Date Conversion is one of the simplest conversions in Power Query, however depends on locale on the system that you are working with Date Conversion might return different result. In this post I’ll show you an example of issue with date conversion and how to resolve it with Locale. In this post you’ll learn that Read more about Flawless Date Conversion in Power Query[…]

Append vs. Merge in Power BI and Power Query

Combining two queries in Power Query or in Power BI is one of the most basic and also essential tasks that you would need to do in most of data preparation scenarios. There are two types of combining queries; Merge, and Append. Database developers easily understand the difference, but the majority of Power BI users Read more about Append vs. Merge in Power BI and Power Query[…]

Data Preparation; First and Foremost Important Task in Power BI

I’ve talked about Data Preparation many times in conferences such as PASS Summit, BA Conference, and many other conferences. Every time I talk about this I realize how much more I need to explain this. Data Preparation tips are basic, but very important. In my opinion as someone who worked with BI systems more than Read more about Data Preparation; First and Foremost Important Task in Power BI[…]

Warning! Misleading Power Query Filtering

Filtering in Power Query component of Power BI is easy, however it can be misleading very easily as well. I have seen the usage of this filtering inappropriately in many cases. Many people simply believe in what they see, rather than seeing behind the scenes. Power Query filtering is totally different when you do basic Read more about Warning! Misleading Power Query Filtering[…]

Custom Functions Made Easy in Power BI Desktop

I have written a lot about Power Query M scripting language, and how to create custom functions with that. With recent updates of Power BI Desktop, creating custom functions made easier and easier every month. This started with bringing Parameters few months ago, and adding source query for the function in November update of Power Read more about Custom Functions Made Easy in Power BI Desktop[…]

Visualization Tip: Change to Filter instead of highlight Control the Interaction in Power BI Report

Power BI reports are highly interactive, If you select a column in a column chart other charts will be highlighted. Selecting a slicer value will filter all other visuals in the report. This interactivity can be controlled easily. Despite the fact that this feature has been released in early phases of Power BI, there are Read more about Visualization Tip: Change to Filter instead of highlight Control the Interaction in Power BI Report[…]