Step Beyond the 10GB Limitation of Power BI

Power BI free allows you to have 1GB data per user, and pro 10GB. However in many organizations you have much bigger size of data than 10GB, sometimes you deal with Tera bytes, even Peta bytes of data. Is Power BI limiting you for the visualization? Short answer; No! In this post I’ll explain you Read more about Step Beyond the 10GB Limitation of Power BI[…]

Pivot and Unpivot with Power BI

Turning columns to rows, or rows to columns is easy with Power Query and Power BI. There are many situations that you get a name, value data source, and wants to convert that into columns with values underneath. On the other hand many times you get multiple columns and want to change it to name, Read more about Pivot and Unpivot with Power BI[…]

Relationship in Power BI with Multiple Columns

You can create relationships in Power BI between tables. Relationships are useful for some functions to work across multiple tables and produce the result. Relationship between tables also makes visualization and report elements more efficient, because result of selection in one chart can affect another chart from different table. However there is a limitation in Read more about Relationship in Power BI with Multiple Columns[…]

Secret of Time Intelligence Functions in Power BI

If you be familiar with Power Pivot you know that there is a functionality in Power Pivot for setting a table as a Date Table. This enables time intelligence functions such as year to date to work properly over your data model. However this option is not available in Power BI Desktop. There is no Read more about Secret of Time Intelligence Functions in Power BI[…]

Scenarios of Using Calculated Tables in Power BI

Calculated tables first introduced in September 2015 update of Power BI Desktop. The name speak for itself; these are tables created by calculation. As these are in-memory tables their calculation is based on DAX (Data Analysis eXpression language). There are many benefits of using Calculated tables, such as using them for role playing dimensions (for Read more about Scenarios of Using Calculated Tables in Power BI[…]

Power BI Filled Map; the Good, the Bad, and the Ugly

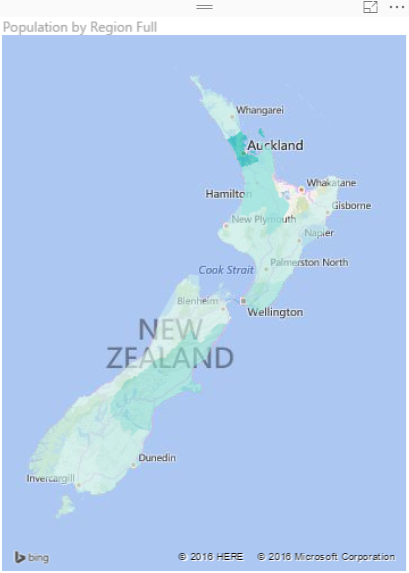
Power BI utilizes two built-in map charts; Map and Filled Map. Filled Map is a map that shows data points as Geo-spatial areas rather than points on map. Areas can be continent, country, region, state, city, or county. Working with Filled Map however isn’t as easy and convenient as the map chart is. You need Read more about Power BI Filled Map; the Good, the Bad, and the Ugly[…]

Power BI Q&A; How to Ask Questions?

In previous chapters of Power BI from Rookie to Rock Star you’ve learned that Power BI reports and models can be published in Power BI website for sharing, scheduling and some other purposes. One of the features in Power BI website which is unique to Power BI and is not available in many BI tools Read more about Power BI Q&A; How to Ask Questions?[…]

Custom Visuals in Power BI; Build Whatever You Want

In previous posts of Power BI from Rookie to Rock Star you’ve learned that Power BI has bunch of useful built-in visualizations such as bar chart, column chart, waterfall chart, tree map, and many other visualizations. However there is always requirement for new types of visualizations. You might want to visualize parts of the data Read more about Custom Visuals in Power BI; Build Whatever You Want[…]

Power BI and Spark on Azure HDInsight; Step by Step Guide

Power BI can connect to many data sources as you know, and Spark on Azure HDInsight is one of them. In area of working with Big Data applications you would probably hear names such as Hadoop, HDInsight, Spark, Storm, Data Lake and many other names. Spark and Hadoop are both frameworks to work with big Read more about Power BI and Spark on Azure HDInsight; Step by Step Guide[…]

Be Fitbit BI Developer in Few Steps: Step 3 Visualization

In previous steps you’ve learned how to extract and mash up the data from CSV and automate the process of looping through all CSV files in the source folder. In this step we are going to build visualizations based on the data set we’ve built so far. In this post you will see how easy Read more about Be Fitbit BI Developer in Few Steps: Step 3 Visualization[…]