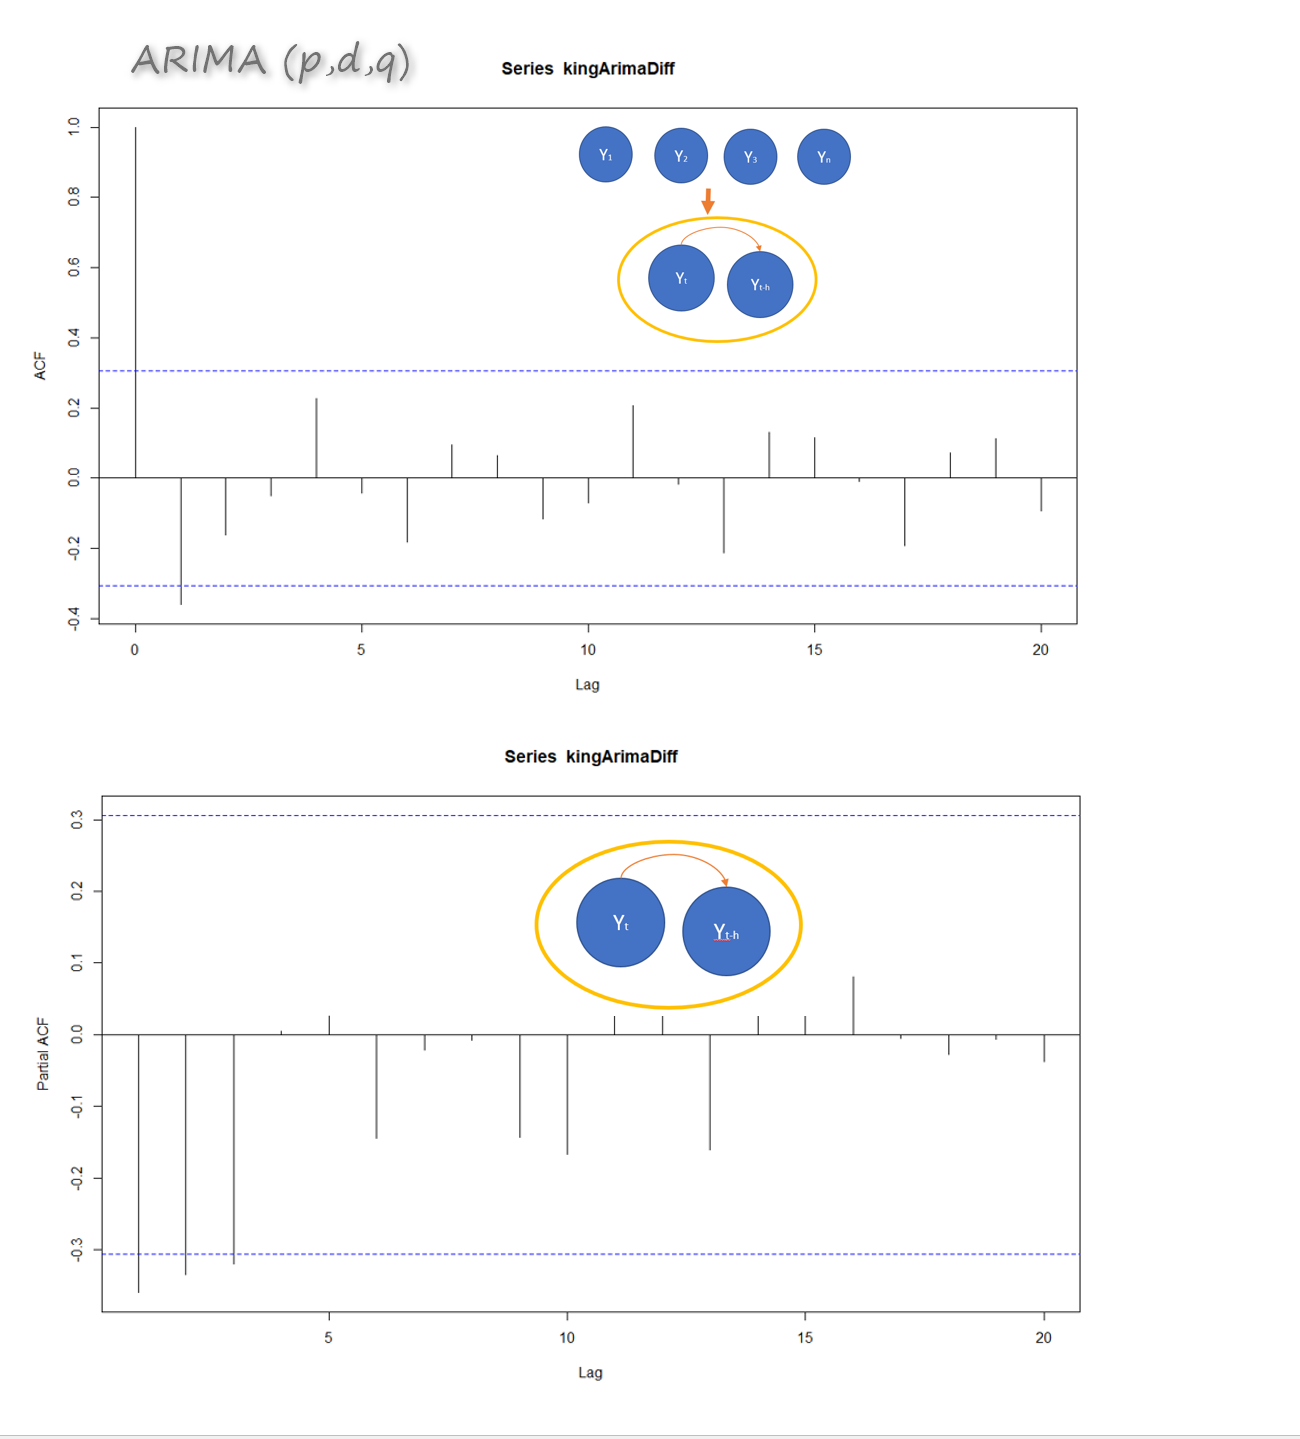
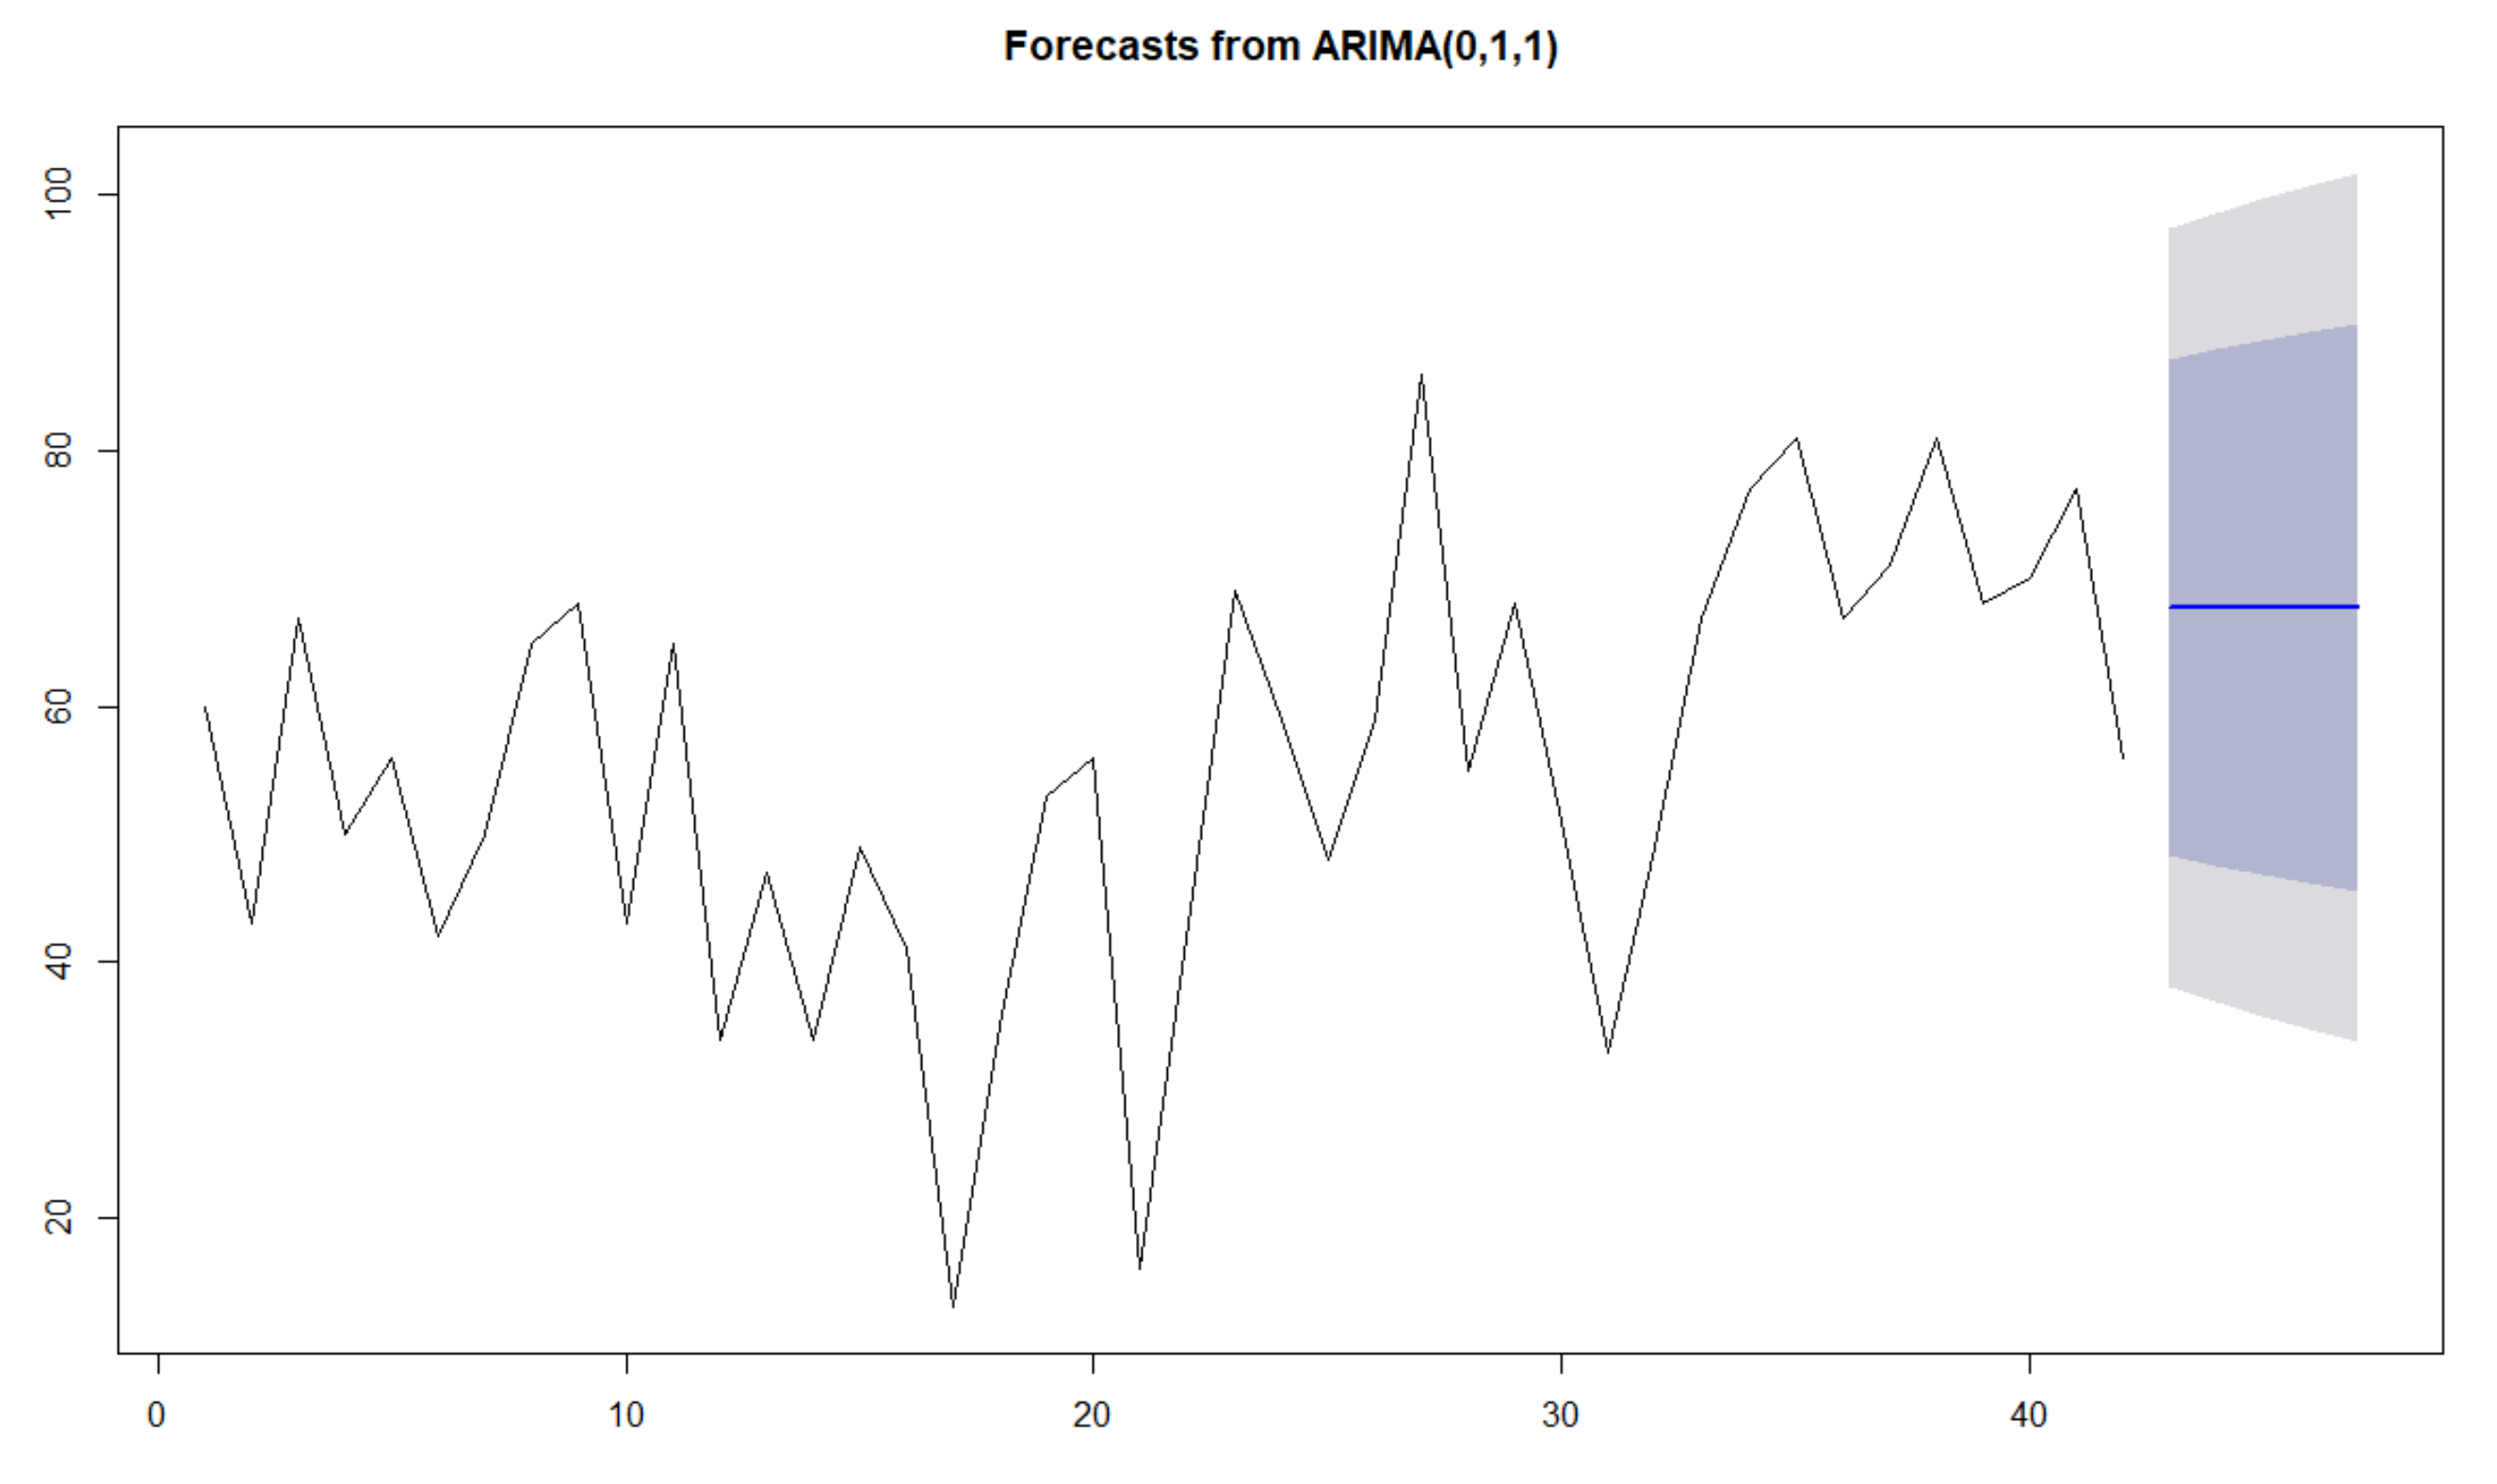
New Series of Time Series: Power BI Custom Visual (Part 7)

In the last three parts, I have explained about the time series R custom Visual we have in Power BI. as you remember we have 3 main time series chart in Power BI store (see below): Decompose of time series (trend, seasonality and irregular components). the two other custom visual help us to do forecasting Read more about New Series of Time Series: Power BI Custom Visual (Part 7)[…]

Create a Date Dimension in Power BI in 4 Steps – Step 1: Calendar Columns

I have written multiple blog posts so far about creating a date dimension. However, I still get the question about how to create a date dimension. In this series of blog posts I  am going to explain in details how you can create a date dimension easily in Power BI (based on Power Query). this Read more about Create a Date Dimension in Power BI in 4 Steps – Step 1: Calendar Columns[…]

New Series of Time Series: Power BI Custom Visual (Part 6)

In the last post, I have explained how to do time series forecast using “Exponential Smoothing” approach in Power BI. I start to explain the main parameters that we need to set up. The main concepts behind of most of these parameters have been explained in previous posts (Post 4, Post 3, Post 2, and Read more about New Series of Time Series: Power BI Custom Visual (Part 6)[…]

Solving DAX Time Zone Issue in Power BI

Power BI is a cloud service, and that means Power BI files are hosted somewhere. Some DAX functions such as Date/Time functions work on system date/time on the server their file is hosted on. So If you use DAX functions such as TODAY() or NOW() you will not get your local date/time, You will fetch Read more about Solving DAX Time Zone Issue in Power BI[…]

New Series of Time Series: Power BI Custom Visual (Part 5)

In previous posts, I have explained some basic concepts of time series. In the first post I have explained the basic concepts of time series, and in second and third posts I have explained: “Exponential Smoothing” for forecasting data without trend, and with the trend. In the last post, I have explained how we can Read more about New Series of Time Series: Power BI Custom Visual (Part 5)[…]

New Series of Time Series: Power BI Custom Visual (Part 4)

In this post, I am going to show how we can do time series inside Power BI using custom visual from Office store. First you need to download custom visual from office store, to download R custom visual please follow the below link https://store.office.com/en-001/appshome.aspx?ui=en-US&rs=en-001&ad=US&clickedfilter=OfficeProductFilter%3aPowerBI&productgroup=PowerBI   now we are going to download some timeseries custom visuals Read more about New Series of Time Series: Power BI Custom Visual (Part 4)[…]

Dates Between Merge Join in Power Query

Using Merge in Power Query gives you the ability to join on a EQUAL join with one or more fields between two tables. However, in some situations you need to do the Merge Join not based on equality of values, based on other comparison options. One of the very common use cases is to Merge Read more about Dates Between Merge Join in Power Query[…]

New Series of Time Series: Part 2 (Exponential Smoothing)

In the last post , I have explained the main concepts behind the timeseries. In this post, I am going to show how we can forecast for some periods. In the last post, I have mentioned that there is a possibility to have “seasonality” “Trend” and  errors (residual) in one dataset: Seasonality+Trend+Residual we call it as Read more about New Series of Time Series: Part 2 (Exponential Smoothing)[…]

Infographic Designer: Not Just Another Visual

At the time of writing this post; there are already more than 97 custom visuals posted in Office Store. The list includes many interesting custom visuals. However, Infographic Designer is one of the visuals that is not just another visual. This custom visual has some unique features that you cannot see in many other visuals. Read more about Infographic Designer: Not Just Another Visual[…]