
TreatAs is helpful for filtering, and it doesn’t filter only based on one column, it can filter based on as many as columns you want. One of the challenges in Power BI relationships is creating a relationship based on multiple fields, I have previously explained a method you can use to create a compound key and use that for the relationship. Another method is to use TreatAs. Let’s see how TreatAs can help in that scenario.
This is for Learning, Not Recommendation
Because I got a lot of questions from my first article about TreatAs, I want to clarify something here before we start;
Although I explained in the previous post that you can create a virtual relationship using TreatAs, and in this post, I am explaining how to create a relationship based on multiple fields using TreatAs, These specific use cases should not be considered as my recommendation. I just explain these for the purpose of LEARNING. There are, of course, use cases to use TreatAs, however, this post and the previous post is just intending to explain how the function works, so I stick to simple, and easy to understand examples.
Sample Model
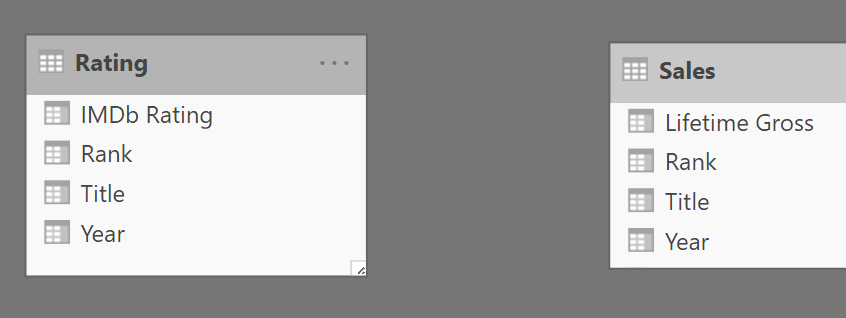
The sample model that I have includes to tables, one for Rating of Movies, and one for Sales of Movies, there is no relationship between the two tables. The reason is that these two tables should be related based on two fields: Title and Year in each table;
I always recommend in scenarios like this to create a shared dimension and use that for filtering both tables, like what I explained here. another thing that I recommend is to use compound keys to create a relationship like what I explained here. But for this example, let’s put recommendation aside, and talk about the learning side of TreatAs function.
The purpose is to have a relationship like this:

TreatAs Function with Multiple Columns
I explained the basics of TreatAs function in the previous article, and you learned that TreatAs requires a table expression and a list of columns.
TreatAs(<expression>,<column 1>,<column 2>…)
The table expression should return exactly the same number of columns that we want to refer to in TreatAs. I do need the table expression to return the two columns Title and Rating from the Rating table, and then use the two columns Title and Rating from the Sales table as parameters of TreatAs columns.
Before using TreatAs, if I filter the Lifetime Gross field in the Sales table by the Title and Year from the Rating table, I will get something like below;
As you know, because there is no relationship to filter the Sales table, it shows the total value regardless of the Title and Year. We need to say that the Title and Year columns of the Rating table, can filter the Title and Year columns of the Sales table.
I can write a measure like below, but it won’t work;
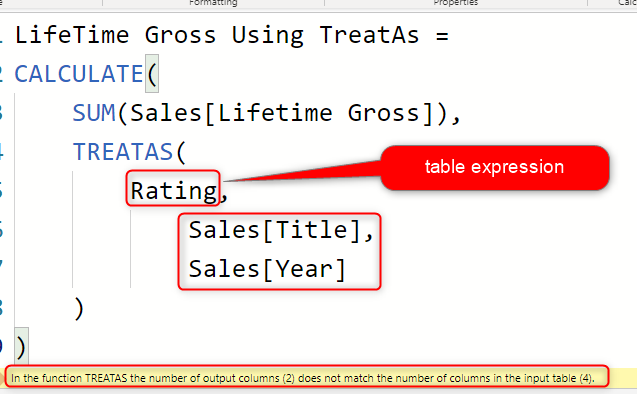
Rating table includes both Title and Year columns, however, it also includes a few other columns as you see below:
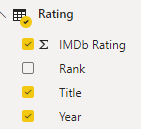
So the Rating as a table expression returns four columns, but I just need two; one for Title, and one for Year.
Table Expression with the Same Column’s count and Same Order of Columns
There are multiple ways you can write a DAX table expression that returns only the two columns you need from the Rating table, SelectColumns is an easy method for that;
SELECTCOLUMNS(
            Rating,
            'Title',Rating[Title],
            'Year',Rating[Year])
The above expression will only return a table with two columns; Title and Year. this table can be used as the table expression of TreatAs function like below;
LifeTime Gross Using TreatAs =
CALCULATE(
    SUM(Sales[Lifetime Gross]),
    TREATAS(
        SELECTCOLUMNS(
            Rating,
            'Title',Rating[Title],
            'Year',Rating[Year]),
            Sales[Title],
            Sales[Year]
    )
)
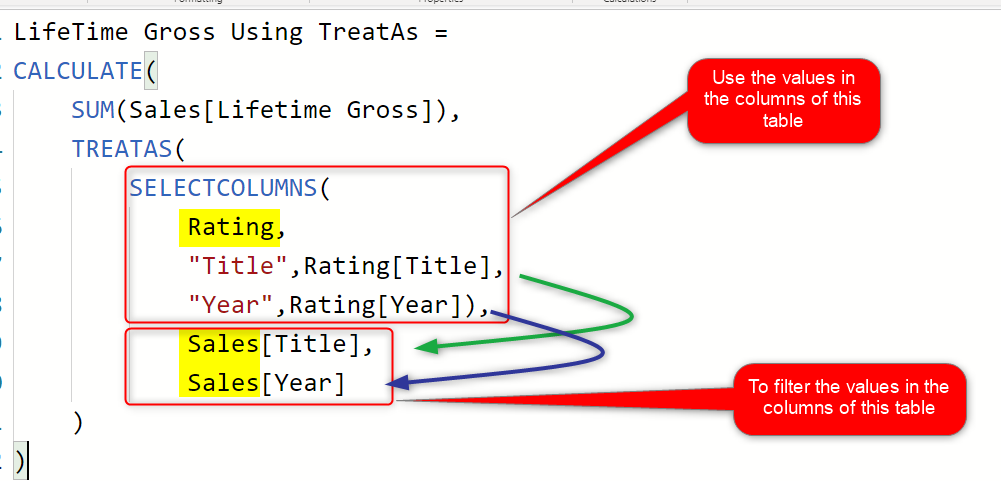
To understand how this works, I have explained it through the shape below;
The SelectColumns expression returns a table with only two columns: Title and Year. Then the values of this table are used to filter the values of subsequent columns of Title and Year from the Sales table. The order of columns should be the same. You cannot have a table returning Title, Year, and then filter the Year, Title with it. You probably won’t get any results with that combination. The name of the columns is not important, the values in each column are.
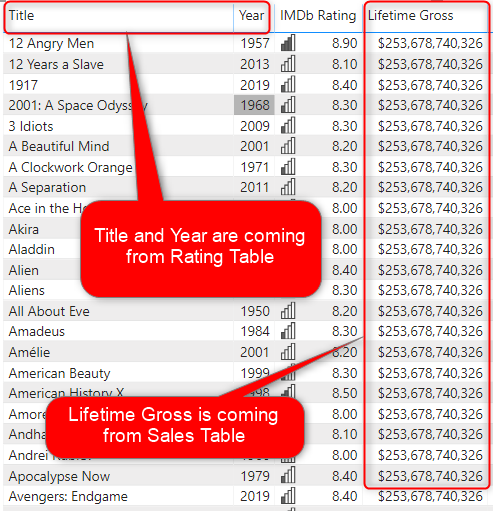
The result of the expression below is as below:
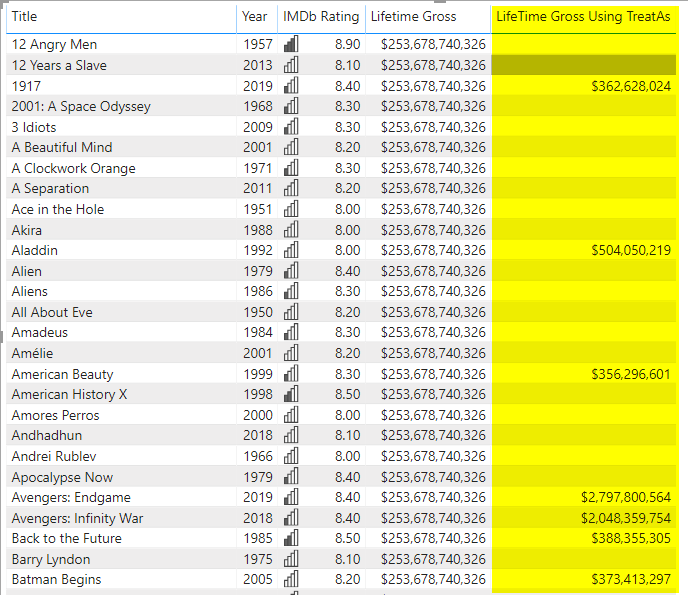
Even though there is no relationship between the two tables, using TreatAs we created that relationship for this measure using the two columns; Title and Year. You see some blank values in the result, that is because not every movie that is in the Rating table exists in the Sales table.
So I sum up the learning of this post for you:
The table expression should return a table with the exactly the same number of the columns with the same order of the columns that are used in the list of columns for the TREATAS function.
If you like to learn the basics of TreatAs function, read my blog article here. Last but not least, this post was explaining a functionality of TREATAS for learning, it is not recommended though to create a relationship like this; I always recommend scenarios like this to create a shared dimension and use that for filtering both tables, like what I explained here. another thing that I recommend is to use compound keys to create a relationship like what I explained here.
Download Sample Power BI File
Download the sample Power BI report here:
Video


Reza is author of more than 14 books on Microsoft Business Intelligence, most of these books are published under Power BI category. Among these are books such as Power BI DAX Simplified, Pro Power BI Architecture, Power BI from Rookie to Rock Star, Power Query books series, Row-Level Security in Power BI and etc.
He is an International Speaker in Microsoft Ignite, Microsoft Business Applications Summit, Data Insight Summit, PASS Summit, SQL Saturday and SQL user groups. And He is a Microsoft Certified Trainer.
Reza’s passion is to help you find the best data solution, he is Data enthusiast.
His articles on different aspects of technologies, especially on MS BI, can be found on his blog: https://radacad.com/blog.