In the previous part of the currency exchange rate conversion, I provided a function script that you can use to get live rates using a free API. In that part, you learned how you can create a table in dataflow using live rates. In this part, I will show you how you can use the currency conversion table that we generated in dataflow to convert millions or billions or rates in Power BI.
Conversion Rate Table
In this blog post, I’ll be using the Conversion Rate Table that has all required currencies and their live rates fetched from API. If you haven’t got this table yet, read the first part of this article here to learn how to create such a table. This is how that table looks like:

Get Data from Dataflow
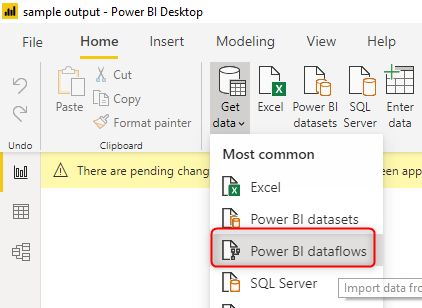
Start with getting data from the Currency conversion table using get data from Dataflow;

Select the Currency Conversion table

Select Transform Data to get to the Power Query Editor Window.
Sample Transaction Table
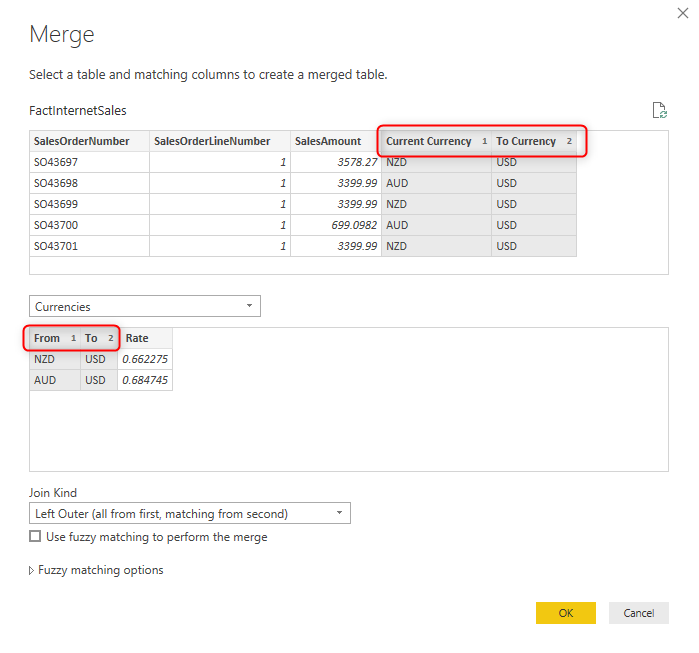
I have a sample transaction table that all rates are in NZD and AUD, and I want to change them all to USD. Here is an example of some rows in this table;

As you can see the table has two columns for Current Currency and the currency that we want the amount to change. The SalesAmount is in the Currency Currency and has to be changed to the To Currency.
Merge Tables
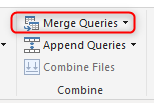
Because the data from the Conversion Rate Table is now loaded as a table, you can easily merge the transaction table to this table using the Current Currency and To Currency columns;

To merge based on multiple columns, hold the Ctrl key and select column in the order that you want (similar order in both tables);

This should give you a new column in the transaction table which is the exchange rate table. You can expand it, and all you need from that table is the Rate column (Make sure this column is a decimal or fixed decimal data type);

Now you should have rates for each row in that column;

Disable the Load
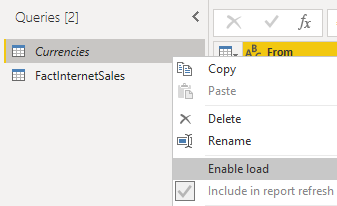
The Currency Conversion Rate Table server no purpose any longer, the result of that is now added in your transaction table as the Rate column. You cannot remove this table, but you can disable the load of this table;

Disable load makes sure that no unnecessary tables are loaded into Power BI.
Multiply the Amount by Rate
The final step is to multiply the SalesAmount in each row by the Rate, You can do that with pressing and holding the Ctrl key, selecting the two columns, and then from the Add Column tab, under the Standard menu, select Multiply.

You can call this new column as a Converted rate or whatever else you like. This is a column that you can use in your reports now.

Considerations
The method used in these two parts gets the data from a free currency exchange rate API, and I highly recommend to use dataflow or any intermediate storage so that you can minimize the number of API calls through this process. Make sure that the dataflow is scheduled to refresh regularly (the data of the API is getting refreshed every hour).


Hi Reza, that’s good but the business will certainly ask to convert the amounts as of sales date, thus using historical fx rates 🙂
Is this an idea for a new video/post :)?
Hi Artur
That is definitely something I would explain in another video/post (date not determined yet though ?)
Cheers
Reza
Hi Reza,
thanks for an excellent blog.
How can we display the currency symbol in out amount metric along with number, and when we do the conversion how can system will change the currency symbol dynamically.
Especially when we use wrapper metric, ( i.e. multiple measure with switch statement) how can we show the currency symbol.
thanks
Israr
Hi Israr
Adding the symbol of the currency is a formatting option. It should be done in Power BI after loading the data. You can use even a DAX measure for it, to format it properly based on the currency used for that calculation.
Cheers
Reza