

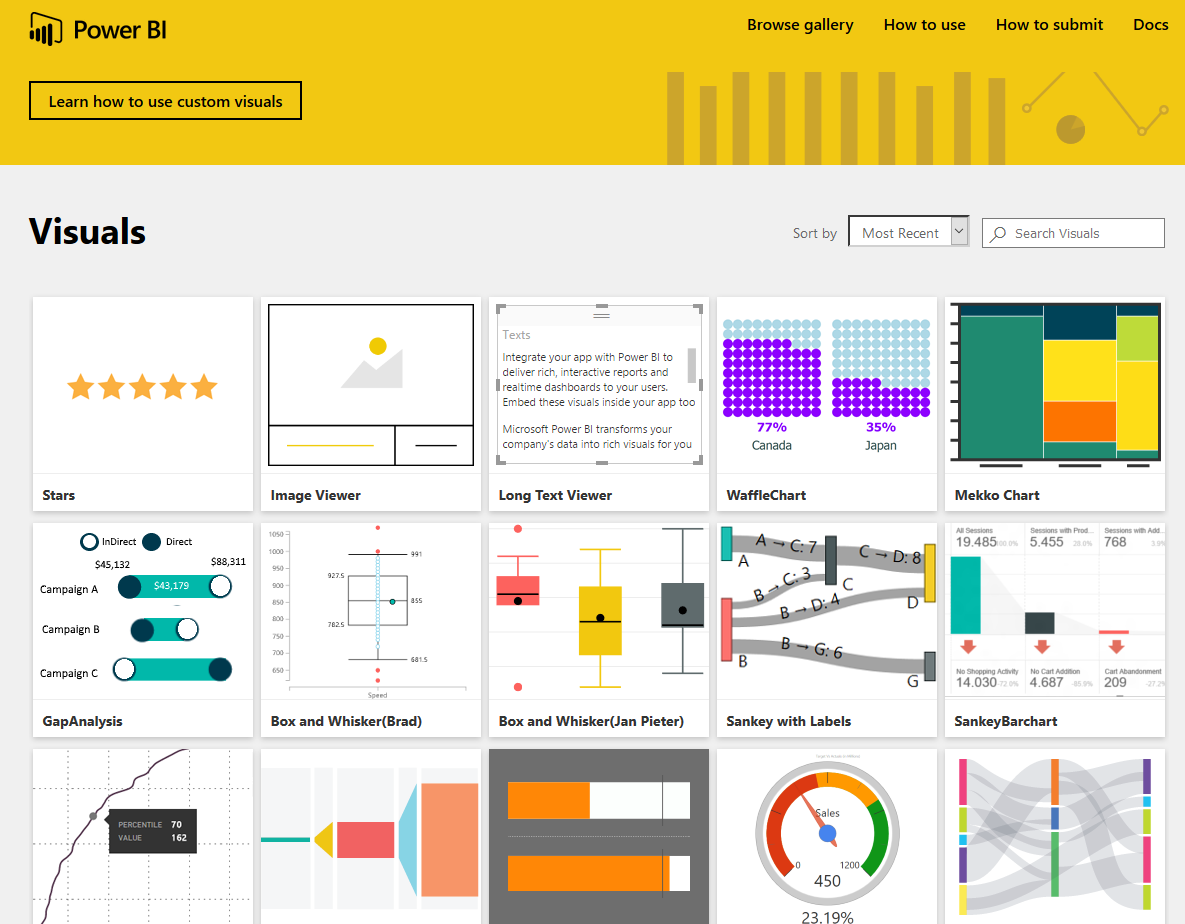
In previous posts of Power BI from Rookie to Rock Star you’ve learned that Power BI has bunch of useful built-in visualizations such as bar chart, column chart, waterfall chart, tree map, and many other visualizations. However there is always requirement for new types of visualizations. You might want to visualize parts of the data in a custom image. or any other visualization that is not built-in. Fortunately Power BI gives you ability to create your own custom visualizations. You can the share your visualization with others in your organization or even with the world through public custom visuals website. In this post I’ll show you some of great examples of custom visuals in Power BI and how to use them. In future posts we will go through scenario of creating one.
Synoptic Panel by SQL BI
This is one of the coolest custom visuals I’ve seen so far. The reason is that this custom visual has a customization in it! with this visualization you can define regions in any picture or images, and map data points to the image in your Power BI report. The image can be everything; human body, airplane seat layout, shop floor layout or football field. You choose the image you want, then you define regions. Let’s have a closer look at this visual.
You can download the latest version of Synoptic Panel from Power BI visuals gallery or from the Synoptic Design website. Please note that custom visuals might be developed by third parties not Microsoft, so you are using them at your own risk (I mean in terms of support if an issue happens). Synoptic Panel is a custom visual built by SQLBI company. After downloading this visual you will have a *.pbiviz file.

You can import that file into Power BI desktop with clicking on ellipsis button in visualization pane and choosing the *.pbiviz file.

After importing you will see the visual listed in visualization pane.
Now let’s do an example with that. Consider we have a dataset of car accidents which has date of accident, registration number of the car, car part which broke in the accident, accident type and severity of the accident. Here is the example data set:

As you see in the dataset above the Damage column shows which part of car the damage has been occurred. So a very useful visualization is having a layout of car exterior design (considering that damage only happened on the exterior for simplicity). With a simple search in google I’ve found image below:

Source of the image: http://www.123rf.com/photo_1648382_sw-car–layout-for-presentation–vector.html
What I need to do is to define regions on this image. Synoptic Panel also has a designer tool that allows me to draw regions! so let’s do that. Go to Synoptic Designer website and upload your image there.

add the image there, and then use the designer tool for drawing an area. after drawing the area you will see area highlighted and listed on the right hand side.

Define other areas (for bumper, roof…). and name each area as the values you have in your dataset’s Damage column.

Now you can export this design into your Power BI with clicking on Export To Power BI. this will creates a *.svg file for you to use in the Synoptic Panel visual.

Import the *.svg file into Power BI desktop’s Synoptic Panel visual. As you can see I’ve mapped Damage field to Legend of the custom visual and count of Regos to values field.

After adding the *.svg file as the map you will see regions highlighted. This shows that there are some values for those regions.

You can set a color state for this visual. Before doing this you should set a field as the state field for this visual;

Then you define rules for coloring: For example of value is between 0 to 5 then state color one with Green color. if it is between 6 to 10 then state color 2…. Here is what I defined:

Nice visualization, isn’t it? There are some other customization that you can apply with this visual. I’ll leave that part to you for further studying if you are interested. Watch SQLBI YouTube video which illustrates some of this visual’s features. There are also some per-built maps for this visual that you can use if you want.
Chiclet Slicer
The other custom visual I want to talk about in this post is Chiclet Slicer. This is a custom visual built by Microsoft itself. The default slicer in Power BI is very basic, you can’t do much formatting on it. Chiclet slicer allows you to do text formatting, box formatting, and also adding images to your slicer items.

Let’s add this slicer to our existing car accident example. As you’ve seen in dataset above we have accident type field which contains values such as roof damage, motor Cycle accident, over heat and etc. It is good to have a slicer that shows these accident types as images. So what I’ve done was creating another spreadsheet with accident types and a field called logo which is a URL for an image related to each item.

I’ve then loaded this dataset into my Power BI model and created relationship based on AccidentType. Then I’ve changed the Data Category of Logo field in my Data tab to Web URL.

Now in the Chiclet Slicer custom visual I set fields as accident type, and Image as Logo, and count of rego as Values. Here is the result.

For the result above I’ve also configured number of columns in my chiclet slicer to be 2.

Even if I don’t have an image for chiclet slicer still I can use it as it shows text field in a way much better. I’ve used it for Severity field as well. and the final result is here:
You can see that adding two custom visuals made my report much better in terms of both look and feel and also understanding the insight better. In future posts of Power BI from Rookie to Rock Star book I’ll explain some other useful custom visuals and the method of developing your own custom visual.


Reza is author of more than 14 books on Microsoft Business Intelligence, most of these books are published under Power BI category. Among these are books such as Power BI DAX Simplified, Pro Power BI Architecture, Power BI from Rookie to Rock Star, Power Query books series, Row-Level Security in Power BI and etc.
He is an International Speaker in Microsoft Ignite, Microsoft Business Applications Summit, Data Insight Summit, PASS Summit, SQL Saturday and SQL user groups. And He is a Microsoft Certified Trainer.
Reza’s passion is to help you find the best data solution, he is Data enthusiast.
His articles on different aspects of technologies, especially on MS BI, can be found on his blog: https://radacad.com/blog.
How can we customize sorting in Chiclet Slicer?
Hi Amrita,
You can set Sorting in the Data tab of Power BI.
By default Sorting will be based on alphabetical order of values in the column you put in slicer. However you can change the sorting to “SORT BY COLUMN” option to another column. Let’s say you want the sorting to be different, so all you need is to create a sorting column with an index, and then use that here. All charts and slicers then follow this sorting configuration.
Cheers,
Reza
Hi Reza,
Thank you for your PBI Desktop tutorial ! As a BI area beginner, it is a good base to learn the minimum valuable skills 🙂 You do an amazing work !
Reza, as i want to study this chapter, I tried the link to download the synoptic panel but I got the message :
https://visuals.azureedge.net/app-store/synopticPanelByOKViz.1.5.0.0.pbiviz This site can’t be reached.
Do you know this issue ? Is there a workaround ?
Thank you in advance for your help !
Hi.
The visual is downloading perfectly fine on my side. You can also go to Marketplace from your Power BI Desktop, and add it from there.
Cheers
Reza