
In the previous part of this article, I explained what is the segmentation challenge, when you want to group data based on the aggregated result, and I explained a static method of creating aggregated tables and creating a relationship to the main detailed table. However, the caveat of that method is the segmentation is done statically as a pre-calculation. In this article, I’ll explain a method using DAX measures that you can use to dynamically create those segments or groups.
Segmentation: Group By a Count of Values
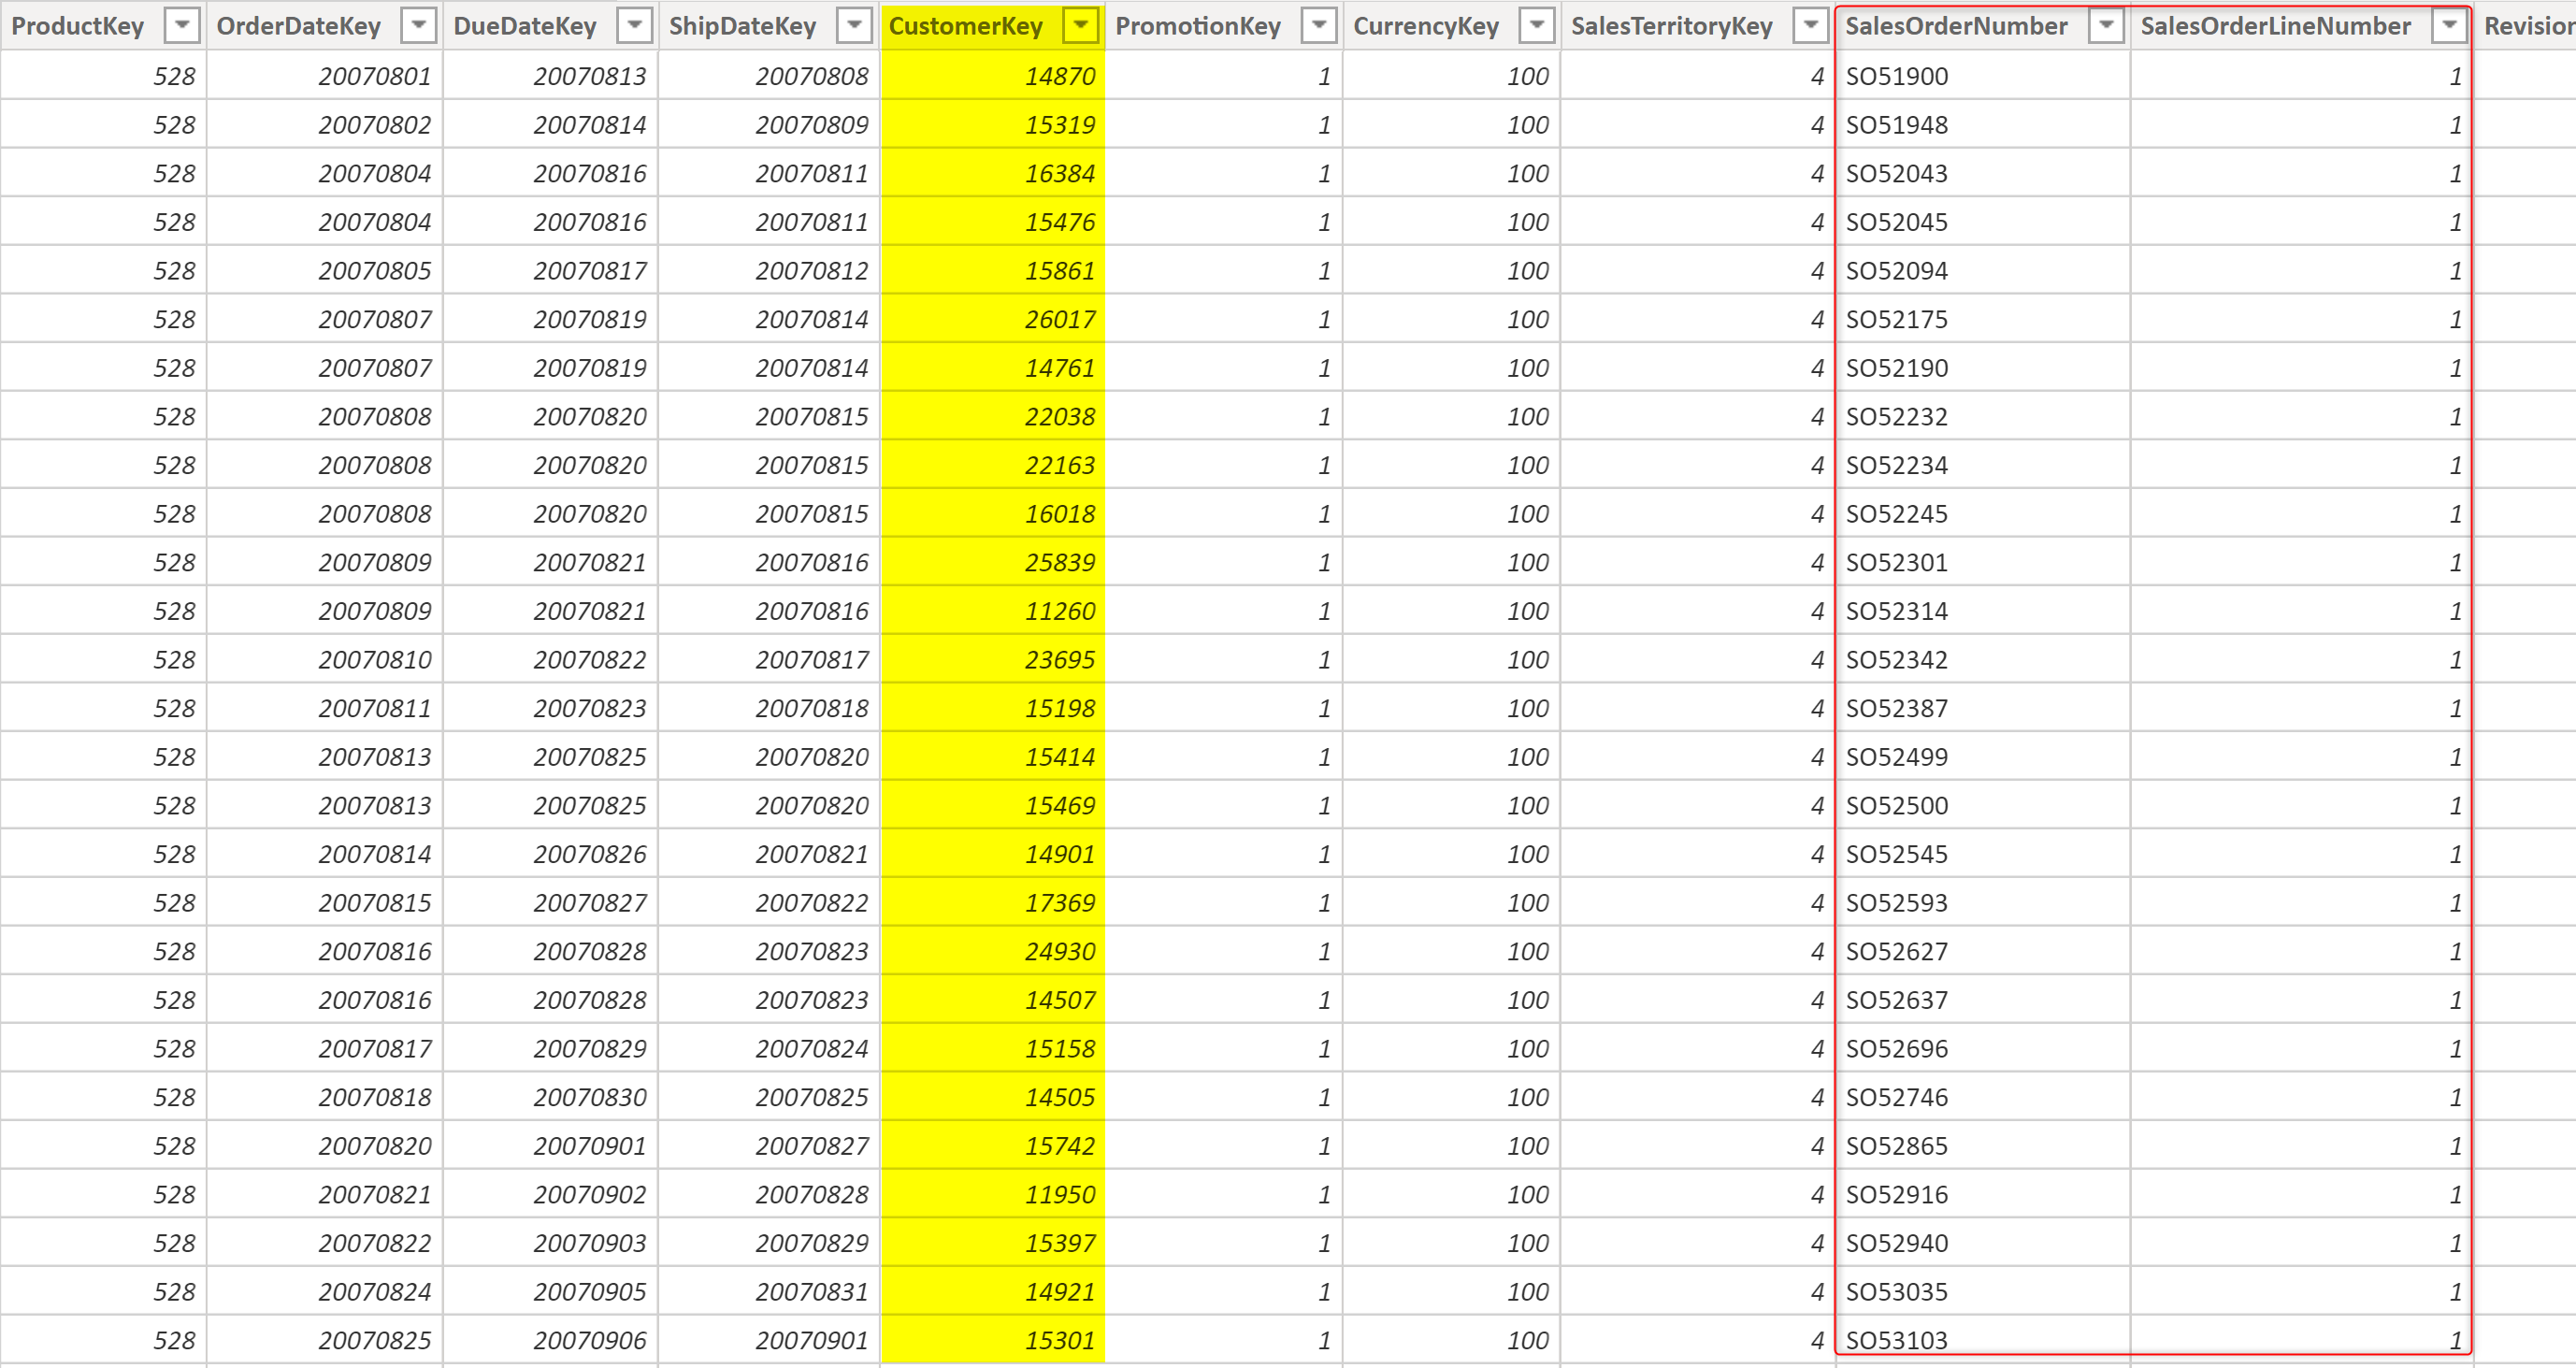
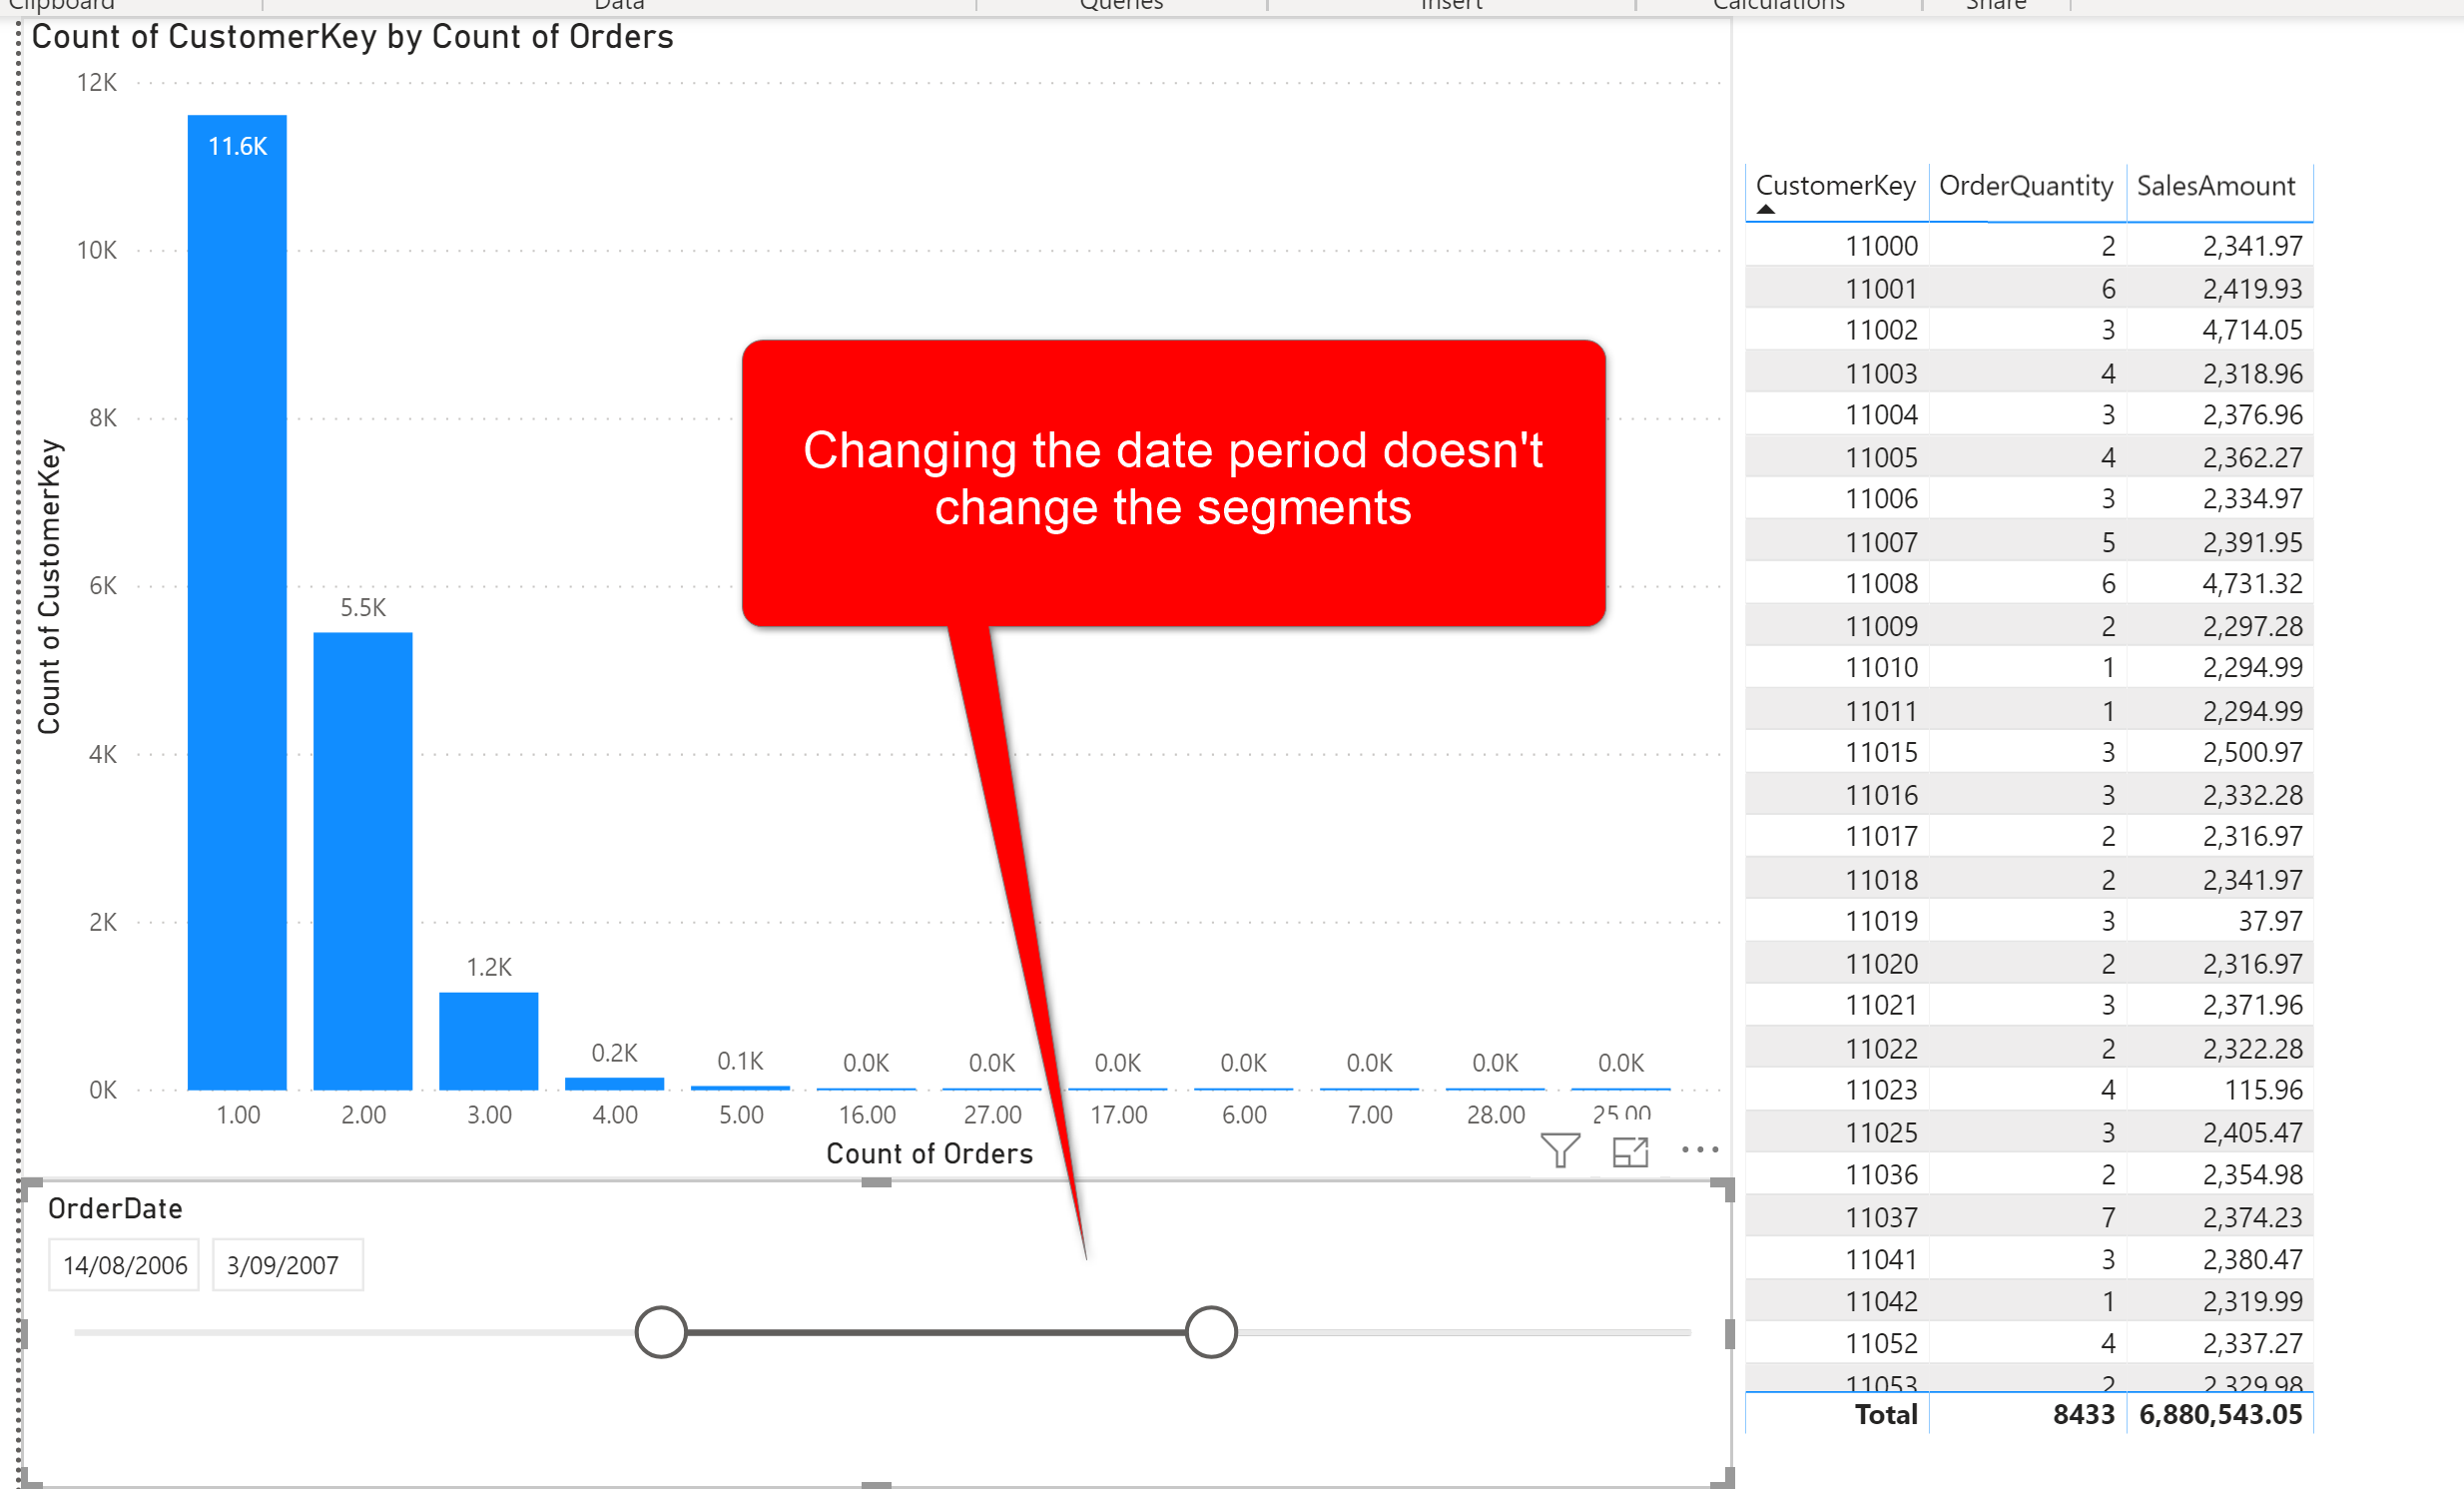
Let's go through one more time if you haven’t read the previous part of this article. Below, I have the FactInternetSales table, which has the information on all sales transactions made. the Sales Order Number and the order line number are two columns in the table, as well as the CustomerKey.
The problem we want to solve using the data above is that:
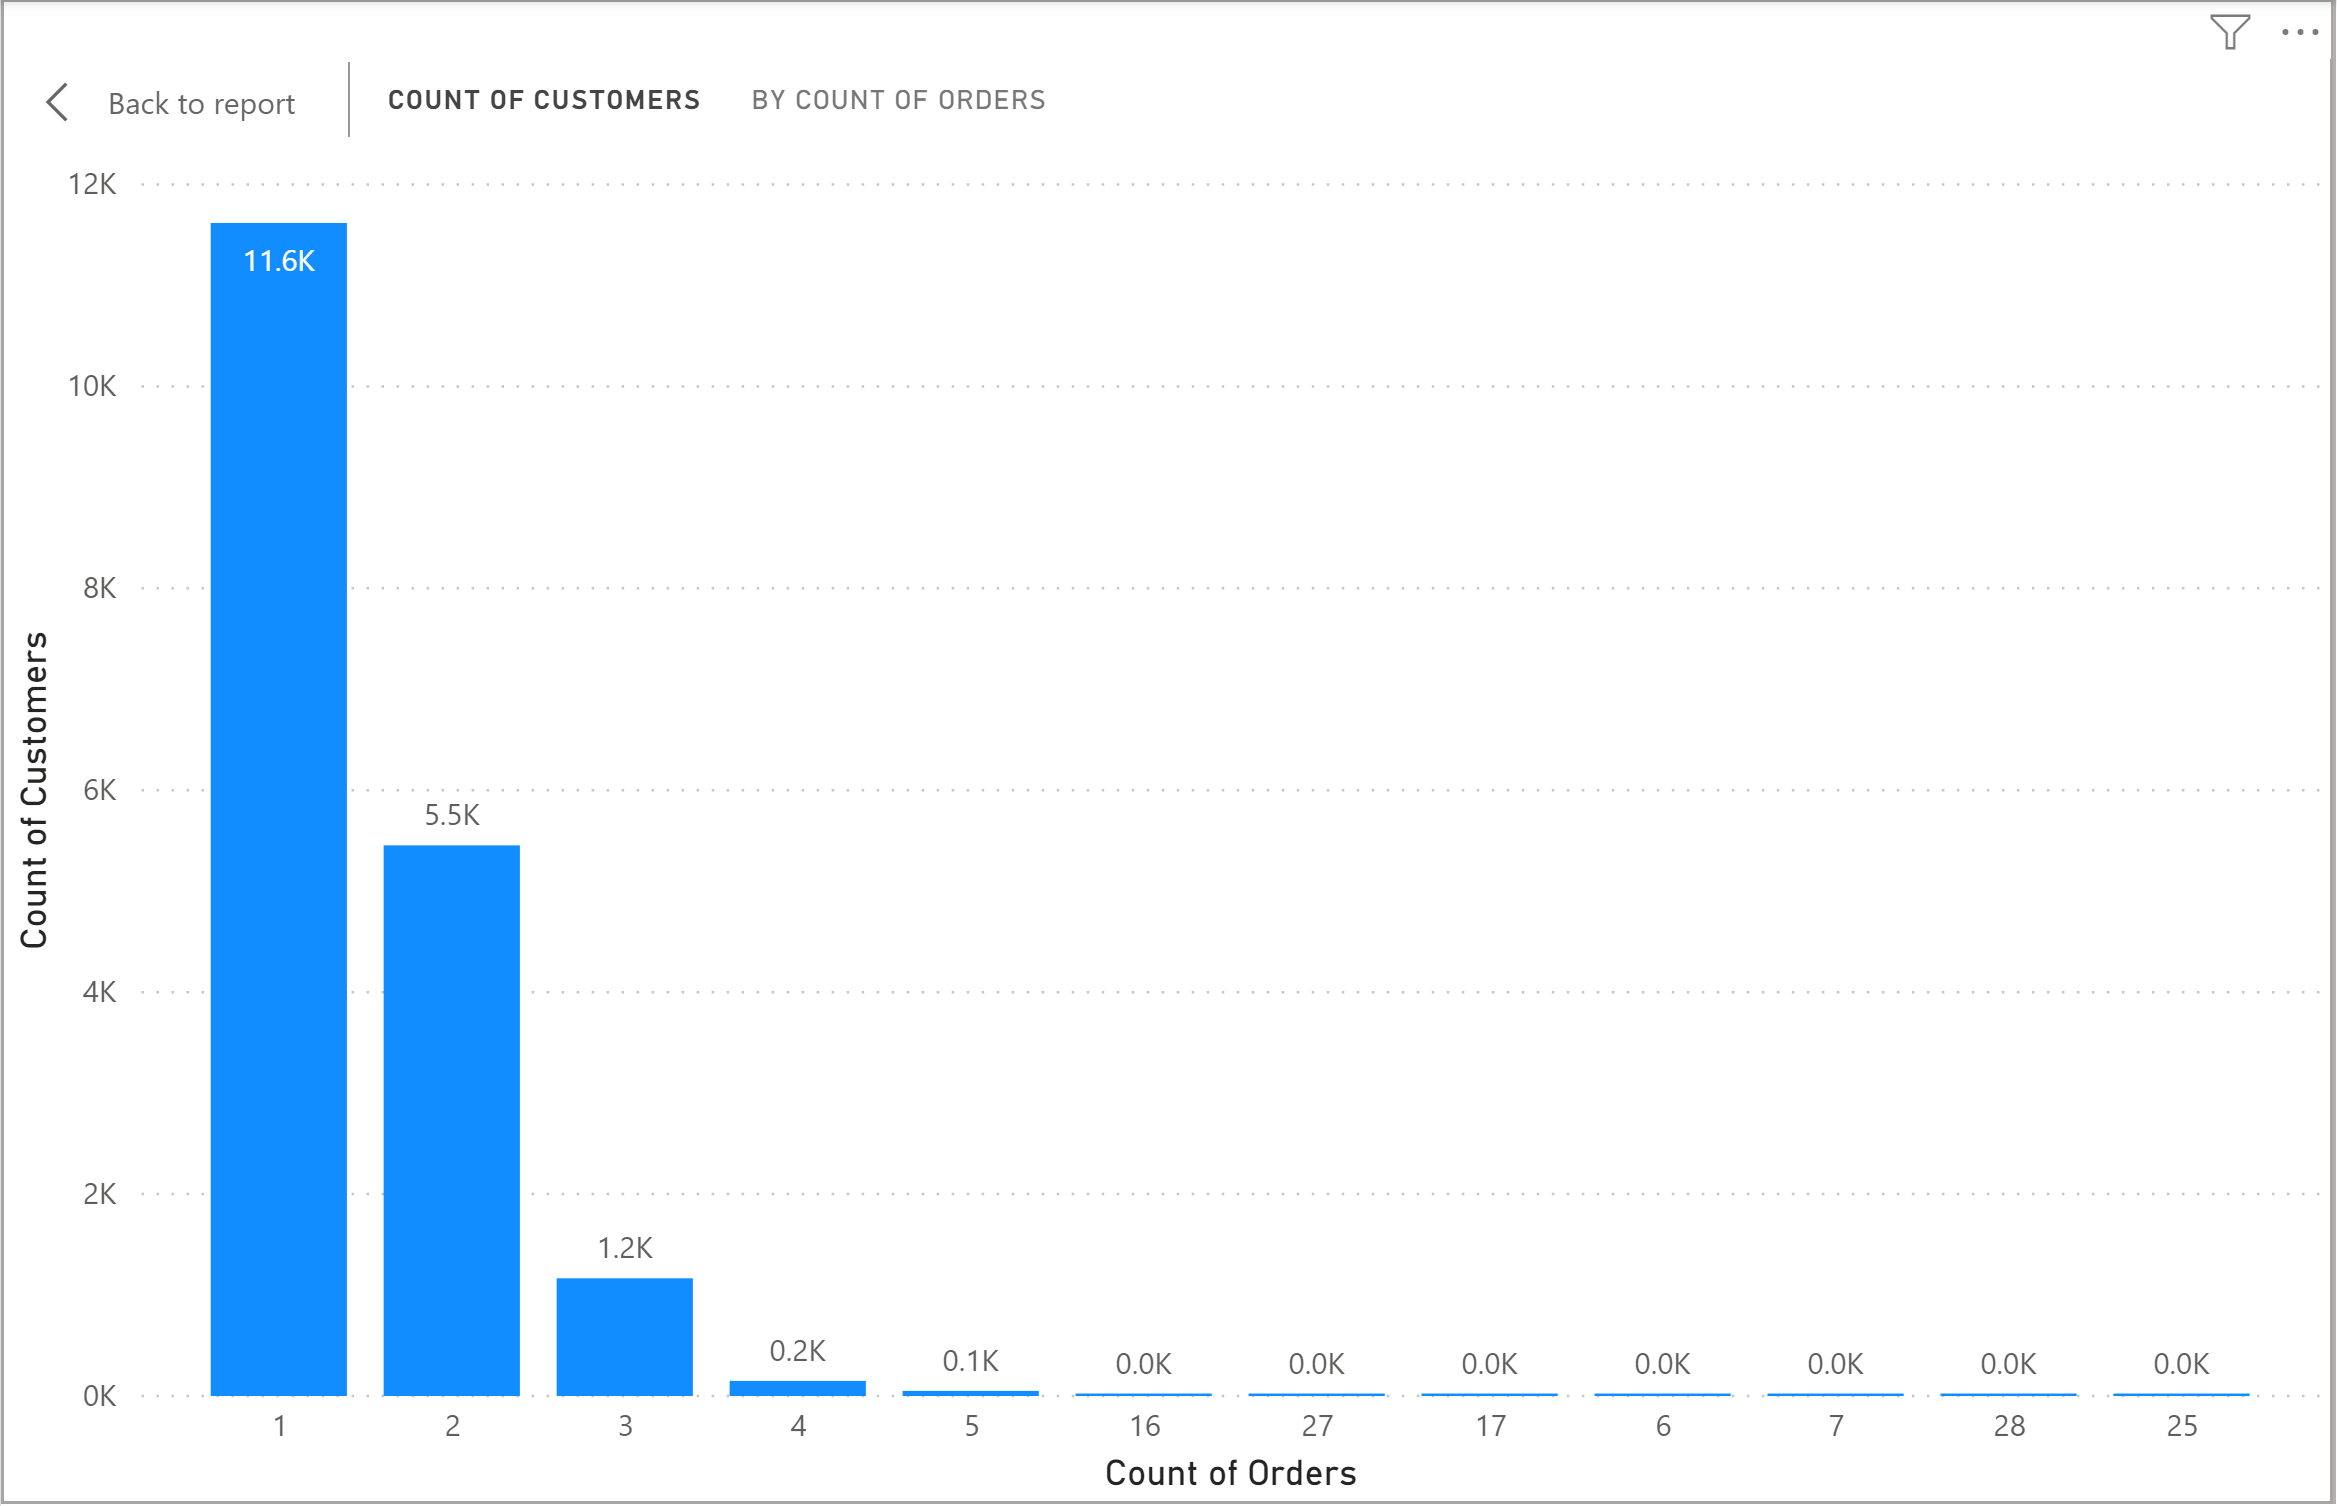
How many customers did only one order, how many two times, how many three times and so on?
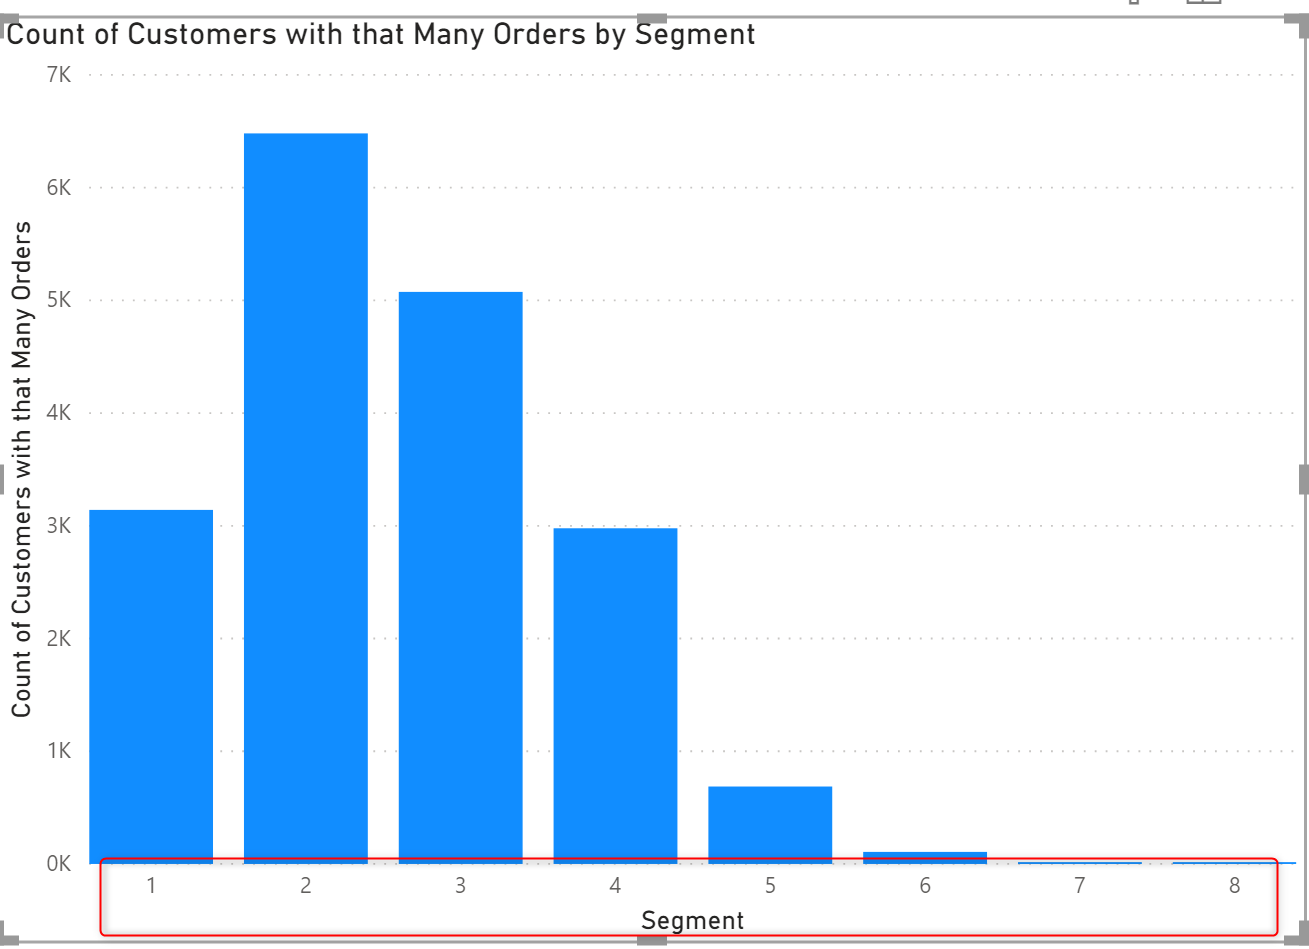
something like the below chart as the output:
This doesn't seem to be a complex solution. You need to have a field which is the number of orders for each customer, and then get the count of customers for each group. The fact that the data in the table is not aggregated, however, makes it a bit of a challenge.
If the data in the table, was like this, it was much easier to get the result out:
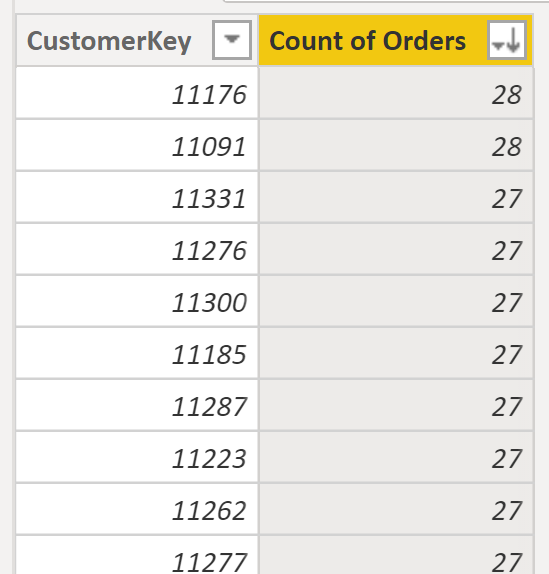
Because then you would simply use the Count of Orders as an axis, and then Count of CustomerKey as the value of the chart.
The problem of the Static Segmentation
Static Segmentation is done as a pre-calculation, and it doesn’t take into account all combinations of user selection. For example, if we want the segmentation to be done after the selection of a date range using a date slicer, then static segmentation can’t do that;
Dynamic Segmentation Using DAX Measures
The approach I explain in this article is dynamic segmentation using DAX measures. In Power BI, if you want a calculation to be done considering the user selection of values in slicers, then DAX measures are something you need to consider as an approach. The reason is that DAX measures are evaluated based on the filter context of the report, and they are not pre-calculated. DAX measures are calculated on the fly.
I have a DAX measure already that gives me the discount count of orders as below;
Count of Orders = COUNTROWS(VALUES(FactInternetSales[SalesOrderLineNumber]))
Create the Segment Parameter Table
As the first step; we need a field to be used as the axis of the chart;
You can use a What-If Parameter to create the segment table, Here is how you can create the parameter;
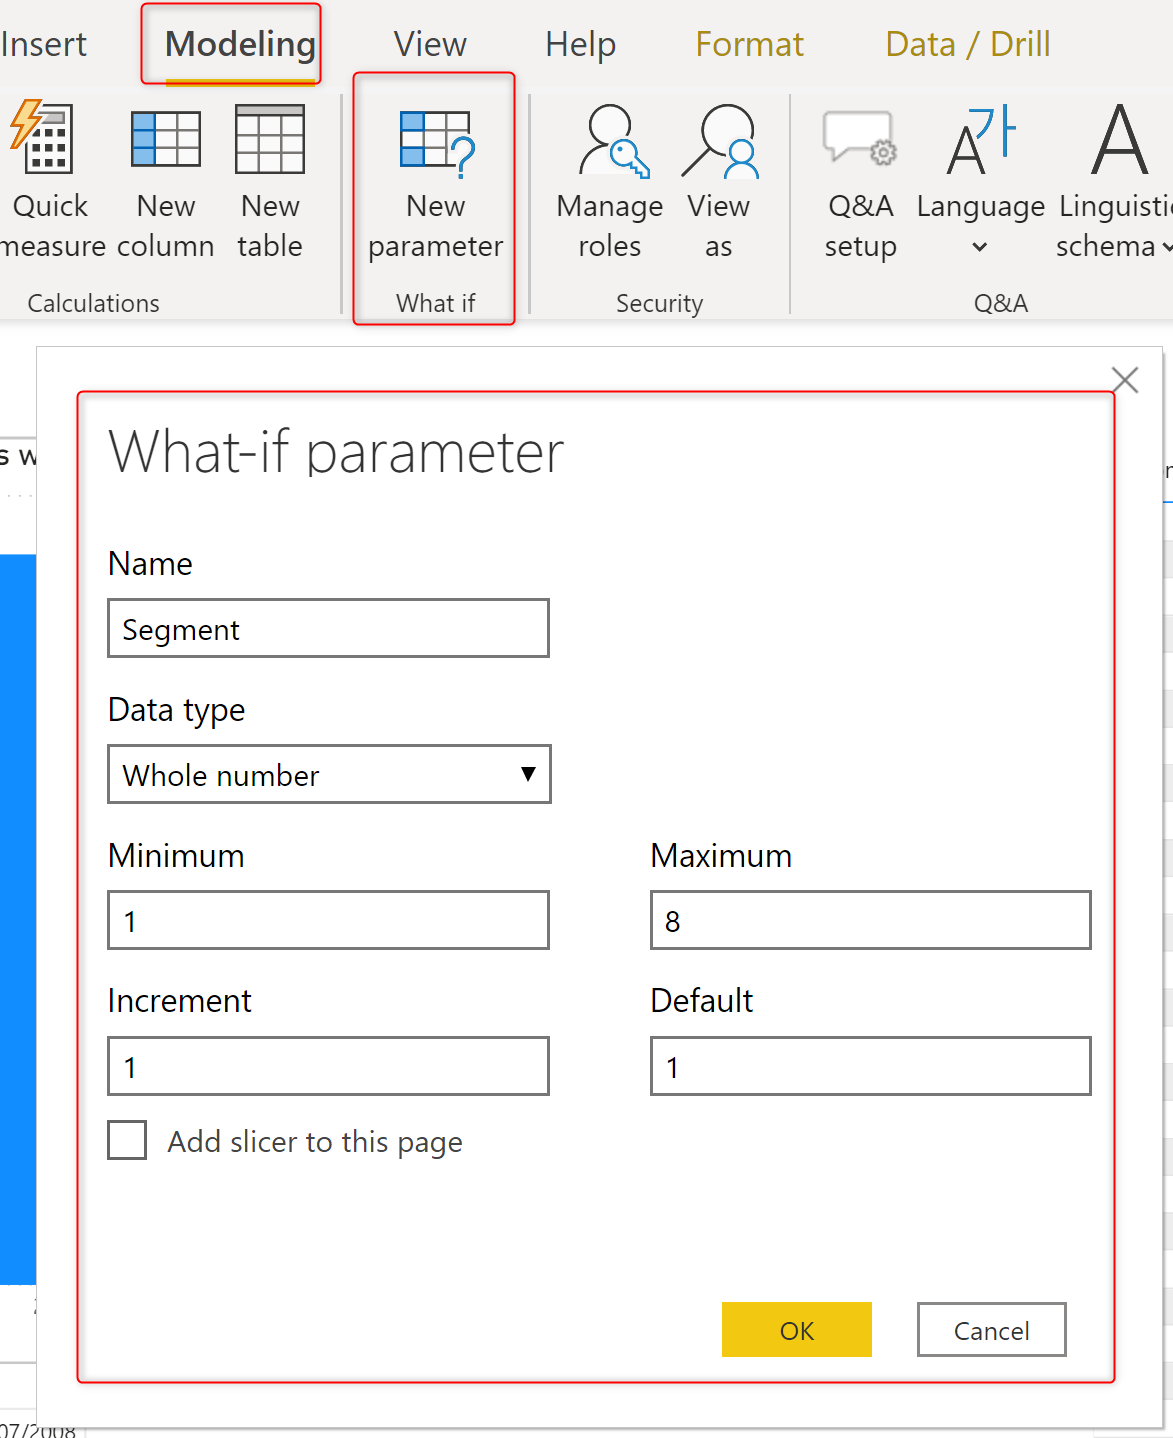
This table also comes with a measure that is the SelectedValue of the Segment column as below;
Segment Value = SELECTEDVALUE('Segment'[Segment],1)
Creating the Measure for Segmentation
You need to create the aggregated table through a measure to make it respond dynamically to the user interaction, the below variable can create the aggregated table:
var _CustomerOrders =
SUMMARIZE(
    FactInternetSales,
    FactInternetSales[CustomerKey],
    'How Many Orders',
    [Count of Orders]
)
The result of that variable then can be used for filtering using the Selected Segment as below;
Count of Customers with that Many Orders =
var _CustomerOrders =
SUMMARIZE(
    FactInternetSales,
    FactInternetSales[CustomerKey],
    'How Many Orders',
    [Count of Orders]
)
return
COUNTROWS(
    FILTER(
    _CustomerOrders,
    [How Many Orders]=[Segment Value])
    )
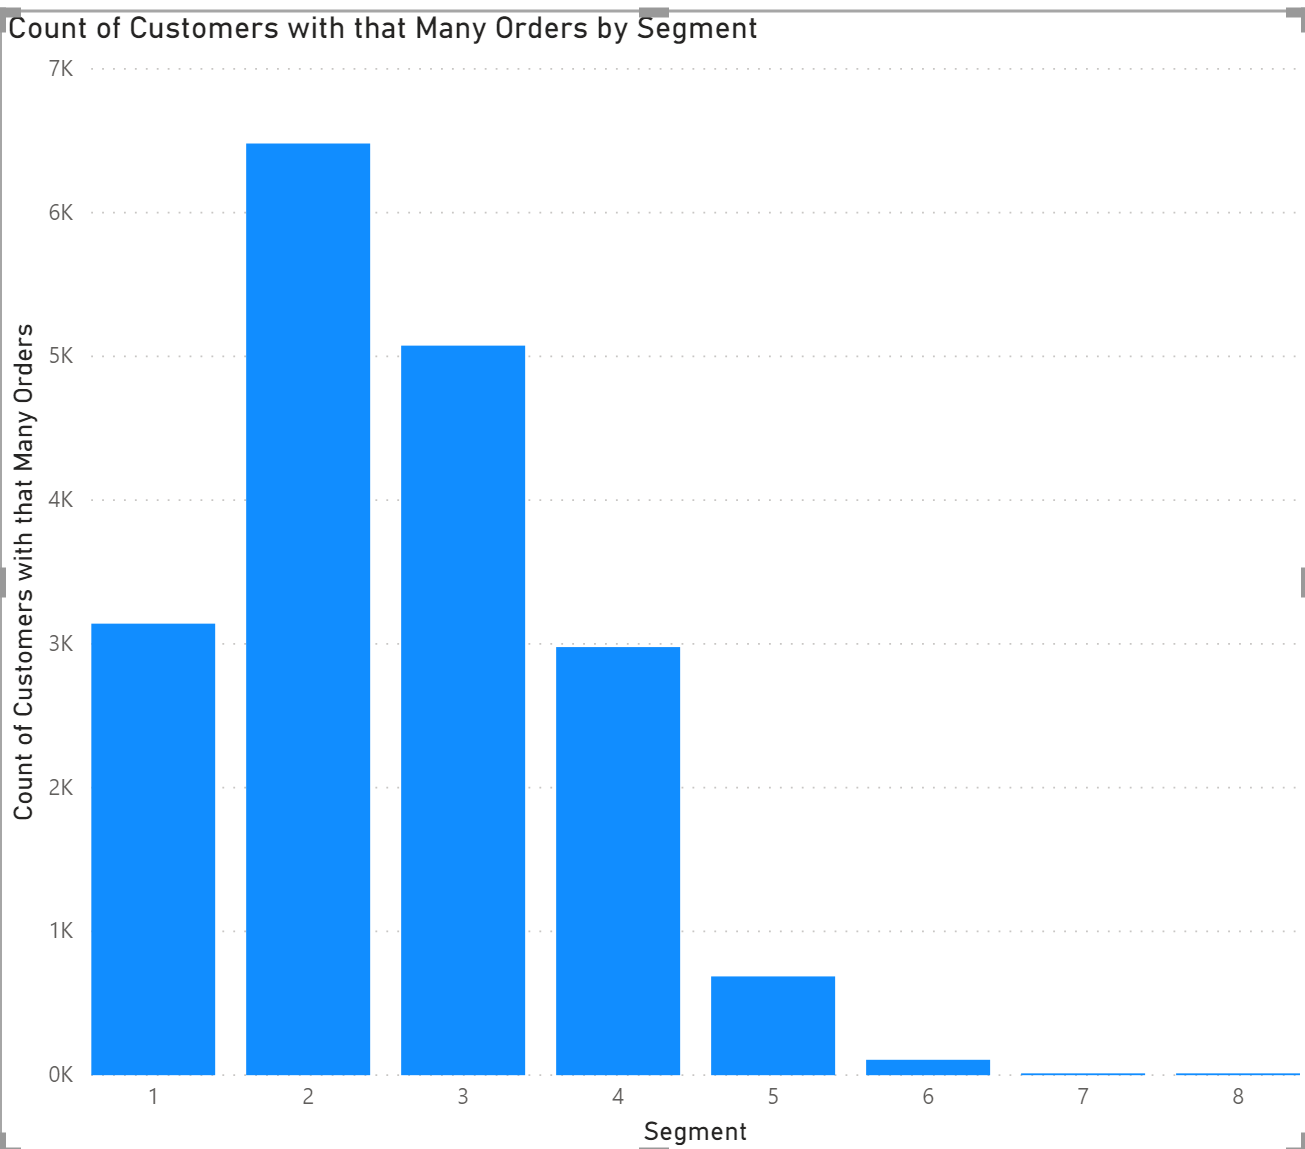
Line 13 of the code above is where we check the value of the Axis to be matching the segmentation, and that is when the segmentation is checked dynamically. As a result, this measure comes up with values below;
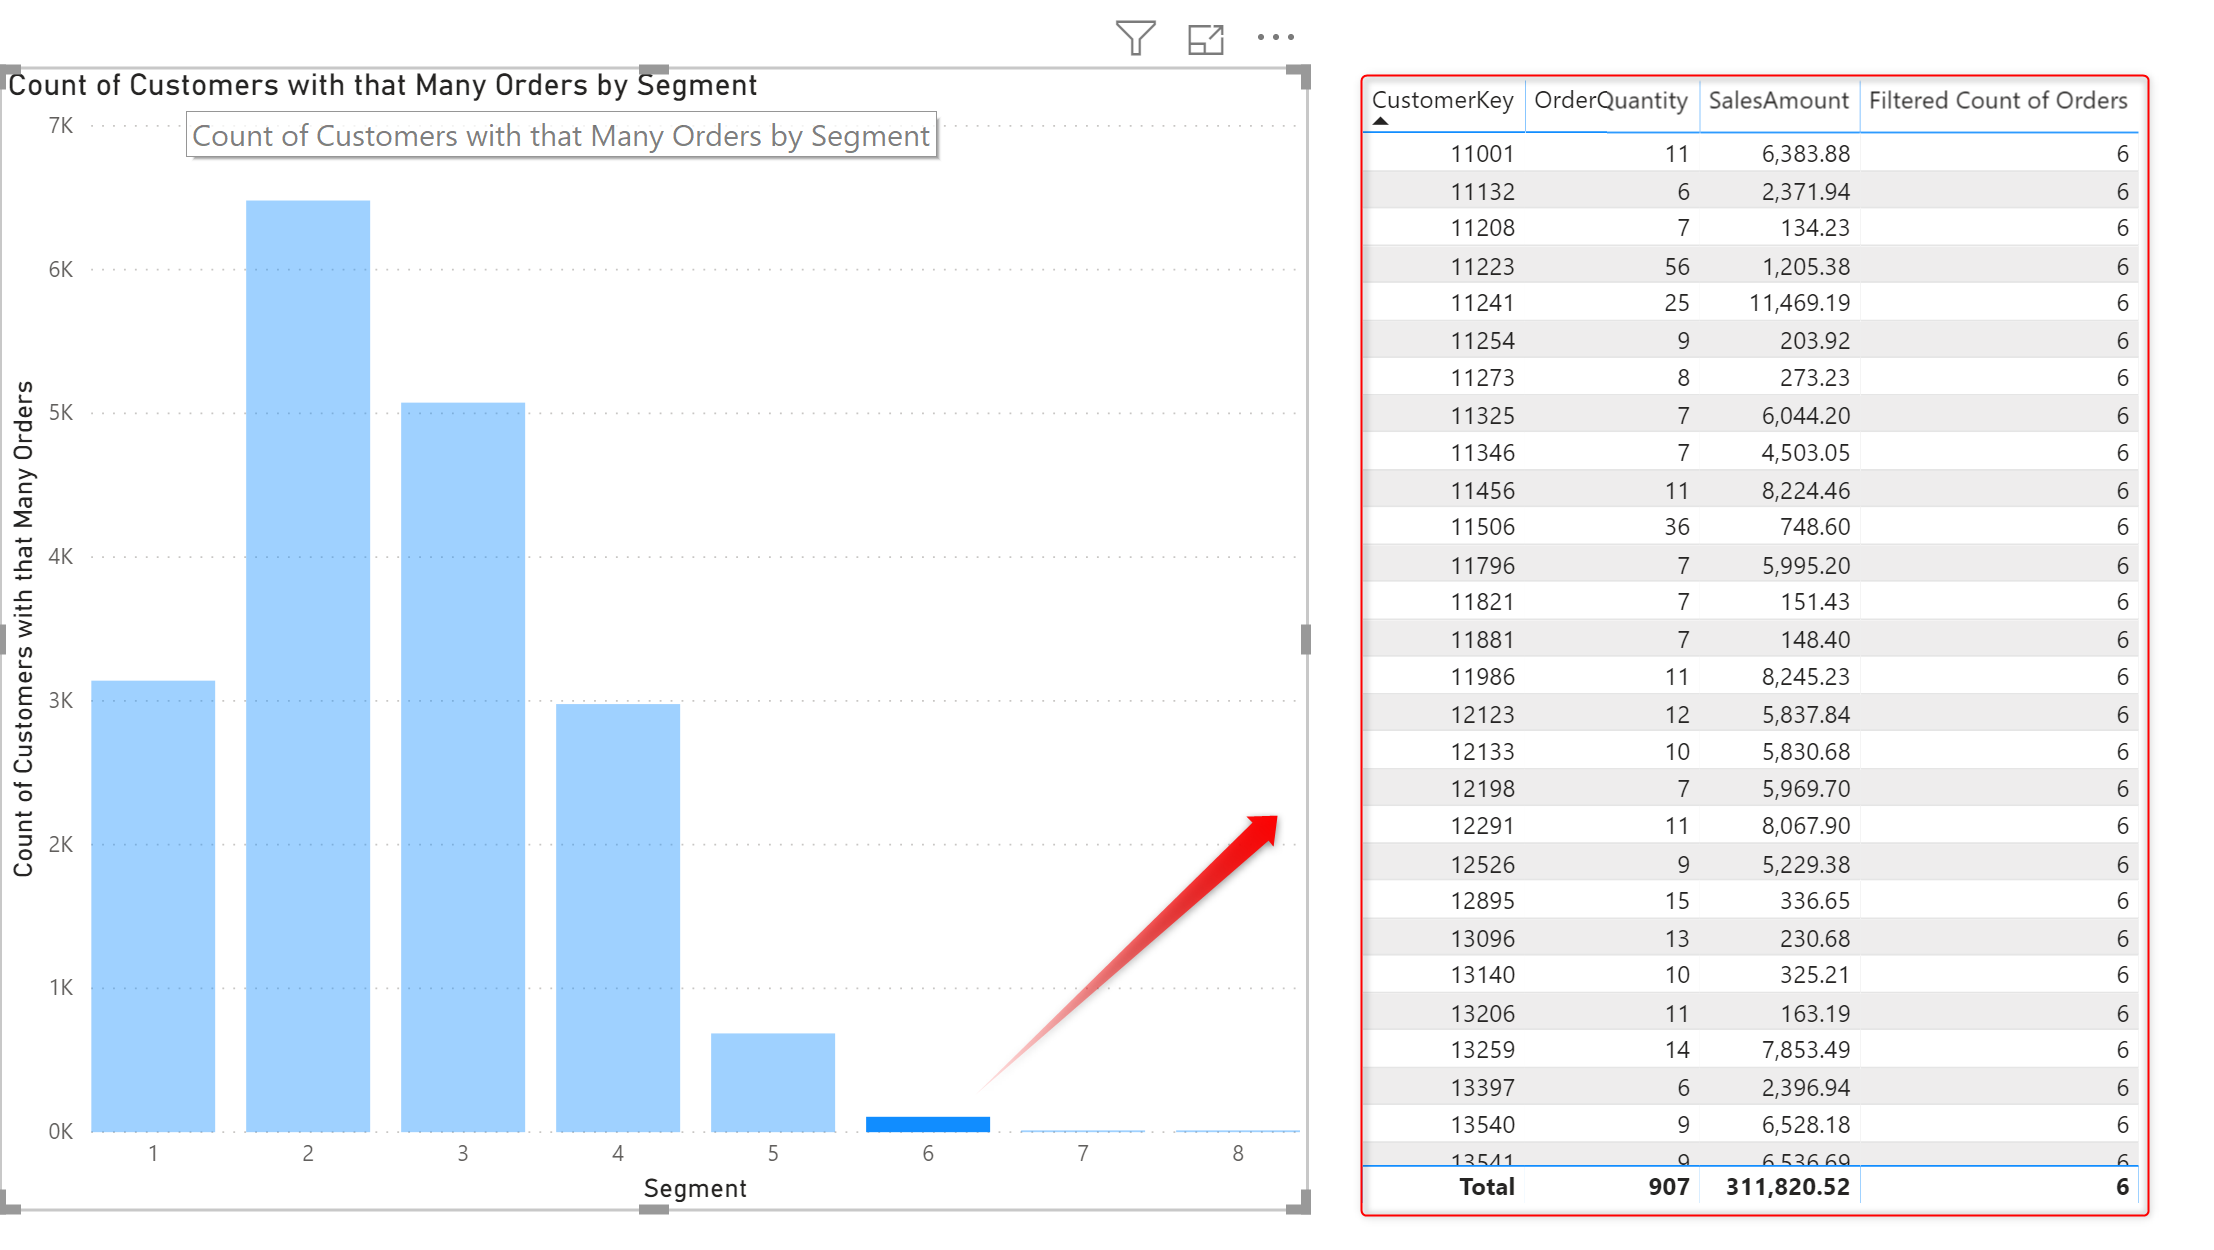
Adding Details of Each Group
To add the details of each group, you can have a table visual with each CustomerKey, SalesAmount and other information, but to filter it based on the dynamic group created, you need a measure to return a value only for the selected segment. that can be a measure with a simple if statement as below;
Filtered Count of Orders = if([Count of Orders]=[Segment Value],[Count of Orders])
This measure then can be used as a filter for the table visual when the value is not blank;
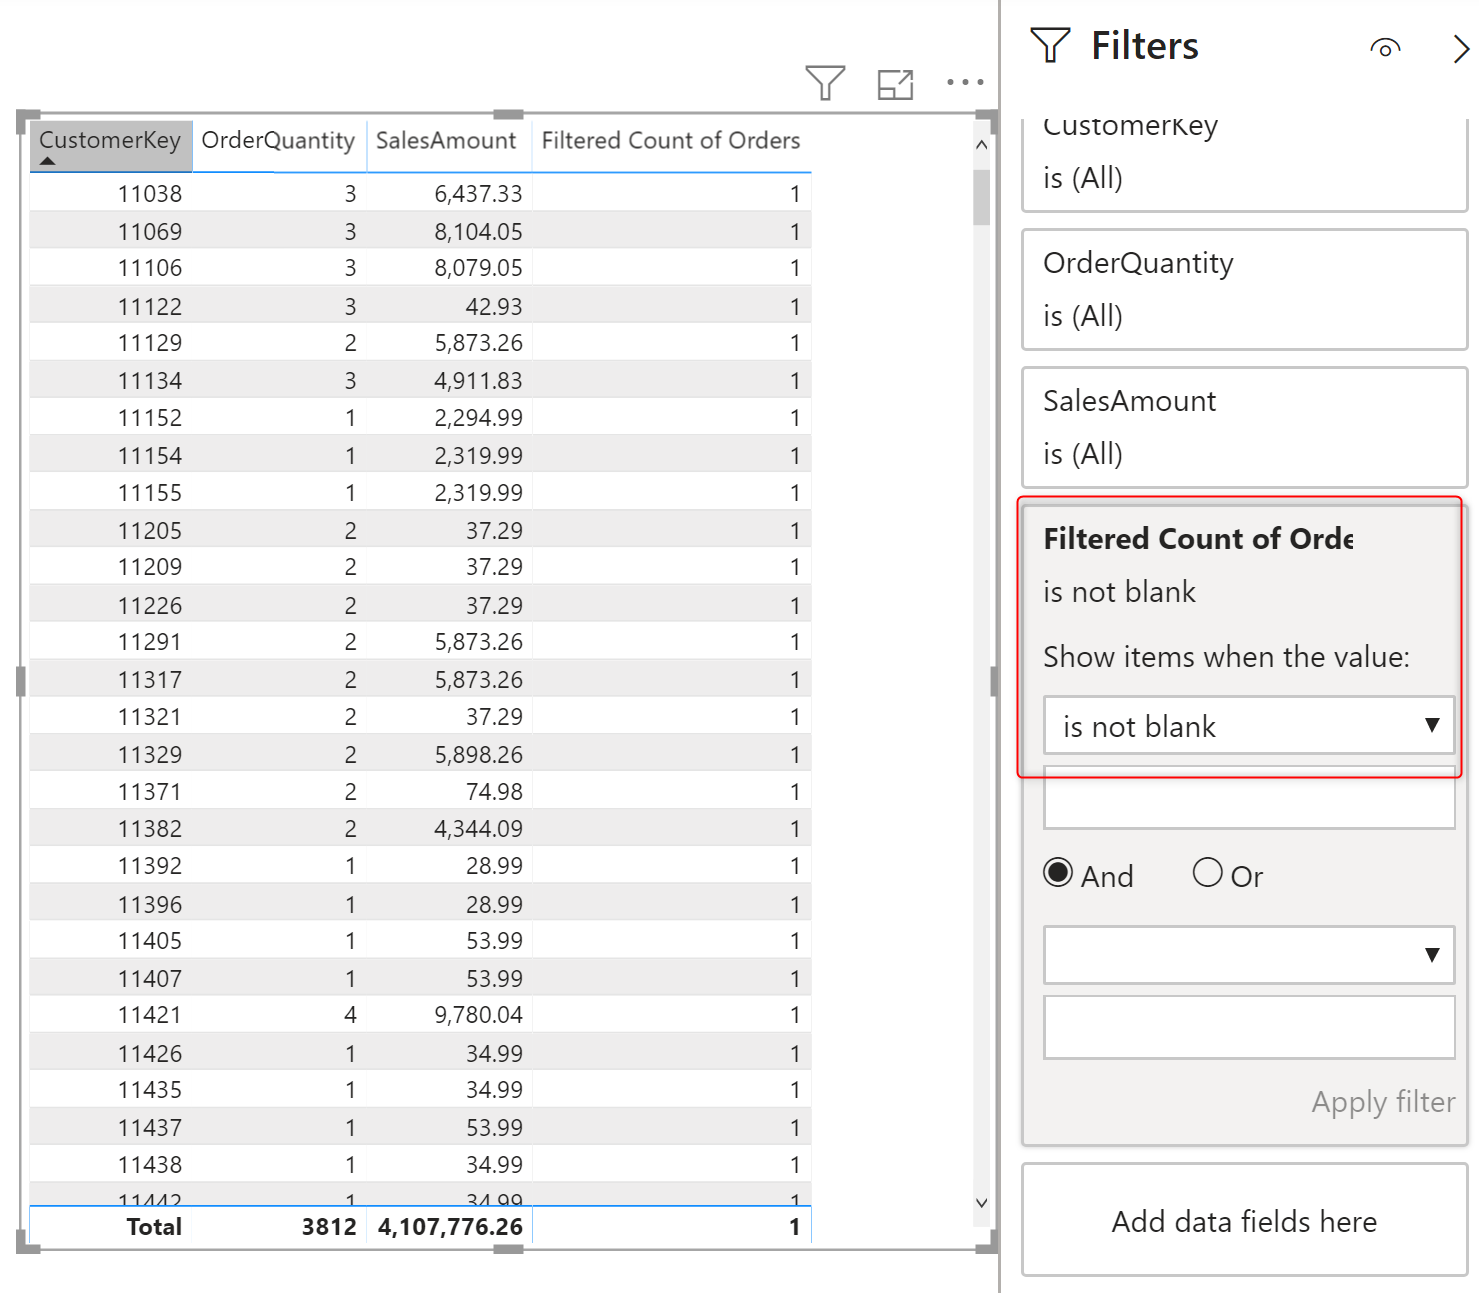
The result is that the detailed table is now getting filtered by the segments:
Dynamic Calculation and Segmentation By the User Selection
The main benefit of the approach explained in this article is that the user can select a date range (or any other filters on the data), and the segmentation changes based on that;
Be careful of the Dynamic Calculation
The dynamic calculation comes at a cost of course. It is great to have a dynamic calculation based on user selection. however, because the calculation runs again every time that the user selects a value in a slicer, the result would be slower than the static segmentation. The dynamic calculation comes with the cost of performance. I strongly recommend only consider this approach if the dynamic nature of the segmentation is MUST have in the requirement.
Download Sample Power BI File
Download the sample Power BI report here:
Video


Reza is author of more than 14 books on Microsoft Business Intelligence, most of these books are published under Power BI category. Among these are books such as Power BI DAX Simplified, Pro Power BI Architecture, Power BI from Rookie to Rock Star, Power Query books series, Row-Level Security in Power BI and etc.
He is an International Speaker in Microsoft Ignite, Microsoft Business Applications Summit, Data Insight Summit, PASS Summit, SQL Saturday and SQL user groups. And He is a Microsoft Certified Trainer.
Reza’s passion is to help you find the best data solution, he is Data enthusiast.
His articles on different aspects of technologies, especially on MS BI, can be found on his blog: https://radacad.com/blog.
what if I need bracket like ‘0-3′,’4-6′,’>6′ for the x-axis?
for a custom grouping like this I suggest to do the grouping at the data transformation stage. I explained how you can do that using Power Query here.