
There are many time intelligence functions in DAX, and each of those is helping in aspects of analyzing data on dates. There are two functions which work very similar to each other but have a bit different usage; DatesInPeriod, and DatesBetween. In this post, I will show you what is the difference between these two functions, and scenarios that you can use each. DatesBetween and DatesInPeriod both give you a period of dates, but let’s see their main difference. If you like to learn more about Power BI; read Power BI book from Rookie to Rock Star.
Sample Dataset
For examples of this post, you need the FactInternetSales table from AdventureWorksDW example.
DatesInPeriod
The DatesInPeriod function in DAX will give you all dates within a period. The period can be one of these: Day, Month, Quarter, Year. Here is the syntax of using this function;
DATESINPERIOD(<dates>,<start_date>,<number_of_intervals>,<interval>)
Here is a description of input parameters;
- <dates>: The date field (like many other time intelligence functions, this function also requires a date field)
- <start_date>: The start date that period starts from/to it (depends if the interval is a positive or negative number)
- <number_of_intervals>: a positive or negative number that starts from the start date based on the interval
- <interval>: Year, Quarter, Month, or Day intervals
The output of this function is a table of dates within the period specified. Let’s see how this function can be used. For example, If you want to get all dates in the last year’s period from the date of the filter context, it can be a calculation like this;
DATESINPERIOD(FactInternetSales[OrderDate].[Date],
    LASTDATE(FactInternetSales[OrderDate].[Date]),-1,YEAR)
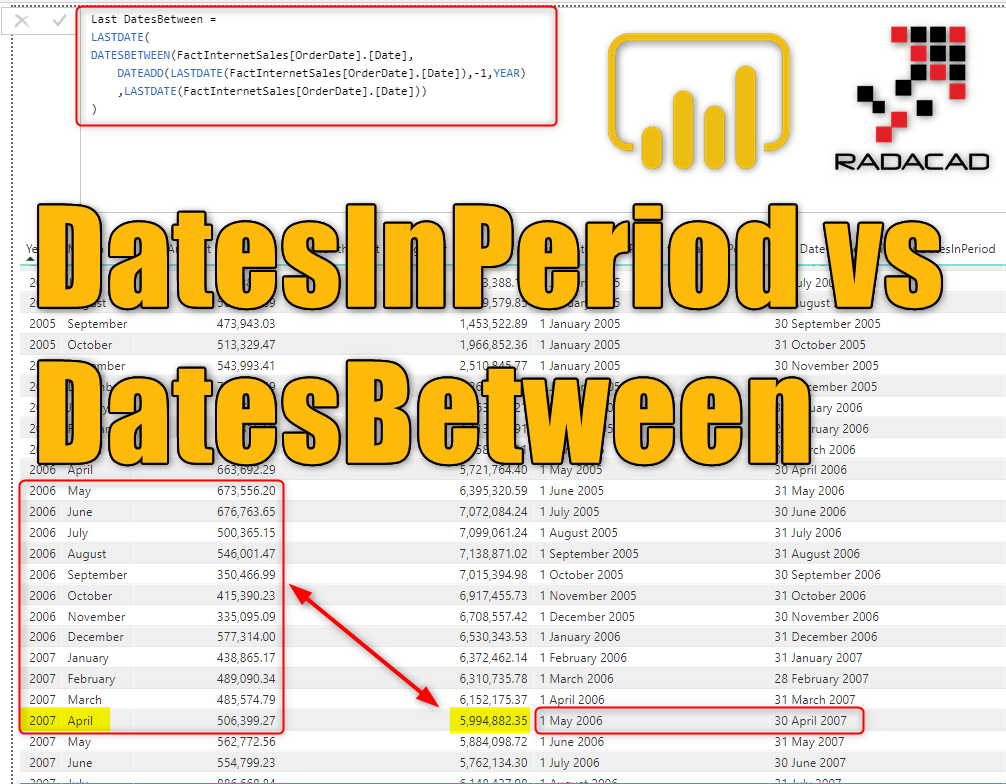
Note that FactInternetSales[OrderDate] is just a normal date field in the FactInternetSales table and the reason that I used “.[Date]” at the end of it, is because I am using the built-in date dimension of Power BI. If you use your own date dimension and have set it as a date table, then you should exclude the “.[Date]” part of this expression. To get the current filter context’s date as the start date, I used the LASTDATE() DAX function, and we are going a Year back in the interval. so the number of intervals is –1. The expression above returns a table, and cannot be used as a measure. Just to show you how this can work, I put it inside another function as a measure.
Example: Sales for the Last Rolling Year from the current Date
An example of using DatesInPeriod is to calculate the sales of the last year from the current date. In the expressions above, you’ve seen how we can get all dates in the period of the last year from the current date in the filter context. We just need to put it inside a Calculate statement to get Sum of Sales for that period.
Sales for the Last Rolling Year =
CALCULATE(
    SUM(FactInternetSales[SalesAmount]),
DATESINPERIOD(
    FactInternetSales[OrderDate].[Date],
    LASTDATE(FactInternetSales[OrderDate].[Date]),
    -1,
    YEAR)
)

What is the period of the calculation?
The important question in the above calculation is that what is the period of the calculation? Is this from the first of the year? or is it starting from a different date? what is included and what is excluded? The answer is that; DatesInPeroid starts from the <start_date> (which in this case is the month in every row of the table visualized in the screenshot above), and it will go one year back (because the interval is the year, and the number of intervals is -1). For example; If the current month April 2007, then it will go one year back from that date. But does it mean it will start from April 2006, or May 2006? Well, DatesInBetween is a smart function and will exclude the start date to avoid double counting. It will start in May 2006. Let’s see what is the period start and period end.
To get the period start and period end, you can create two measures below using FIRSTDATE() and LASTDATE() functions;
First Date in the Period for DatesInPeriod =
FIRSTDATE(
DATESINPERIOD(FactInternetSales[OrderDate].[Date],
    LASTDATE(FactInternetSales[OrderDate].[Date]),-1,YEAR)
)
and for the last date;
Last Date in the Period for DatesInPeriod =
LASTDATE(
DATESINPERIOD(FactInternetSales[OrderDate].[Date],
    LASTDATE(FactInternetSales[OrderDate].[Date]),-1,YEAR)
)
Now you can see the period clearly in Power BI;

As you can see in the yellow highlighted section; for April 2007, the Rolling Last Year Sales is $5,994,882.35, which is for the period between the 1st of May 2006 to 30th of April 2007. As you can see it starts not from the 30th of April 2006 to avoid double counting. DatesInPeriod makes your like much easier to calculate dates in a period. That is why it is called DatesInPeriod! So the value of Rolling Last Year Sales is the accumulation of all sales from May 2006 to April 2007.
DatesInPeriod is perfect DAX function for calculating standard periods which follow Day, Month, Quarter, and Year intervals. It will exclude unnecessary dates for you.
DatesBetween
DatesBetween function in DAX is a more generic version of DatesInPeriod. You have more flexibility with this function. With this function, you do not need to worry about the interval or number of intervals. This function will give you all the dates between a start date and an end date. Here is the syntax of this function;
DATESBETWEEN(<dates>,<start_date>,<end_date>)
Parameters are:
- <dates>: The date field (like many other time intelligence functions, this function also requires a date field)
- <start_date>: The start date that period starts from it (unlike DatesInPeriod, this cannot go backward from the start date. It always go forward from there)
- <end_date>: The end date that period ends there.
The output of this function is a table of dates from the start_date to the end_date including both start and end date.
An important understanding of this function is that the function itself doesn’t go back or forth from the start date to give you the period. You have to calculate the start or the end date first, and then get the period based on that. For example; Let’s say we want to calculate dates in the last rolling year from the current date in the filter context (similar to the example we have done with DatesInPeriod). You need to first find out what your start date is.
DATEADD(LASTDATE(FactInternetSales[OrderDate].[Date]),-1,YEAR)
The expression above is using DATEADD() function to calculate the start date which is going to be a year before (because the interval is -1) from the start date, which is calculated with LASTDATE().
After calculating the start date, you can use it inside a DatesBetween function like this;
DATESBETWEEN(FactInternetSales[OrderDate].[Date],
    DATEADD(LASTDATE(FactInternetSales[OrderDate].[Date]),-1,YEAR)
    ,LASTDATE(FactInternetSales[OrderDate].[Date])
)
The first parameter is just the date field. the second parameter is the start date that we have calculated, and the last parameter is the end date.
DatesBetween is a good function to use when the start and end of the period are determined. here is an example of calculating the sale of a specific period.
Sales of Specific Period with DatesBetween =
CALCULATE(
    SUM(FactInternetSales[SalesAmount]),
DATESBETWEEN(
    FactInternetSales[OrderDate].[Date],
    DATE(2007,8,1),
    DATE(2007,11,16)
    )
)

DatesInPeriod vs DatesBetween
Now let’s see if we use the DatesBetween for calculating the period and get the start and end of that period what we get as a result;
First DatesBetween =
FIRSTDATE(
DATESBETWEEN(
    FactInternetSales[OrderDate].[Date],
    DATEADD(LASTDATE(FactInternetSales[OrderDate].[Date]),-1,YEAR)
    ,LASTDATE(FactInternetSales[OrderDate].[Date])
    )
)
and the calculation for the end of the period;
Last DatesBetween =
LASTDATE(
DATESBETWEEN(
    FactInternetSales[OrderDate].[Date],
    DATEADD(LASTDATE(FactInternetSales[OrderDate].[Date]),-1,YEAR)
    ,LASTDATE(FactInternetSales[OrderDate].[Date])
    )
)
Here is the result compared to DatesInPeriod;

As you can see in the above screenshot, the output of DatesBetween INCLUDES both start and end date, it will start from 30th of April 2006, while the DatesInPeriod starts from 1st of My 2006. so the first difference between these two functions is that one of the is inclusive of both dates (DatesBetween).
DatesBetween is a period of dates inclusive of both start and end date. DatesInPeriod is giving you the period of dates and excluding unwanted dates.
Another difference between these two is the input parameters that you have. Sometimes, you have the start and end date, and you want to get all dates in that period, DatesBetween is definitely a good function to use in this situation. Sometimes, you do not have both ends of the period, you just have one, and the interval, in that case, DatesInPeriod is your best friend. There are many scenarios that you can use DatesBetween and DatesInPeriod instead of the other one, here is an example that I wrote a previous dynamic period calculation with DatesBetween.
If you have the start and end date, and you want to get all dates in that period, DatesBetween is definitely a good function to use. However, Ssometimes, you do not have both ends of the period, you just have one, and the interval, in that case, DatesInPeriod is your best friend
Summary
DatesBetween and DatesInPeriod are DAX functions to give you a period of dates. DatesBetween gives you dates from a start date to an end date. DatesInPeriod will give you an interval of dates from a particular period. Each function has its own usages, you can tweak and change your expressions with each of these functions to get the same result as the other function (like anything else in DAX!). However, these two functions will give you good power in different situations of calculating a period.


Reza is author of more than 14 books on Microsoft Business Intelligence, most of these books are published under Power BI category. Among these are books such as Power BI DAX Simplified, Pro Power BI Architecture, Power BI from Rookie to Rock Star, Power Query books series, Row-Level Security in Power BI and etc.
He is an International Speaker in Microsoft Ignite, Microsoft Business Applications Summit, Data Insight Summit, PASS Summit, SQL Saturday and SQL user groups. And He is a Microsoft Certified Trainer.
Reza’s passion is to help you find the best data solution, he is Data enthusiast.
His articles on different aspects of technologies, especially on MS BI, can be found on his blog: https://radacad.com/blog.
nice!
Where do I get the sample data(AdventureWorksDW) to test?
Very clear and concise explanation of another tricky subject in DAX. Thanks Reza for sharing your advanced knowledge of this.
Thank you for the article!
But I can not understand how I can do that the difference between the two dates are displayed in a column.
for example, there is a column with dates 01/12/2018 and following it 12/05/2018.
And in the table I want to see:
12/01/2018 12/02/2018 12/03/2018 12/04/2018 12/05/2018
1 1 1 1 1
Hi Anton.
can you give me an example of a data row in the source table with the value of that column, and then what is the expected output?
Cheers
Reza
DATESINPERIOD seems to work fine at the end of the month, I’m seeing odd behavior when used during the month. When looking at a calendar date ending 10/6/2019 using DATESINPERIOD to go back one month appears to go back to 10/1/2019 instead of 9/7/2019. Is this the expected behavior for the measure?
First Date:=FIRSTDATE(DATESINPERIOD(‘Calendar'[date],MAX(‘Calendar'[date]),-1,MONTH)) gives 10/1/2019
Last Date:=LASTDATE(DATESINPERIOD(‘Calendar'[date],MAX(‘Calendar'[date]),-1,MONTH)) gives 10/6/2019
The calculations seems to match expectations at the end of the month.
Hi Bill
It depends on what is the boundaries of your date/calendar table.
if your calendar table doesn’t have a date before your first month, then starting point always would be starting of that month. Otherwise, it would start from the same date last month.
here is an example:
date table starts from 1st of Jan 2005.
if I have a DatesInPeriod of -1 month calculating the date period from 7th of Jan, the period would start from 1st of Jan, because there is no earlier days than that in the date/calendar table.
However, if I have a DatesInPeriod of -1 month calculating the date period from 7th of Feb, the period would start from 8th of Jan to 7th of Feb, which is correct.
Cheers
Reza
How could you add an additional column that would bring back the sales amount from the date calculated?
Hi.
Can you please explain what you are looking for exactly? a column to show the sales of the current date? you don’t need a column for that. you can just use a measure with Sum(sales column)
Cheers
Reza
I modified the formula to try and get the last 30 days worth of data for a specified column. It doesn’t throw an error, but the column just shows blank on my table. Any idea why this would be happening? Here is the formula showing how I changed it to try and get it to work for my table:
30 Days Margin$ =
CALCULATE(
SUM(‘2019 Dispatcher Data'[Margin$]),
DATESINPERIOD(
‘2019 Dispatcher Data'[Ship Date].[Date],
LASTDATE(‘2019 Dispatcher Data'[Ship Date].[Date]),
-30,
DAY))
Hi John
It is an arrow in the dark try to evaluate your expression without seeing your PBIX file and visualization.
I see that you have used the default date table here. is that also used in the visualization?
Cheers
Reza
very useful and clear explanation – thanks
??
Hi Reza,
I am trying to create running total for my [serviceAmount] field.
The issue i realized when trying to create a chart is the FiscalYear slicer present on the page.
The Following measure works perfectly when a single year is selected, but when there are more than one selection regarding the fiscal years it does not sum up for the dates in those selected period.
Does the DatesYTD function only work for a period of 365 days? or One year?
How do i give make the starting and ending dates in the DatesBetween function dynamic? i.e –> to be calculated based on the year selection coming from outside the DAX query through the Year Slicer..
I want the DAX function to SUM the ServiceAmount and give me a Running Total based on the years i have selected.
Var x = CALCULATE(
SUM(Table[ServiceAmount]),
DATESBETWEEN(
Dates,
CALCULATE ( MIN ( Dates[DateISO].[Date] ), ALLSELECTED ( Dates[DateISO] ) ),–StartDate,
CALCULATE ( MAX ( Dates[DateISO].[Date] ), ALLSELECTED ( Dates[DateISO] ) )–EndDate
)
)
RETURN
x
— The measure above gives an error saying Datesbetween and DatesInPeriod only accepts date column reference as a first argument.
Your advice would be of great help.
Thanks ,
vinS
Hi Vin
In order to help you with the DAX code, I need to have access to your PBIX file.
As a general note, however, you can use the approach I mentioned here to calculate totals.
Cheers
Reza