
A decision tree is one of the main approaches to machine learning. it is a really powerful tool for the aim of
- Prediction
- Descriptive analysis
- and feature selection
In this post, I am going to show how decision tree works.
In the future posts, I will show you some of the main algorithms for decision tree with R or Python. Also, in the later posts, you will see how to use it with the aim of predictive, descriptive analysis and feature selection in Power BI report and Power Query. In this post, I will focus on how decision tree works.
How decision tree helps Decision Making?
A job seeker decision decision-making for different jobs.
Imagine there are different jobs that a job seeker able to apply.
however, he has some criteria for his selection as below
first and important question
1-what is the Role?
Second important question
2-annual Salary or hourly rate
and the third important one
3-How many time per year I have to travel abroad
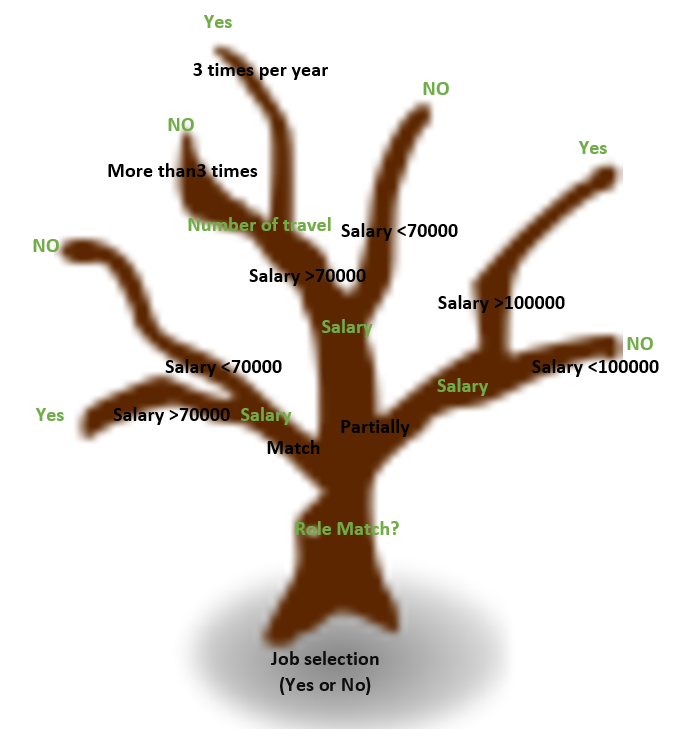
we can simulate his decision-making process as below image. The root of the tree is the main decision point that is saying yes or no.
Then the main important criteria are to check the job title matches the expertise or not.
Then the second important criteria are salary. Finally, if there is no leaf, the third criteria is to check the number of travels per year.
this is the same process we do for decision making.
However, a good point about decision tree is that it uses information gain theory to identify what is the main criteria for tree branching. So in above example, a decision tree will just get the predictive column (Yes or no to a job) and the other criteria. then based on information gain and entropy theory it identifies which attributes among other should be used for first branching (in above example, Job title). that is why we can use Decision Tree with the aim of feature selection in many classification problems at least.
How does Decision Tree decide to branch based on which attributes?
imagine that we have data as below:
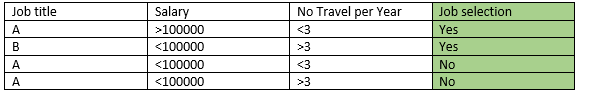
we want to know which criteria (Job title, Salary, or No Trave; per Year) is better classifier for job selection (Yes or no).
look at the below charts:
the first one shows the Job title regard the Job selection status. for some probability, I can say, if job title A the chance to say No is higher than Yes.
While in the second one, the job title regarding the Job selection status, for salary <100000the chance to say No is a bit higher.
However, for the last chart, job title regarding travel per year, all status is the same, so I could not decide to say Yes or NO based on the travel per year.

in other words, Job title and salary are a better measure for classifying the Job selection status.
Now let’s look at some mathematics things!
Entropy calculation:
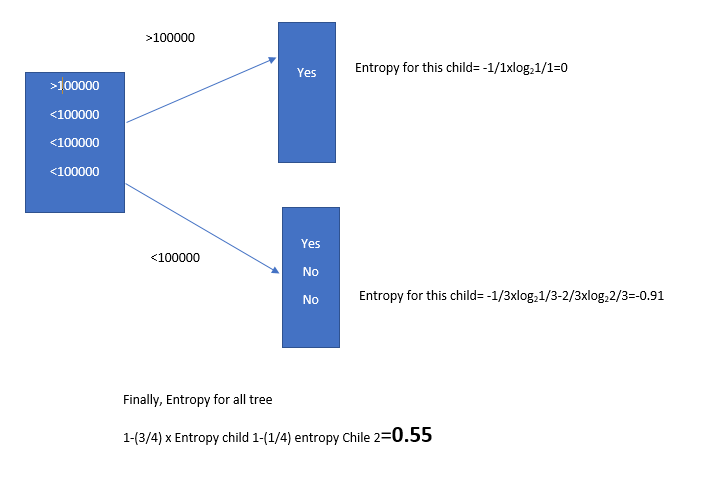
In parent node, I have the job title data (3 for A and one B), No I group them as below to see for job title A what I have for Job selection
for instance, for Job title A, there are one YES and two NO (number 2 in the below picture), while for Job title B we have one YES. now we calculate Entropy for each leaf, for top leaf we calculate the entropy.
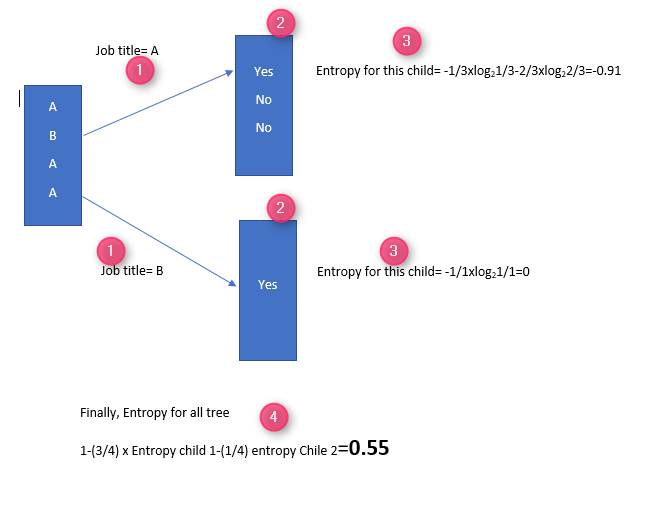
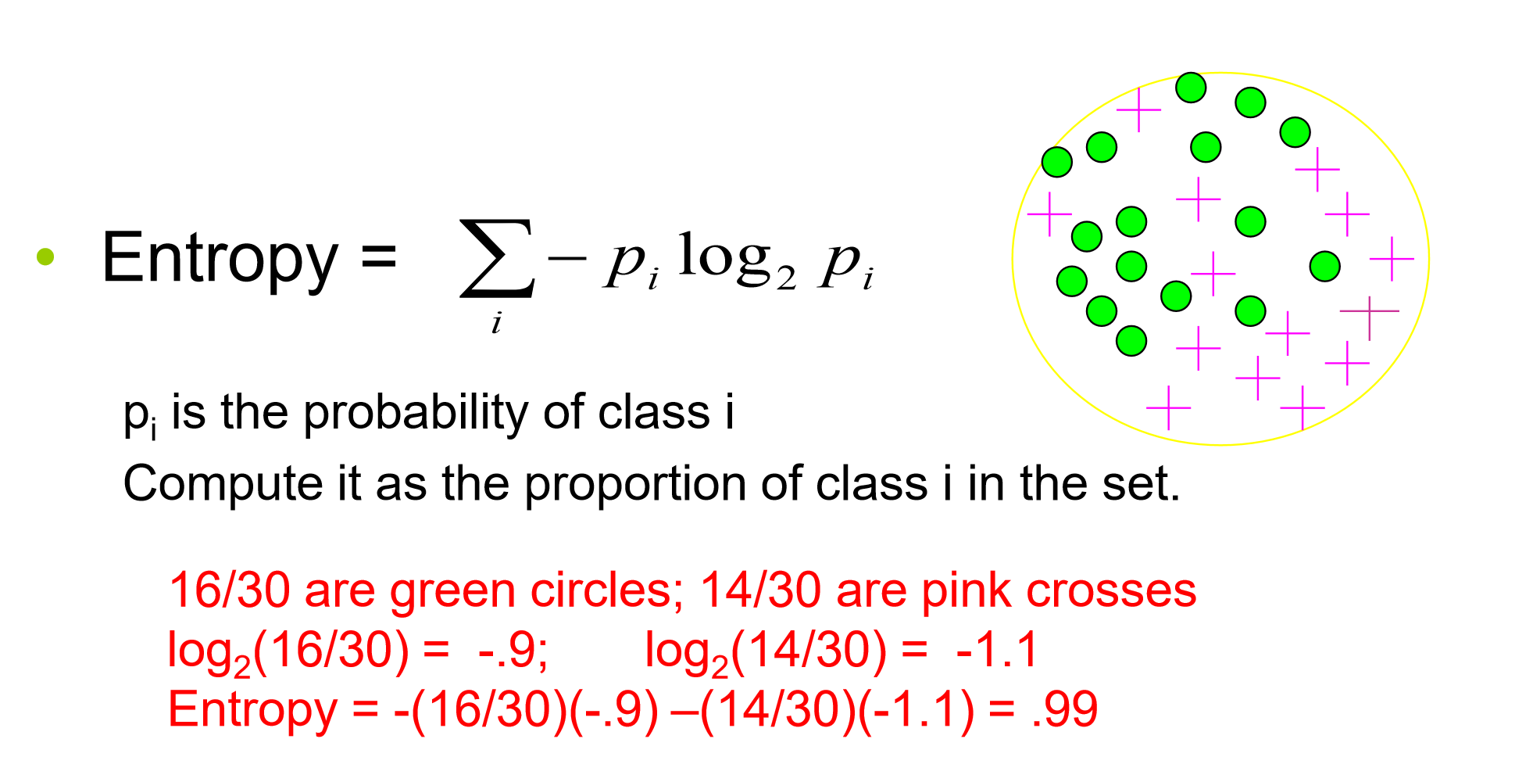
According to [1], for calculation of Entropy, we need to calculate the Probability of YES and NO.
for instance in above picture, in the child in the top, the probability for YES, is 1/3. the probability for NO is 2/3. so we calculate the Entropy using formula. the final probability is about 0.55.
the higher Entropy the better result and better attributes for classification.
I have to repeat the calculation for other attributes: Salary and Number of travel per year.

So for Salary and Job title, we have better (greater) Entropy. This two attributes can be a good measurement for branching tree. Moreover, in case of feature selection, we can rely on these two attributes.
in future posts, I will show you some of the main usages of the decision tree for predictive and descriptive analysis using Power BI custom visual.
[1] https://homes.cs.washington.edu/~shapiro/EE596/notes/InfoGain.pdf


