
In the last Part, I have talked about the main concepts behind the Decision Tree.
In this post, I will show how to use decision tree component in Power BI with the aim of Predictive analysis in the report. in next post, I will explain how to fetch the data in Power Query to get a dynamic prediction.
for prediction, we have two approaches.
Predict a value and Predict a group
Decision tree able to handle both.
Predict a group (classification)
There is a Hello world dataset in Data science world name “Titanic”. This dataset has information about the passengers who survived or not from the disaster. this dataset holds some information such as age, gender, passenger class, and so forth.
I am going to predict people with specific age, gender, passenger class will survive or not.
the first step is to import the custom visual from the office store. to get a custom visual from power BI website you need to sign in to the portal (number 1). Next just click on the 3 dots in visualization area and choose the “import from the store” (number 2).

in Power BI office store on the left side choose the “advanced
analytics”, then search for “Decision Tree”.

- when you imported the custom visual, there is a possibility that it started to install some packages like “rpart” and so forth.
- Also, you should have a version of the R on your machine to be able to see this chart.
- this chart is one-way interactive (i.e. power bi visuals able to slice the chart but by clicking on the chart you are not able to slice the other charts )

now after the importing the visual, it is so easy to use it, just click on the visual to have it in the white area.
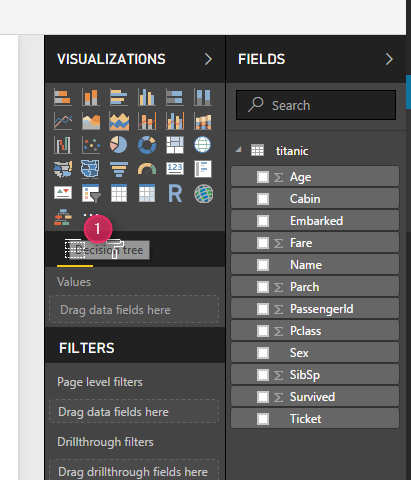
In this stage, we have to choose the fields for decision making.
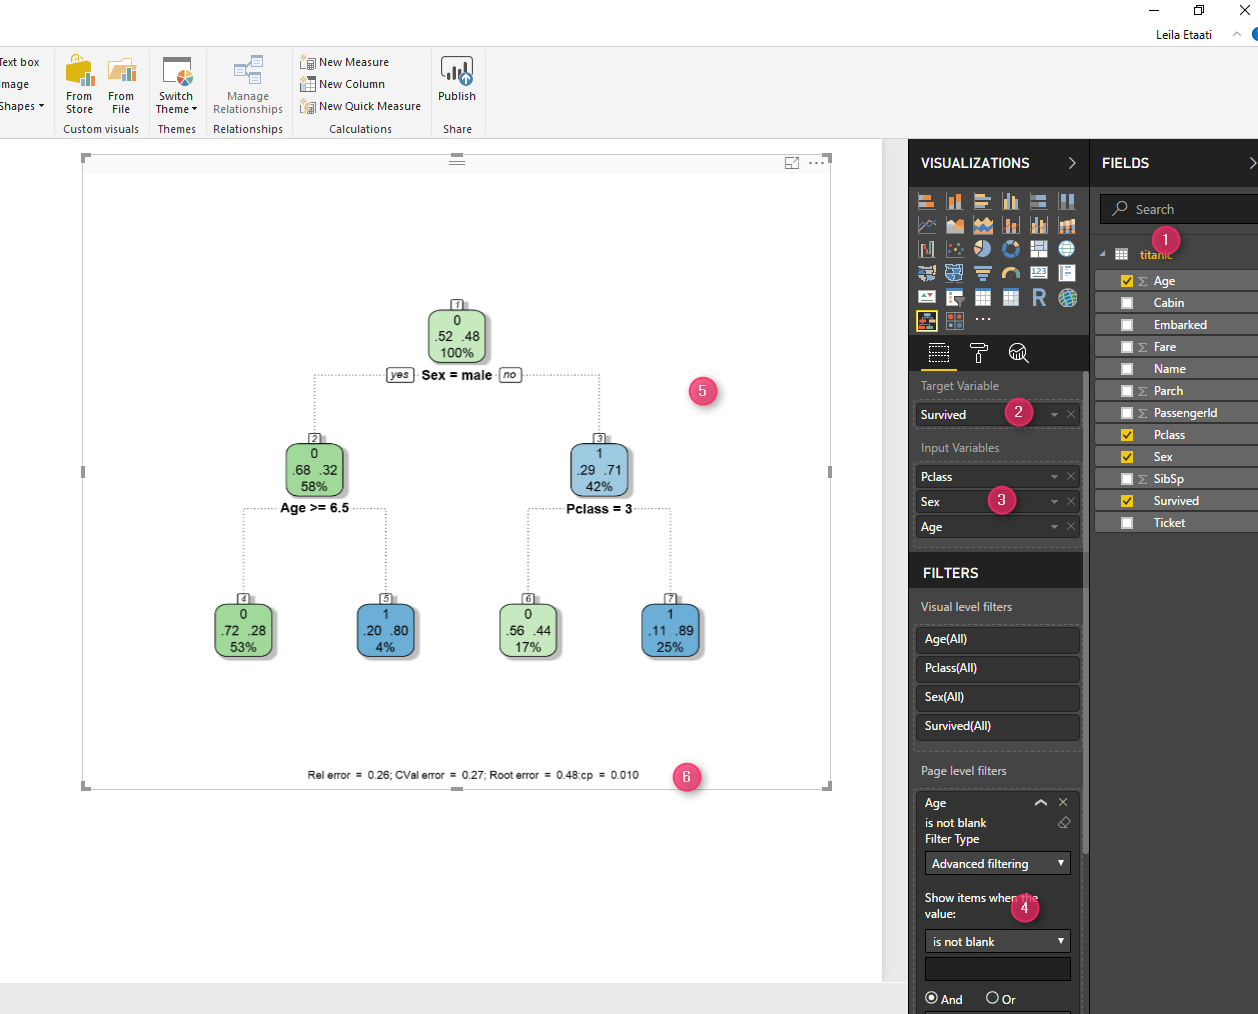
the main aim (target) is to predict whether people survived or not. To do that, first I choose a couple of columns such as “age, gender, and passenger class”. Then I put the “Survived” column as the target variable., The next step is to remove the missing values “blank) from the age column.
Finally, below picture (deciiosn tree) has been shown in below Power BI report.
Let’s see what that mean?
at the root, we have 4 numbers
- 0: stand for people, not survived ad green colour. So, in general, many people not survived.
- 100%: all data is at the root
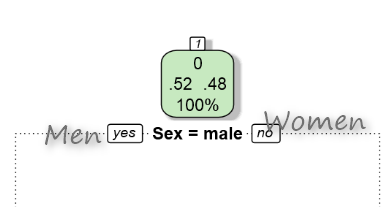
- 0.52 and 0.48: show that about 0.52 are men and 0.48 are women. so the first attributes that Decision tree decided to analysis are the gender of people.
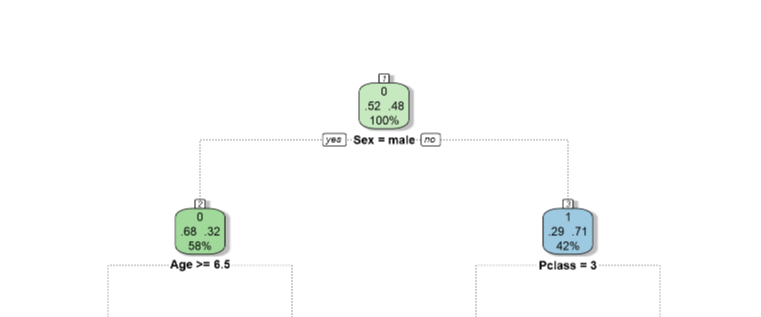
in other nodes, for instance, the node in the left
- Analysis the men
- most of them not survived (0).
- The second attribute that is going to analysis if the age of people if they are less than 6.5 or more
and finally, we have the results and rules in the leafs as below
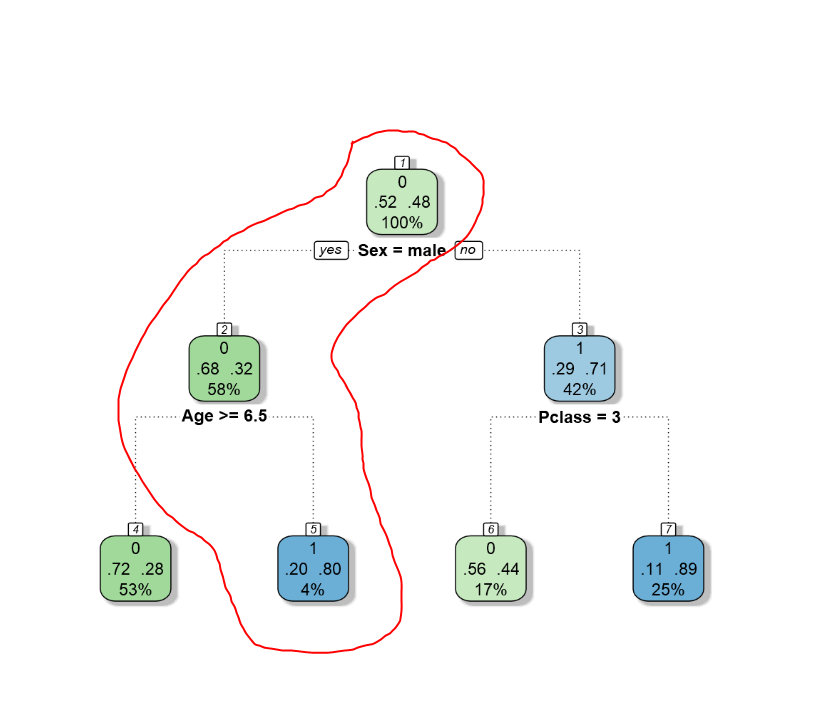
people who are men (root) and greater than 7 years old (second node), they will not survive (green and 0) that is 53% of cases
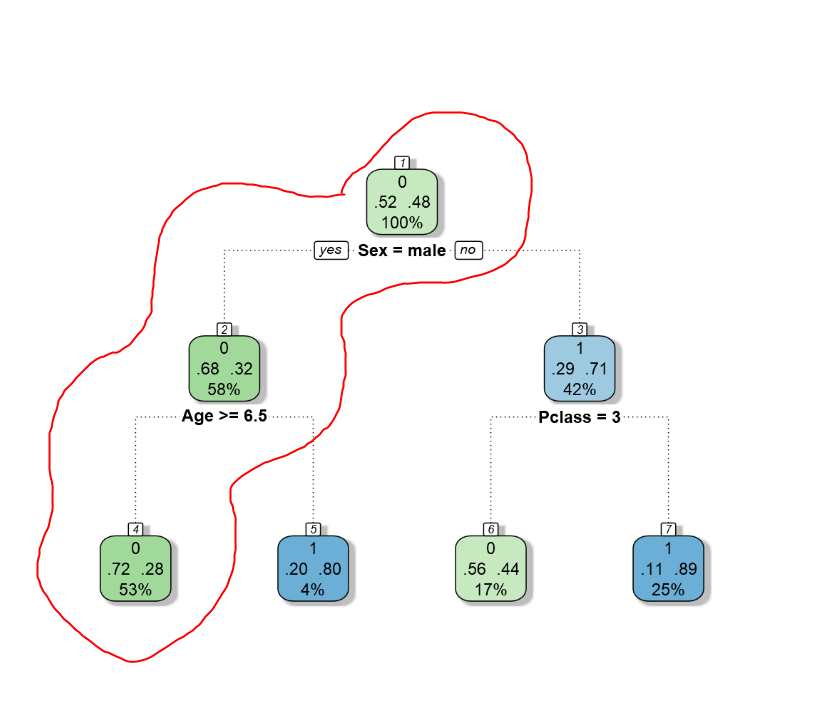
people who are men and less than 7 years old will survive (only 0.04 of data)
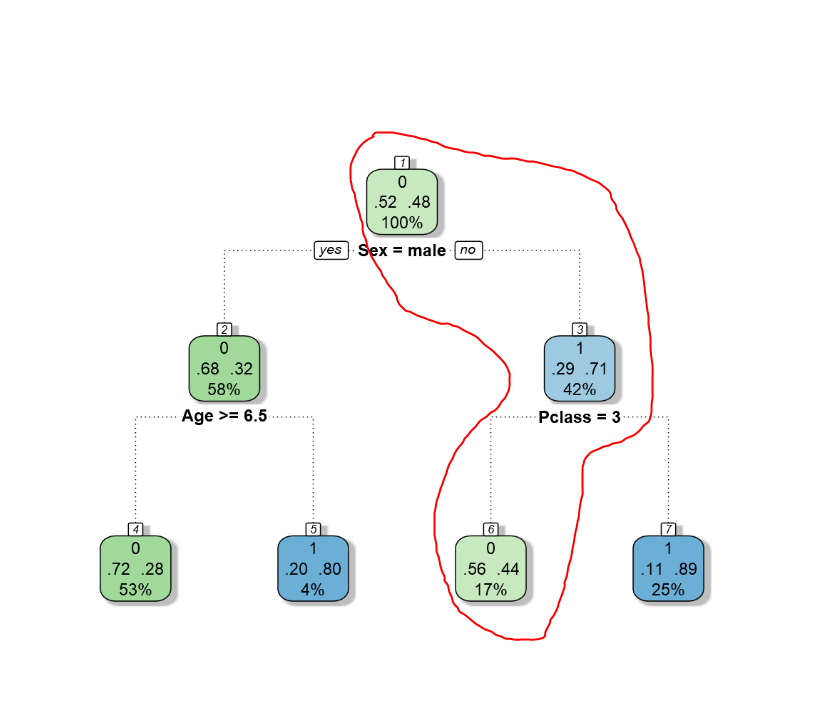
people who are female, if they are passenger class 3, they are not going to survive (17% of people has this condition)
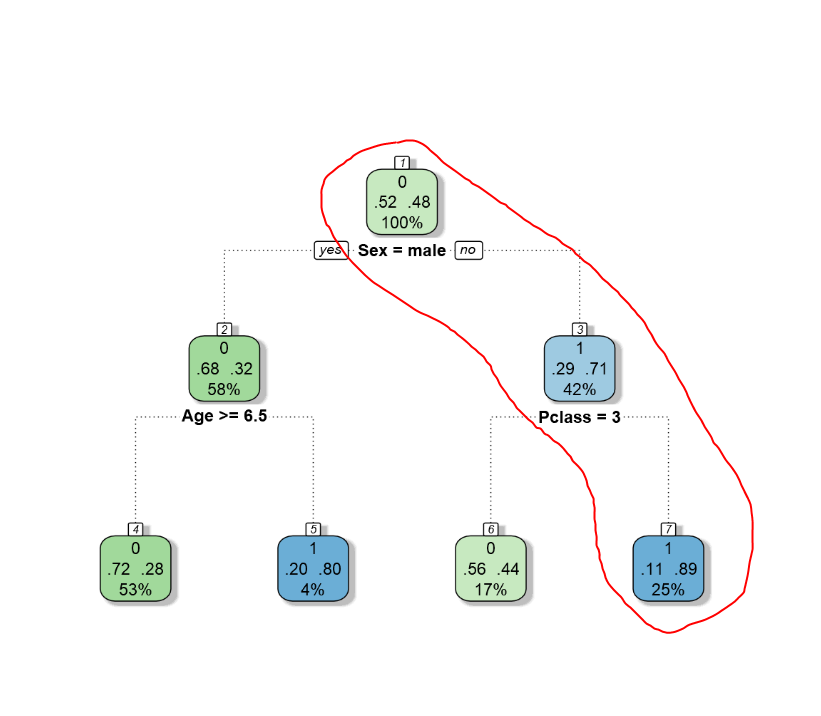
passengers who are female and they are passenger class 1 or 2 will survive (25% of people)
in the next posts, I will show a simple example for prediction a value also I will talk how to write R codes for this example. Also, I will talk about the arguments and parameters.


