
A recent post to the Power BI community desktop forums asked if it might be possible to allow a user to make a slicer selection that dynamically updates the x-axis. The idea would be to present the end user with a slicer on the report page with options of Year, Quarter, Month and Day and when the user selects one of the options, visuals react accordingly and display the appropriate aggregated values.
The approach I came up with uses a disconnected table for the slicer values and a calculated measure that chooses the appropriate relationship between the data and date table to group and sum the data.
First of all I use the following DAX to generate a table of data that we will aggregate.
Data Table =
    ADDCOLUMNS(
                CALENDAR(DATE(2012,1,1),TODAY()),
                "My Value", RANDBETWEEN(1,4) ,
                -- Now add three columns to represent the groupings
                "Month" , DATE(
                                YEAR([Date]),
                                MONTH([Date]),
                                1) ,
                "Quarter" , DATE(
                                YEAR([Date]),
                                MONTH([Date]) - MOD(MONTH([Date])-1,3),
                                1),
                "Year" , DATE(
                                YEAR([Date]),
                                1,
                                1)
                )
This creates a row per day from the start of 2012 until today and generates a random number in the [My Value] column which we will use to dynamically sum.
The next three columns (Month/Quarter/Year) generate a new value that aligns the date for each row back to the first day of each Month, Quarter and Row.
Next I generate a simple date table using the following code:
Dates = CALENDAR(DATE(2012,1,1),TODAY())
Once the date table has been created, create 4 relationships between the two tables.
The first being between ‘Data Table'[Date] and ‘Dates'[Date] as follows :
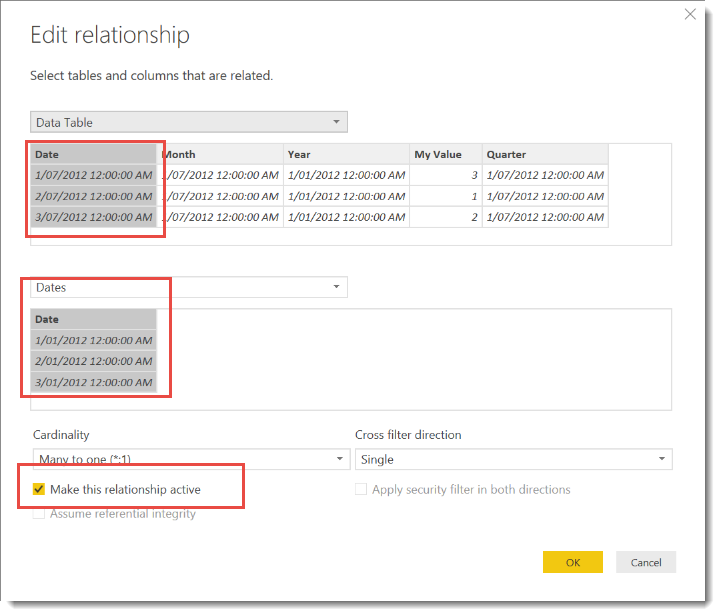
Be sure to mark this relationship as active – although it won’t affect the final outcome.
Next create a relationship between ‘Data Table'[Month] and ‘Dates'[Date]
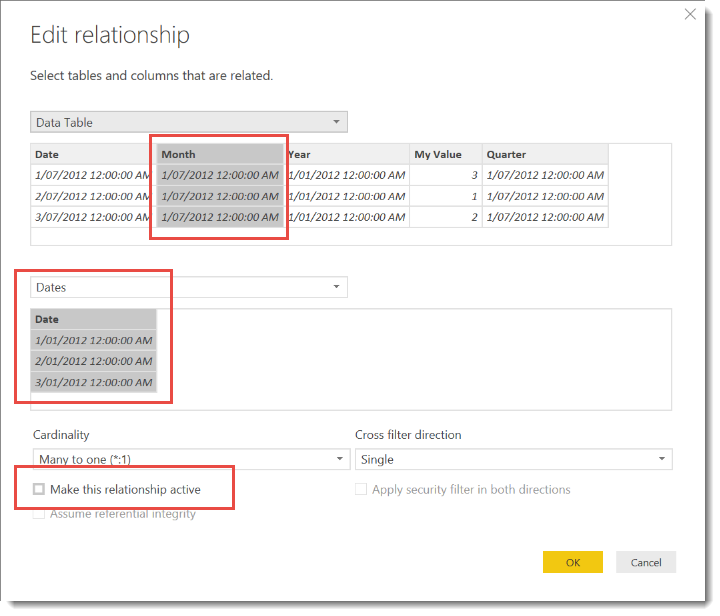 Then repeat to create relationships between ‘Data Table'[Quarter] and ‘Dates'[Date], and finally between ‘Data Table'[Year] and ‘Dates'[Date]

You should have 4 relationships between the two tables.
Now we need a table for our slicer. I used the Enter Data feature to create the following simple 2 column, 4 row table.

There is no need to create any relationships between this table and any of the existing tables.
The last part of the puzzle is to create two calculated measures:
Sum of My Value = SUM('Data Table'[My Value])
and
Dynamic Measure =
VAR SlicerID =  MAX('Slicer Table'[ID])
RETURN
	SWITCH(
		TRUE() ,
	 	SlicerID = 1 , CALCULATE([Sum of My Value],USERELATIONSHIP('Data Table'[Date]    ,Dates[Date])),
	 	SlicerID = 2 , CALCULATE([Sum of My Value],USERELATIONSHIP('Data Table'[Month]   ,Dates[Date])),
	 	SlicerID = 3 , CALCULATE([Sum of My Value],USERELATIONSHIP('Data Table'[Quarter] ,Dates[Date])),
		SlicerID = 4 , CALCULATE([Sum of My Value],USERELATIONSHIP('Data Table'[Year]    ,Dates[Date])),
	 	0
		)
Now in the report viewer, we can create a Slicer visual using the data from the ‘Slicer Table’ and then some visuals that use the ‘Dates'[Date] column on the x axis. Be sure to use the date field from the Dates table as your axis and not any of the date fields from the ‘Data Table’, then drag the [Dynamic Measure] calculated measure to the values field as shown.
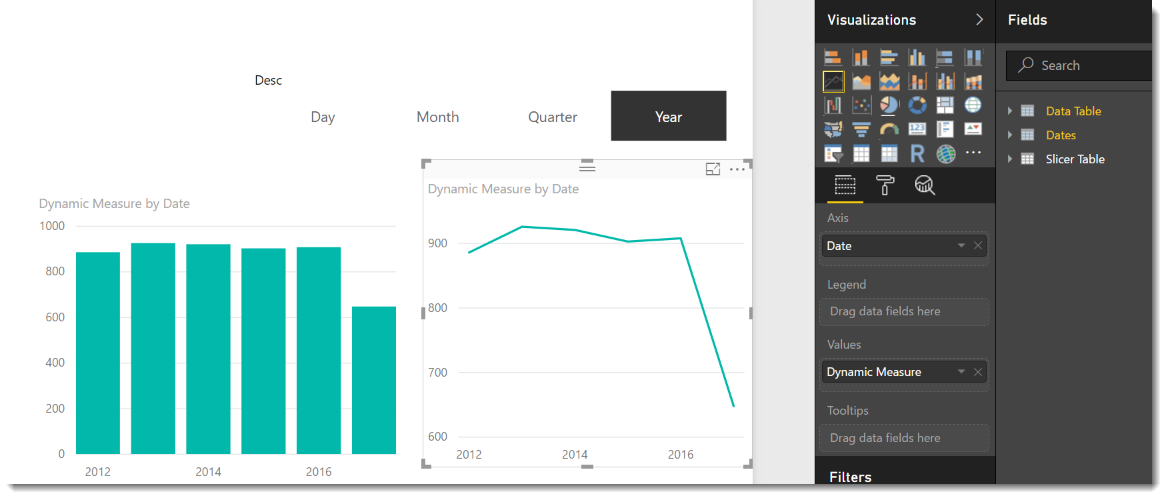

This takes advantage of the USERELATIONSHIP function to dynamically decide based on the current slicer selection, which grouping should be used for the SUM(‘Data Table'[My Value]) column.
This should be pretty easy to add, so long as you are happy with carrying additional columns in your data tables to group records into relevant Months, Quarters or Years. Even with larger datasets, this shouldn’t generate too much extra memory footprint.
You can download a copy of the PBIX file from here.
https://1drv.ms/u/s!AtDlC2rep7a-n1mIeiBbW3A4gMmL


Hi Philip,
Really nice technique here! I’m going to use that quite often I think. However, I have one minor improvement for your SWITCH syntax. Instead of TRUE() you can switch over your VAR SlicerID or even over the MAX() function, then as arguments use 1, calc, 2, calc etc. Makes for a slightly more readable code I think.
I would use the TRUE() when checking for different kinds of checks.
Cheers,
Bas
Hi,
It works correctly, but there is an issue, when you use the additional Calendar columns for slicers (like months, quarters, years), the inactive relationships create a new filtering option in the slicers “Blank”, how to get rid of this stuff? Or how to create the Slicer, so I’ll be able to change the axis, but the month/quarter/year slicers won’t be affected with the extra “Blank” option?
Hello,
Great method. Thanks! On a another note, I am trying to dynamically change the x-axis labels as we switch between the quarters and years to the following format:
Years: FY12, FY13, FY14 etc.
Quarters: 1Q 12, 2Q 12, 3Q 12 etc.
Do you happen to have a solution for this?