
Can you change the format of a measure or a value in Power BI dynamically? Is it possible to set a value to be a percentage sometimes, and sometimes to be a currency? can you change the currency format? The answer to all these questions is yes. In this short blog, I am going to show you how you can do it. There are many samples of this already available. As an example, Kasper de Jonge showed this technique a long time ago in his article here.
Static formatting in Power BI
One way to format values (either columns or measures) is by the format pane settings under the Column or Measure tools.
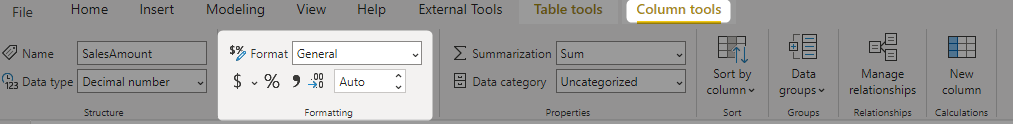
This method is the simple method that can work if you want to set the format for a column or measure.
However, sometimes, you want to do things more dynamically. For example, you might have users in different countries with different formatting requirements.
DAX Format function
The Format function is a simple and powerful function in DAX. This function can be used for generating some format options. The function can be used simply like this:
FORMAT(SUM(Sales[Sales Amount]), '$#,##0')
The first parameter of the format function is the value which we want the formatting to be applied on it, and the second parameter is the format of it. There are many formatting options available, which are suitable for number, date, and etc. Here is a good detailed guide about it;
- Pre-Defined Numeric Formats for the FORMAT function
- Custom Numeric Formats for the FORMAT function
- Pre-defined date and time formats for the FORMAT function
- Custom date and time formats for the FORMAT function
Now the FORMAT function can be combined with some other methods to make the dynamic formatting a possible option.
Parameter table
Parameter table is a disconnected table from the rest of the model. This table can act like a parameter for other calculation. Here in the example below I showed how it can be used to select between measures:
Now these two methods, can work together to build a dynamic formatting.
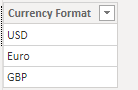
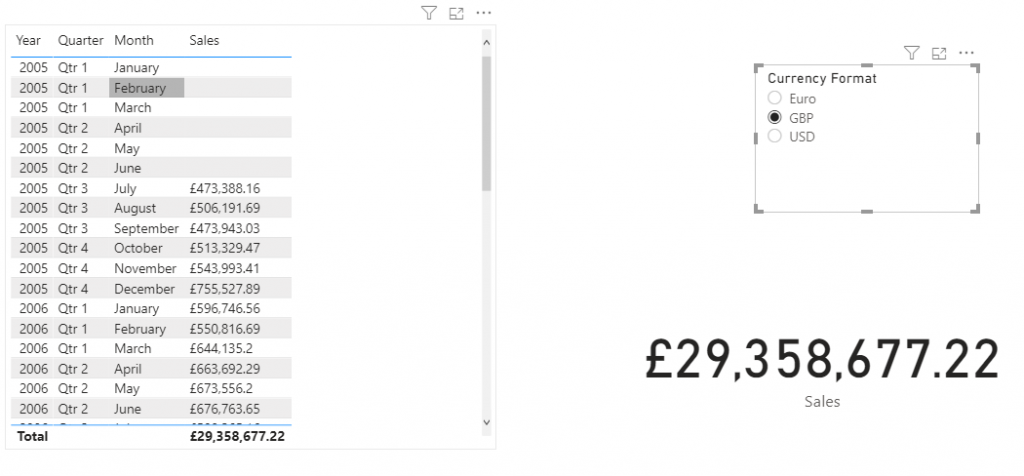
Parameter table for currency
Here I have created a parameter table for the currency values. This table can be created anywhere; In Excel, or another data source, or even in Power BI Desktop.
Dynamic Format Measure
Then I created a measure that dynamically change the format using the value selected from the table above;
Sales =
var _sales=SUM(FactInternetSales[SalesAmount])
return
FORMAT(_sales,
SWITCH(
SELECTEDVALUE('Currency'[Currency Format],'USD'),
'USD','$#,##0.##',
'GBP','£#,##0.##',
'Euro','€#,##0.##'
)
)
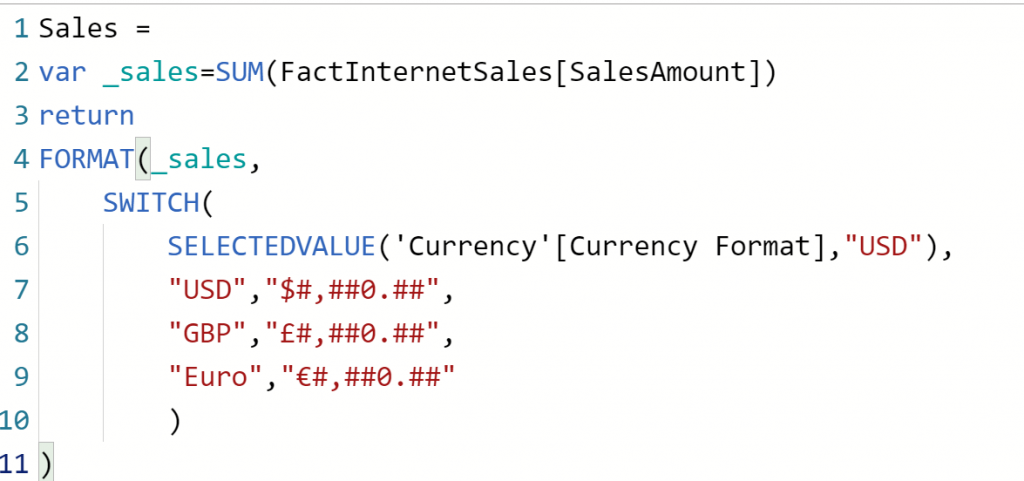
The code above is checking what value is selected from the Currency table (using the SELECTEDVALUE function), and then uses it inside a conditional expression and assign the format string of the equivalent currency to it (using the SWITCH function). Finally, this format string is used inside a FORMAT function to format the measure’s value.
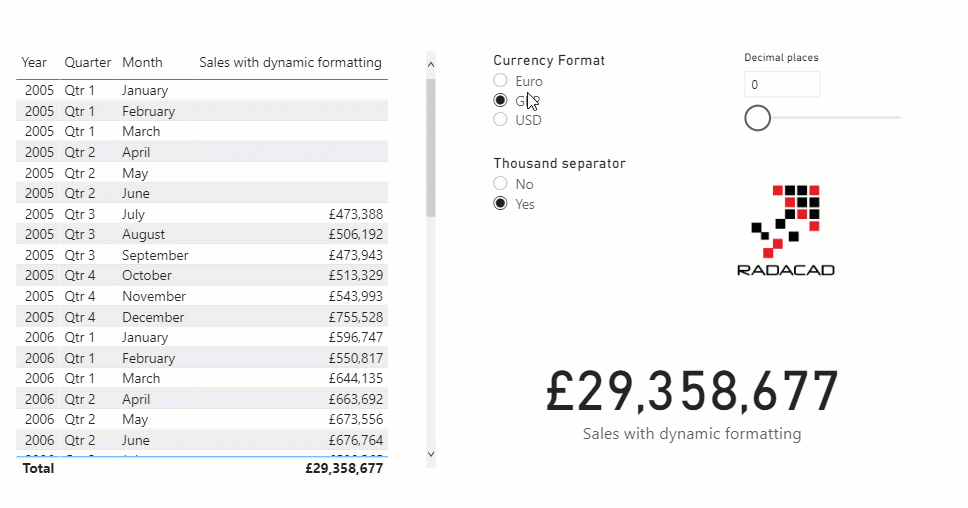
The below screenshot is a glimpse of the result;
Taking it a few steps further
When you use DAX for making things dynamic, then you can always do amazing things. Here is an example:
I created two other tables, one for the Thousand separator;

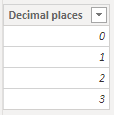
And one for Decimal places;
And I used an expression like below;
Sales with dynamic formatting =
var _sales=SUM(FactInternetSales[SalesAmount])
var _thousandSeparator=IF(
SELECTEDVALUE('Thousand separator'[Enable])='yes',
',')
var _decimalplaces=REPT('#',SELECTEDVALUE('Decimal places'[Decimal places],2))
var _NumericFormat='#'&_thousandSeparator&'##0'
&if(
SELECTEDVALUE('Decimal places'[Decimal places],2)>0,
'.'&_decimalplaces)
return
FORMAT(_sales,
SWITCH(
SELECTEDVALUE('Currency'[Currency Format],'USD'),
'USD','$',
'GBP','£',
'Euro','€'
)&_NumericFormat
)
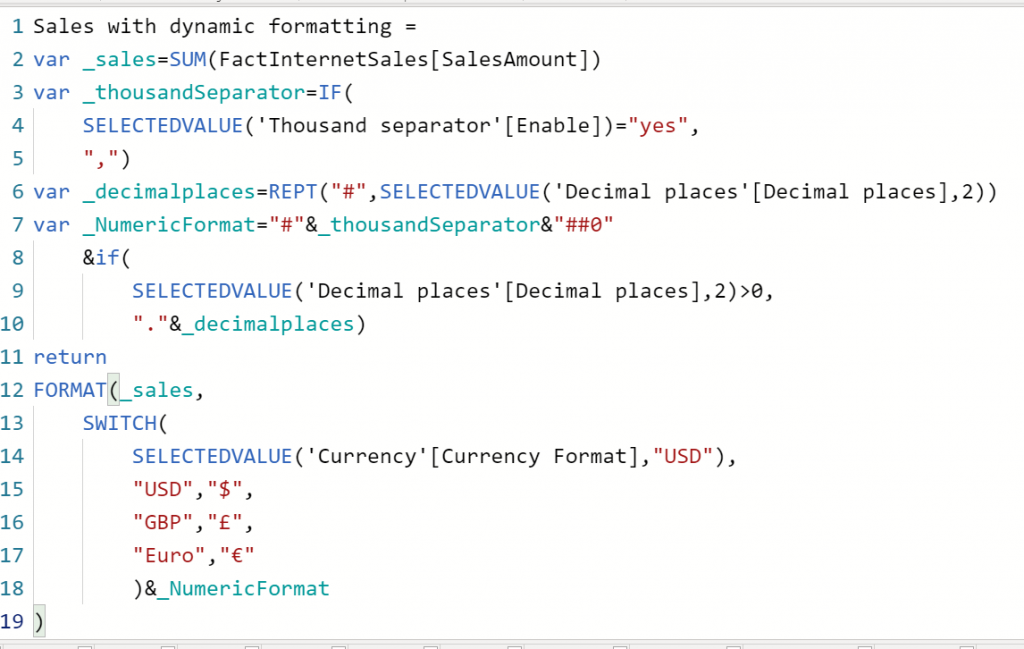
This means that now we can have a dynamic formatting like below in Power BI. This allows enabling or disabling the thousand separator, removing or adding decimal places and currency change.
Consideration
One important consideration of using this method is that the return value of your measure or column would be of the TEXT data type (within the format string defined).
Download Sample Power BI File
Download the sample Power BI report here:
Video
Summary
DAX is the answer of making many things dynamic in Power BI. In this blog, you have seen how you can use the FORMAT function with the aid of some other functions such as SWITCH and SELECTEDVALUE to make the formatting of a field dynamically possible. Let me know in the comments below if you have a situation that you can or can’t apply this method and why.


Reza is author of more than 14 books on Microsoft Business Intelligence, most of these books are published under Power BI category. Among these are books such as Power BI DAX Simplified, Pro Power BI Architecture, Power BI from Rookie to Rock Star, Power Query books series, Row-Level Security in Power BI and etc.
He is an International Speaker in Microsoft Ignite, Microsoft Business Applications Summit, Data Insight Summit, PASS Summit, SQL Saturday and SQL user groups. And He is a Microsoft Certified Trainer.
Reza’s passion is to help you find the best data solution, he is Data enthusiast.
His articles on different aspects of technologies, especially on MS BI, can be found on his blog: https://radacad.com/blog.
Great article. However, there are some constrains depending on the visual you want to use. You cannot place such measures as values for a bar chart. Because this kind of visual expects numbers or percentages to be displayed. Thus, if you convert a number into a text (and this is what you do in this article) you won’t be able to use it in the values section of such a visual.
Hi Dom
Yes, this method won’t work if you use the value in a chart that aggregates values, such as bar chart. because the FORMAT changes the value to the TEXT.
if you really want to have the value as the $ or amount or quantity and %, then Tabular editor gives you better options for it.
Cheers
Reza