

Fifa 2014 is not a hot topic these days, but it was the headline news June 2014. With new capabilities in Power BI Designer I tempted to use FIFA 2014 Worldcup data as a demo of it, and play with the tool to see how it works. Fortunately I was able to build some interesting dashboards with it. The demo work was interesting enough to say that I probably would write detailed information about how to build such demo, and would use it in some of my conference speakings.
I’ve used data from official Fifa.com website for most parts of this demo. you can reach FIFA.com official site for 2014 Brazil from here:

http://www.fifa.com/worldcup/archive/brazil2014/index.html
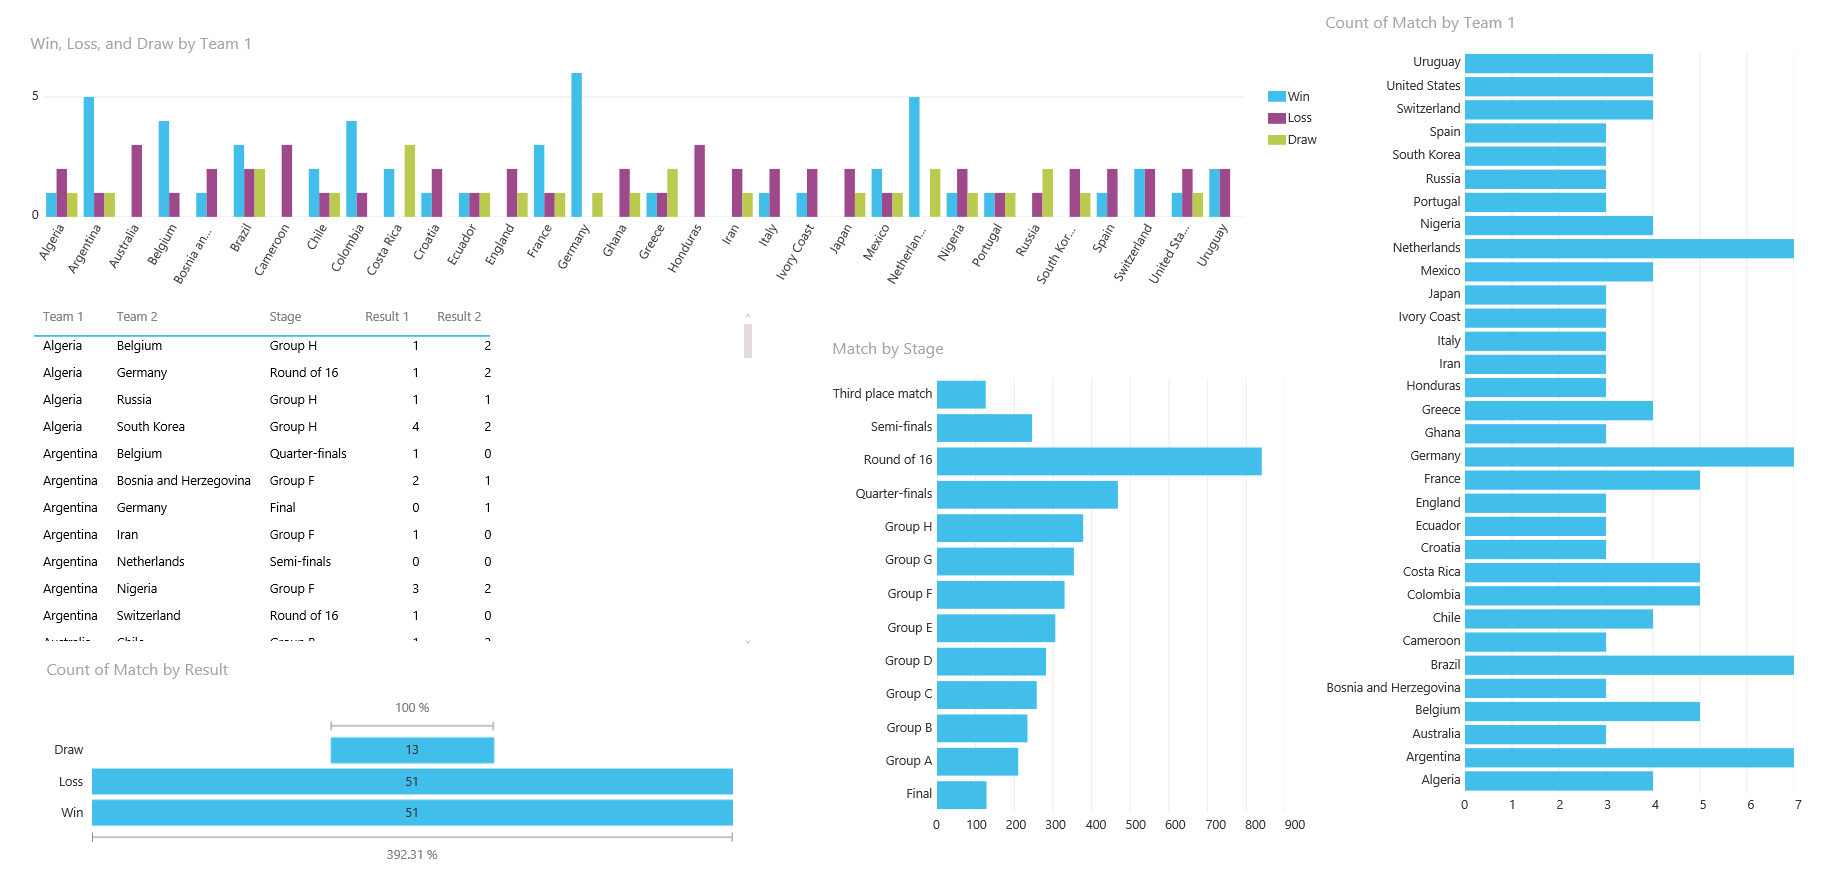
For those of you who might not be fan of Football; the end result was Germany won the cup. So I’ve tried to build some dashboards to not only show the overall statistics of the match, but also highlights how/why Germany won the cup. I started with data sets that has matches information for this world cup, and I’ve ended up having a Match analysis dashboard as below. the dashboard shows number of matches played by each team, stage of match (group stage, round of 16,Quarter-finals, semi-finals, or final), details of each match in a grid view, number of Wins, Losses, and Draws by every team.
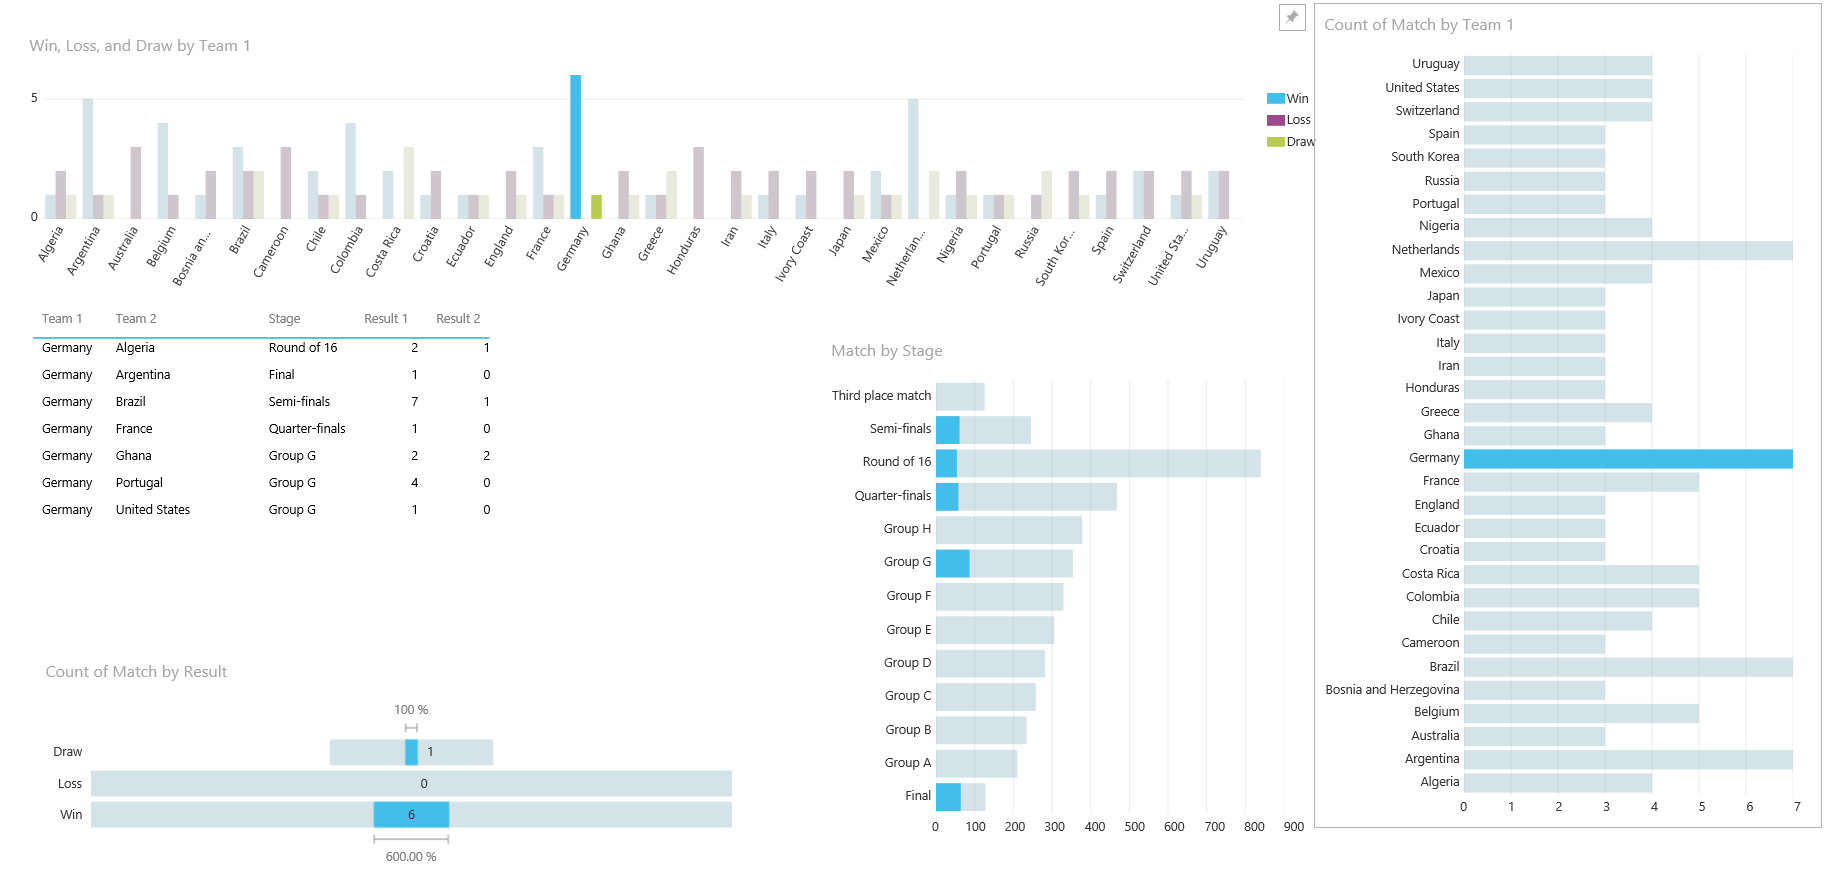
The dashboard can show more meaningful result when you highlight a country. In following you see that If I highlight Germany, it will show the group that Germany raised from, all matches of Germany, and Number of wins, losses, and draws of this country. as you see in screenshot below Germany had 6 wins and one draw. details of matches shows that the only one draw was against Ghana at the group stage.
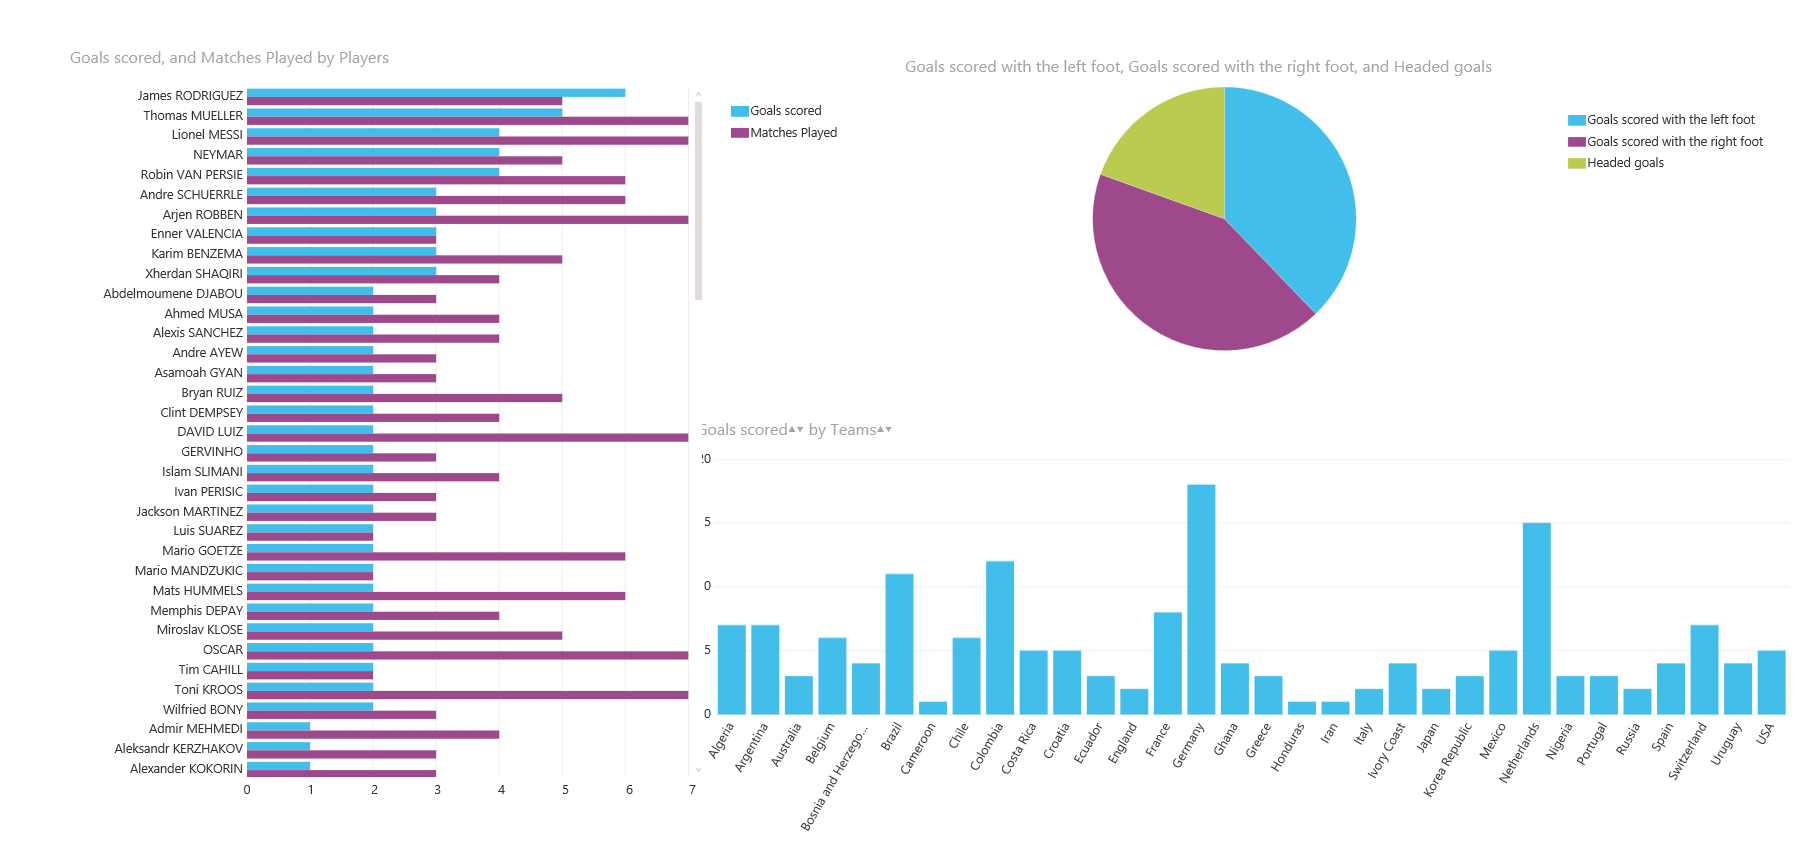
Then I started building a dashboard for Goals scored in this tournament, I used the goal scorers data from FIFA.com website and combined that with team’s goal scored. as a result I’ve ended up with building a dashboard that shows top goal scorers for FIFA 2014, with number of matches they played. As an example you see James Rodriguez top scorer with less matches played compared with other top 6 scorers. I’m not a fan of pie chart, as it is not usually obvious understanding of it. However I found that number of goals scored by right foot, left foot, and head are so much obvious in the difference that pie chart show it clearly. and I’ve also showed the goal scored by each country, which as you see Germany, Netherlands, and Colombia are top three here.
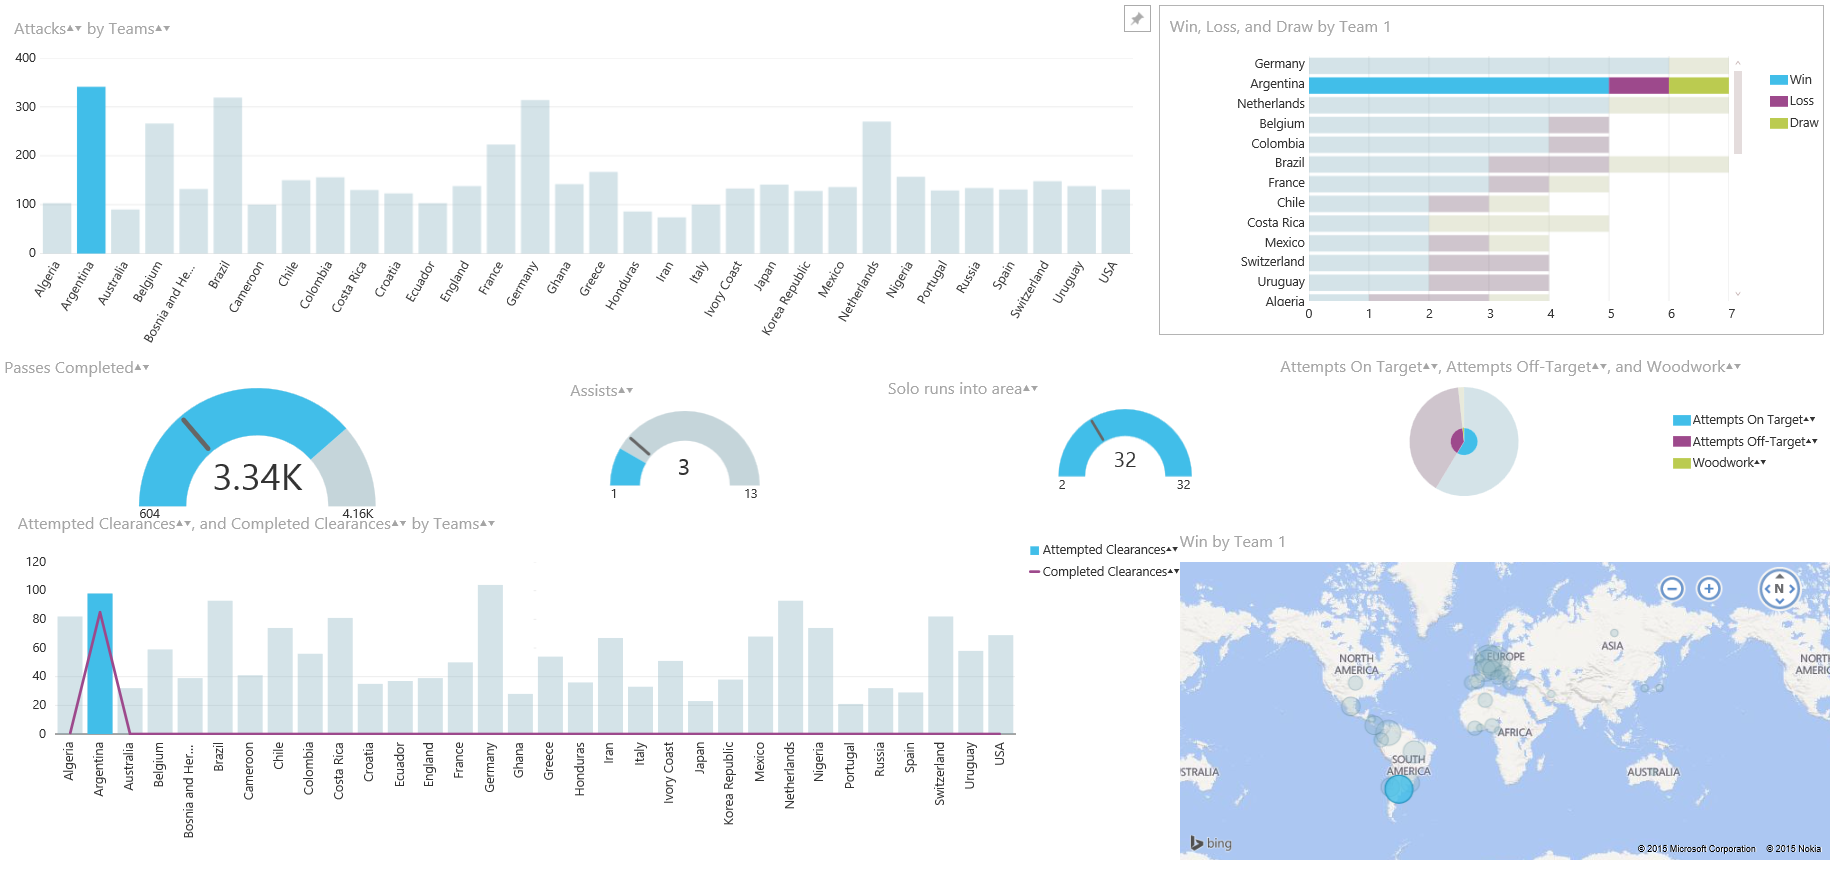
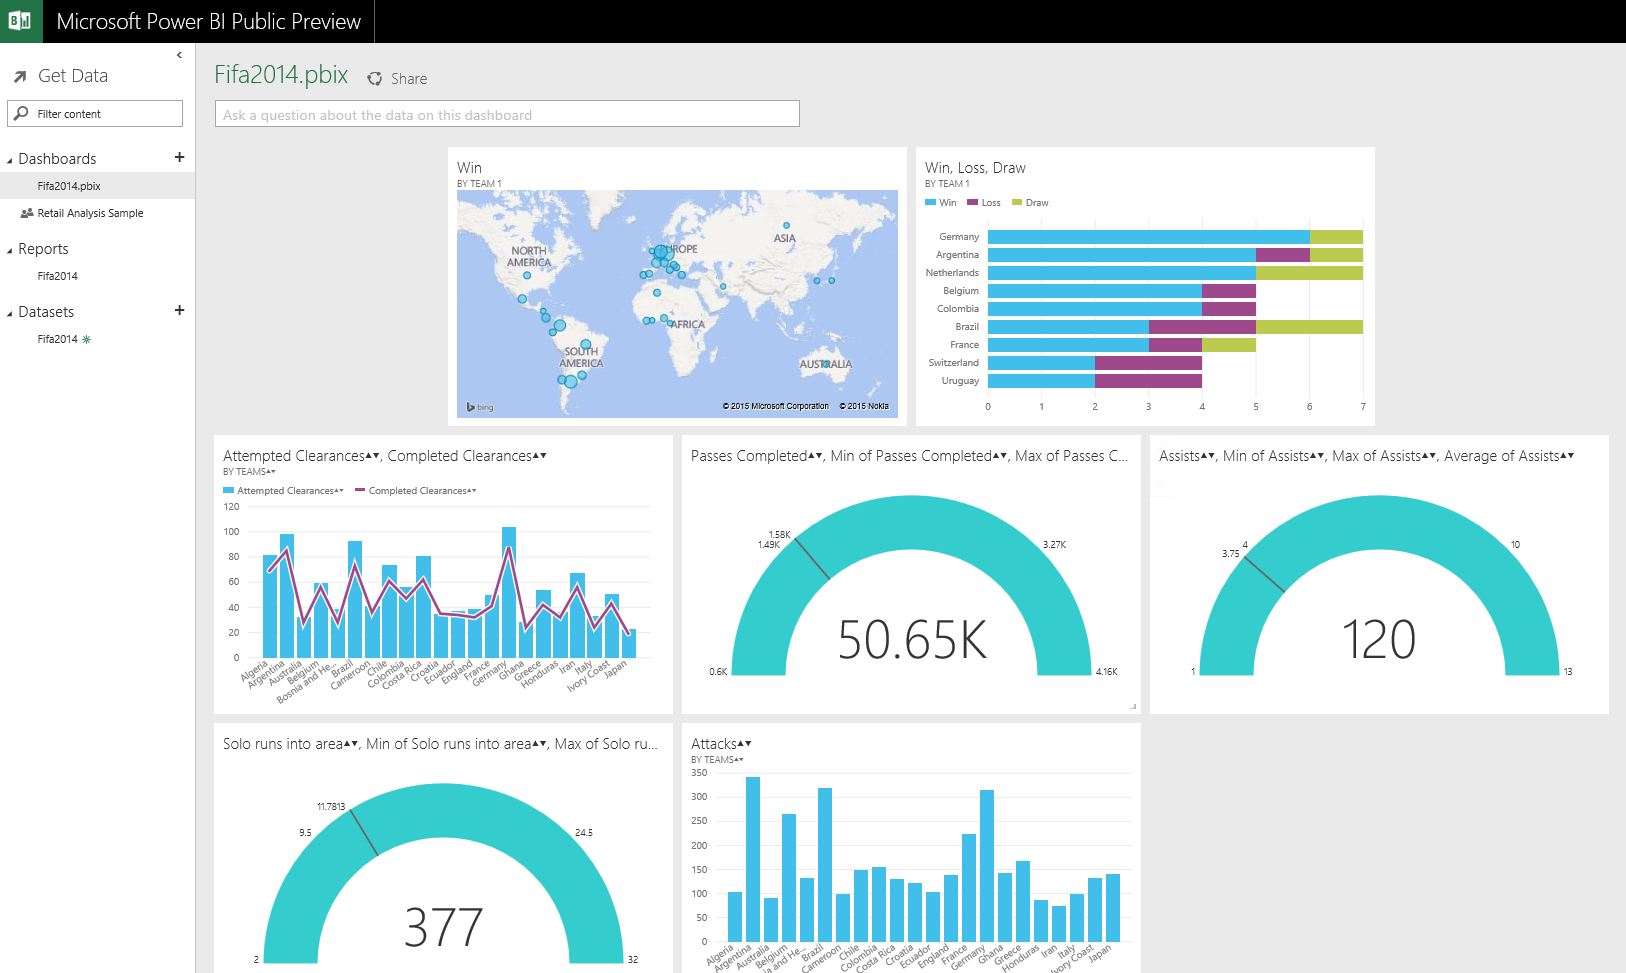
I’ve also used some more team statistics data from FIFA.com website and built a dashboard for team attacks, defends, passes completed, and Win/Loss/Draw ratio. Dashboard below show a map view of teams/countries played in this tournament, a clustered bar chart of their win/loss/draw ratio. a column chart for their attacking, and a combo chart for their defense splitted by attempted clearance, and completed clearance. with some gauges that shows passes completed, number of goal assists, and solo run into the area. a pie chart also shows number of attempts on the target, off-target, and oh yea Woodwork!

Above dashboard is my favorite one, as it can even highlights how/why Germany won the world cup. For winning in the world cup you should not only have an attacking team, you also need a great defense. Football is a match of 11 men, so number of solo runs won’t be a big deal. the best team is the team that do the most assists and the most completed passes. If I highlight Germany in the above chart we will see really interesting results. Germany was not the best attacking team, but it was the best defensive team with the most completed clearance. Germany had the most passes completed through the tournament, the most assists for goal scoring (13 assists which is fantastic), high rate of attempts on target. no wonder Germany won with such great numbers.

Now let’s compare it with Argentina which lost the final game against Germany. Argentina have a good attacking team, with the best solo runs (especially because of Messi). However they don’t have a good result for their assists (only 3 assists in 7 matches), and their number of passes completed are much lower than Germany. Considering the fact that Argentina was also good defensive team, that attacking and defensive strategy helped them to come up to the final, but for winning the cup Argentina definitely needed better passing skills, and try to assist in the goals more.
A Word of Techy
It would be a very long post here if I explain how I did the technical side of this demo. I will write about it in next blog posts. I want to only mention few major aspects of it here in this post. Power BI Designer is the new Power BI editor tool which helps building dashboards and visualization, data transformation, and modelling. Power BI Designer has a combination of three Power BI Components which are:
- Power Query
- Power Pivot
- Power View
With Power Query I’ve wrote queries to get data from FIFA.COM website

Then I’ve created the relationship for modelling
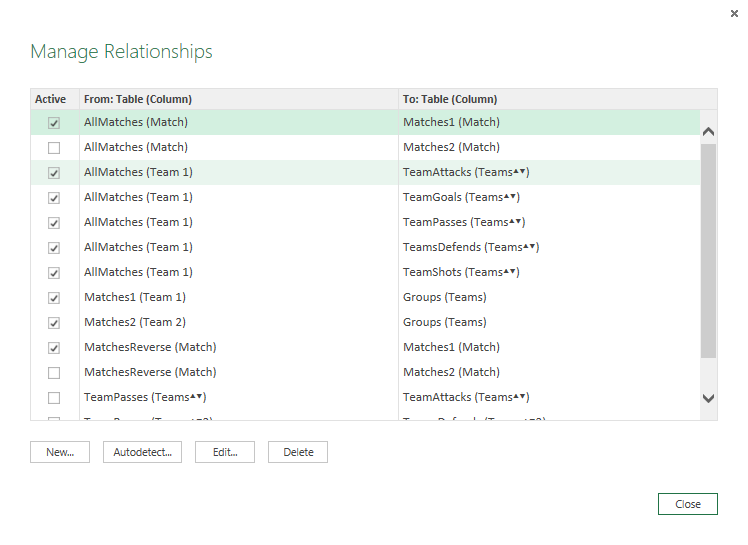
And finally I’ve made reports (which uses Power View component);

After building the demo, simply I’ve uploaded the *.pbix file (Power BI Designer file) into PowerBI.com website. I’ve just simply built some dashboard for it;


Reza is author of more than 14 books on Microsoft Business Intelligence, most of these books are published under Power BI category. Among these are books such as Power BI DAX Simplified, Pro Power BI Architecture, Power BI from Rookie to Rock Star, Power Query books series, Row-Level Security in Power BI and etc.
He is an International Speaker in Microsoft Ignite, Microsoft Business Applications Summit, Data Insight Summit, PASS Summit, SQL Saturday and SQL user groups. And He is a Microsoft Certified Trainer.
Reza’s passion is to help you find the best data solution, he is Data enthusiast.
His articles on different aspects of technologies, especially on MS BI, can be found on his blog: https://radacad.com/blog.
Hi Reza,
Great post.
Can you give me a useful resource about BI, that it helps me to start learning BI?
My knowledge in BI field is in low level, then I want a self-study and totally simple resource.
Thanks in advance.
Dear Alex,
Nice to see you here.
Sure I would do so.
stay tuned for the very next post I’ll put on this website. I will explain BI resources and how to read through.
I would copy the link here as soon as I published it.
Cheers,
Reza
Here is the walk-through post:
http://radacad.com/walk-through-steps-im-new-to-bi-where-to-start-part-1
Stay tuned for next parts.
Cheers,
Reza
Thanks Reza, your new posts are great.
Those were exact things that I want, thanks a lot.
As your ex-coworker, I’m glad to see your success.
Hi Alex,
Thanks for your feedback and kind words. I’m glad that it is helpful.
You are always welcome here 🙂
Cheers,
Reza
Hi Reza,
great post. Is it possible that you post the queries you used to get the data from the fifa.com-site?
Christian
Hi Christian,
Thanks for the feedback.
Sure, I’ll explain it in another post. Stay tuned.
Cheers,
Reza
Hi Reza,
thanks a lot, that would be great. I also tried to copy the data model Microsoft used in their Blog Post about the World Cup (links see on the bottom), but in the model you won’t see the complete tables. My Problem is that I don’t know how to work with the Goals per Game and so on. Maybe you could say something about that in your next blog post too?
data model: http://blogs.msdn.com/cfs-filesystemfile.ashx/__key/communityserver-blogs-components-weblogfiles/00-00-01-60-20/6443.06.png
blog post Microsoft: http://blogs.msdn.com/b/powerbi/archive/2014/07/29/behind-the-scenes-how-power-bi-handled-the-world-cup.aspx
Best regards
Christian
Sure, Here is the post that I explained how to achieve that data analysis step by step.
Please read through and let me know if you have any questions
http://radacad.com/power-bi-how-to-analyze-fifa-2014-worldcup
Hi Reza,
Thank you for such a great post…
I know this is a very old post but do you have the .PBIX file still available?
Regards,
Lukholo Jeneto
Hi Lukholo,
Unfortunately I can’t find this file anymore.
However, I will be writing another post about Power BI example with Premier League sometime in future. I’ll post PBIX file of that too.
Cheers
Reza