
You can filter all visuals in Power BI except Slicer! In fact slicer itself is a type of filter, however there are some times that number of items in slicer is too many. So this is normal that we want to filter the items in the slicer itself. Unfortunately current version of Power BI Desktop doesn’t support visual level filter on slicer, and I’m sure this feature will come soon. However in the meantime here is a work around for filtering slicers using calculated tables. If you want to learn more about Power BI, read Power BI online book; from Rookie to Rock Star.
Defining the Problem
The idea of this blog post came from a question that one of students in my Power BI course asked to me, and I’ve found this as a high demand in internet as well. So I’ve decided to write about it.
You might have too many items to show in a slicer. a slicer for customer name when you have 10,000 customers isn’t meaningful! You might be only interested in top 20 customers. Or you might want to pick few items to show in the slicer. With all other visual types (Such as Bar chart, Column chart, line chart….) you can simply define a visual level filter on the chart itself. Unfortunately this feature isn’t supported at the time of writing this post for Slicers. However the demand for this feature is already high! you can see the idea published here in Power BI user voice, so feel free to vote for such feature 🙂
The work around in this post might get dated very soon because I expect Power BI team to fix this soon, however in the meantime this workaround will help some people I believe.
There are number of workarounds for this challenge;
- One can be defining the filter in the page level or report level. but then other elements in the report will be filtered based on predefined items. This might not be what you want.
- Using some specific visuals as slicer can be the other option. such as stacked column chart or bar chart. However this won’t be exactly same feature as slicer. because with clicking on another visual the selection on slicer remains but not the selection of an item in another visual.
- Using custom visuals. As always custom visuals can be helpful. However some of you might prefer built-in visuals, because some of custom visuals are not designed for mobile friendly reports.
- Using Calculated tables; Calculated tables can be used to generate filtered views of other tables in the model. Hence this can be used as a workaround. In this blog post I’ll explain to you how to leverage calculated table as a filter for Slicer.
Calculated Tables
I have written a blog post about what Calculated tables are and how to use them for features such as role playing dimensions in Power BI, and fetching filtered views such as top 20 customers. I strongly encourage you to read that post to learn about usages of calculated tables. In summary calculated tables are DAX generated tables, these tables will be part of the model, and can have relationship with other tables in the model.
Calculated Tables to Filter Data
For filtering data in a slicer I thought using calculated tables for such filtering. I know it won’t be that easy filtering. and I would need to write a bit of DAX instead of picking items from a list, but at least I have full DAX features to use and create whatever filter I want. Once we create the filtered view as a calculated table, then we can create relationship between that table and other tables, and use it in the slicer. Let’s go through that with an example.
Prerequisite
For running this example you need to download and install AdventureWorksDW database from here.
Sample Scenario
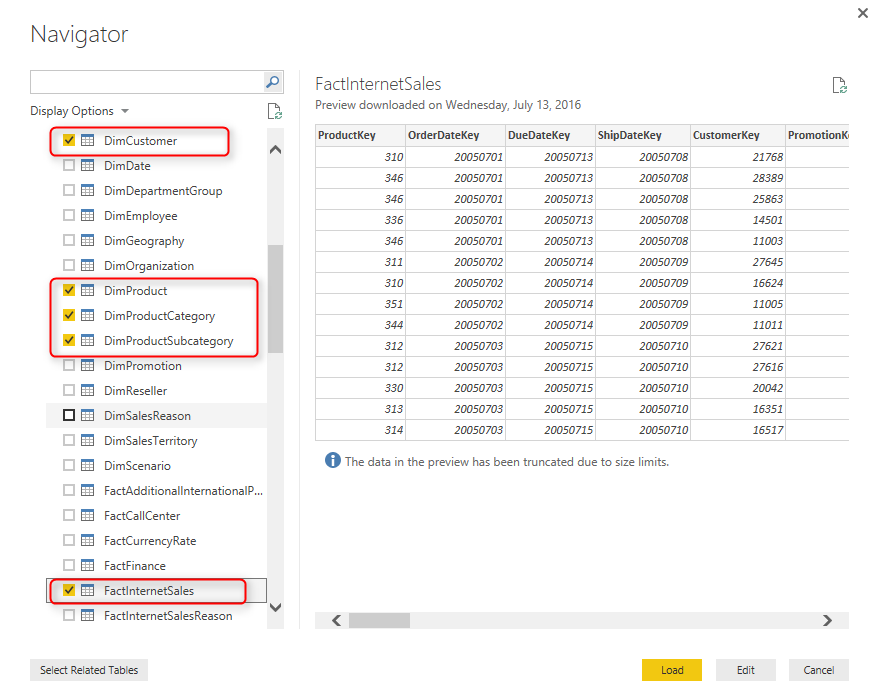
Start with Get Data from AdventureWorksDW database, and choose these tables to import: FactInternetSales, DimProduct, DimProductSubCategory, DimProductCategory, and DimCustomer.
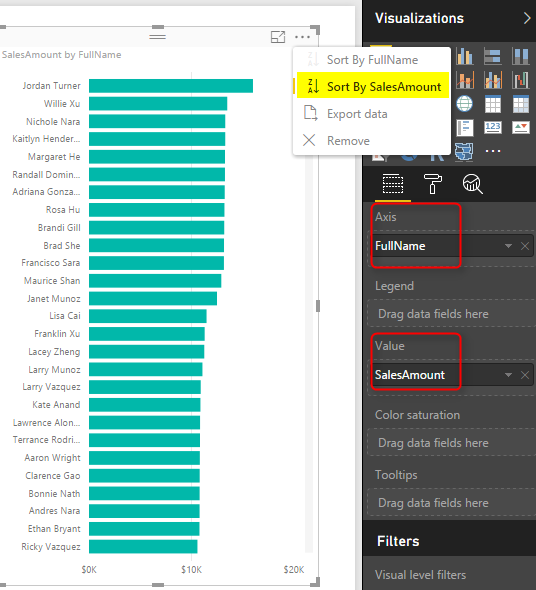
Click on Load, and then build a bar chart with Full Name from DimCustomer as Axis, and SalesAmount from FactInternetSales as Value. Also sort the chart by SalesAmount in descending order.
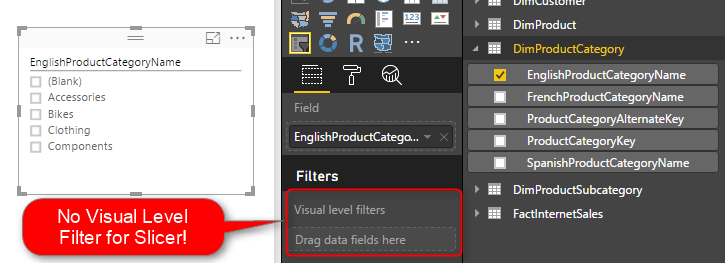
Then Create a Slicer with EnglishProducctCategoryName from DimProductCategory. Note that if you drag and drop something into visual level filter it won’t be placed there! in this version of Power BI Desktop Visual Level Filters are not supported for slicer! But don’t worry we will solve it with calculated tables.
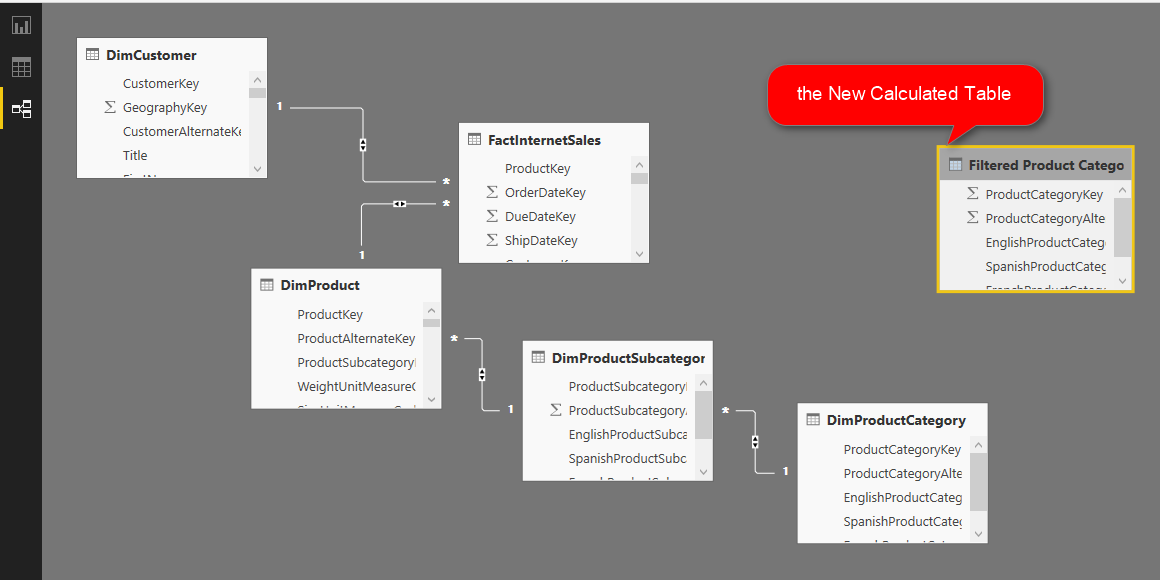
Create Calculated Table for Filtered View
Go to Data Tab, and from Modeling tab, choose Create Calculated Table

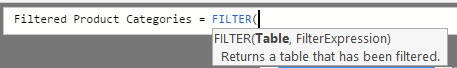
Let’s create a table for filtered list of product categories. As a simple example, let’s show everything except Bikes. I use FILTER function of DAX which gets a table to filter as the first parameter, and the expression as the second parameter.
Now set DimProductCategory as the table, and everything except Bikes as the expression as below;
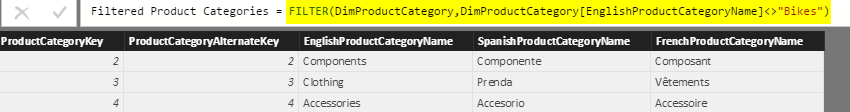
Here is the DAX code;
Filtered Product Categories = FILTER(DimProductCategory,DimProductCategory[EnglishProductCategoryName]<>"Bikes")
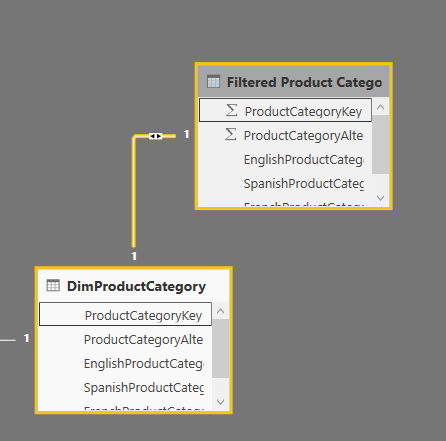
As you can see the filter simply selects everything but Bikes. After creating the table, go to Relationship tab
Create a relationship between DimProductCategory, and Filtered Product Category based on ProductCategoryKey.
Now go back to the Report tab, and in the slicer use EnglishProductCategoryName from Filtered Product Category.
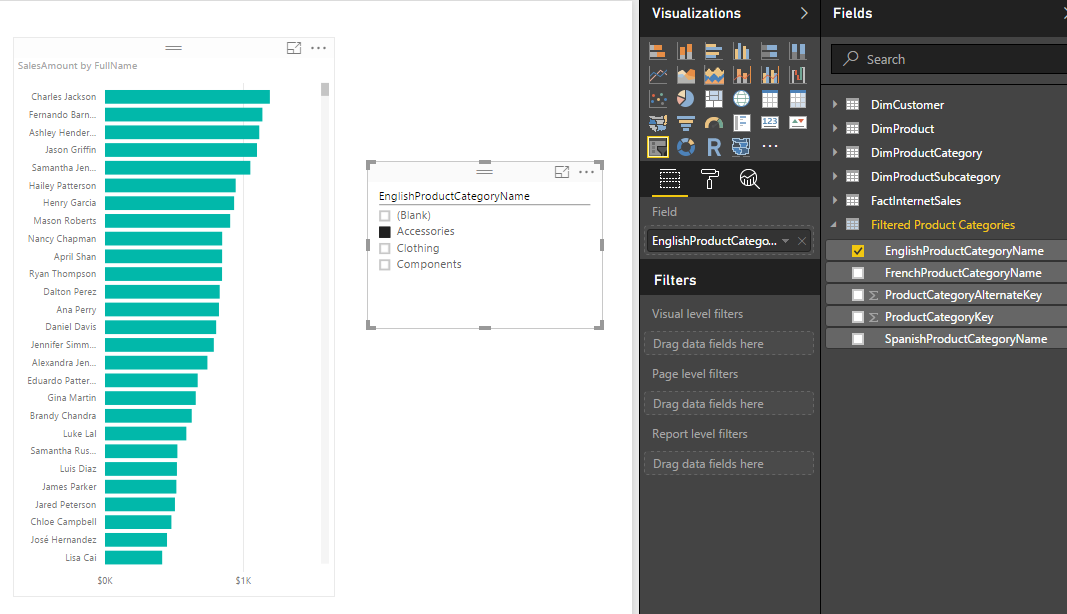
You can see that the slicer is now showing everything but Bikes. Other elements in the report will show everything if slicer hasn’t filtered them yet. If slicer filter their data then they will show only filtered data.
Expand the Possibilities
The example I’ve showed you here was a very basic example of filter. DAX is fully featured language. you can define a very complex filter as well. Think about all possible filters you can create with calculated tables. things like top 10 customers, or any other filters that you cannot simply achieve with visual level filters are possible here.
Limitations
Calculated tables can be created only if you use Import Data into Power BI. these are generated based on DAX functions, and are not available as DirectQuery.
Calculated tables consumes memory, but you can reduce it with selecting minimum number of columns in calculated tables, and some DAX performance tuning considerations.
Summary
In summary I explained to you how to create a visual level filter on a slicer using calculated tables. This method might not be as easy as picking some items from a list in a visual level filter section of the report, but it is very powerful because it uses DAX filtering for generating calculated tables. creating filters such as top 10 customers are possible here with DAX expressions. There are some limitation though, DAX is only supported if you import data into Power BI. the DirectQuery don’t support calculated tables.


Reza is author of more than 14 books on Microsoft Business Intelligence, most of these books are published under Power BI category. Among these are books such as Power BI DAX Simplified, Pro Power BI Architecture, Power BI from Rookie to Rock Star, Power Query books series, Row-Level Security in Power BI and etc.
He is an International Speaker in Microsoft Ignite, Microsoft Business Applications Summit, Data Insight Summit, PASS Summit, SQL Saturday and SQL user groups. And He is a Microsoft Certified Trainer.
Reza’s passion is to help you find the best data solution, he is Data enthusiast.
His articles on different aspects of technologies, especially on MS BI, can be found on his blog: https://radacad.com/blog.
Hi Reza, thanks for your article. Another method I have used is to define the filter from values in the fact table. So if you have a products table and a sales table, and you want your filter to show only products with sales, you can add the field [Product Name] (for example) to the Sales table in addition to the already existing [Product Id], and then use this new field for the filter.
As usual, each case is different but I have solved my needs this way a couple of times.
Hello Reza,
I’m totally new to Power BI. I have few colums in spreadsheet and connect it to power BI as data source. Inside this colums, it has, let’s say Item A, B, and C. The total number of these items will be updated every day. If the original data source updated, power BI would only keep the last data available in the data source. I lost track of previous day data. How i can keep power BI to keep the previous data so that it trends up the plot ?
Hi Tony,
How changes are applied in spreadsheet? are you deleting previous data and put new data in? if correct then Power BI will loose that information.
Best would be keeping all data in the file. or generating copies of excel file for every day in a folder, and then in Power BI loop through the folder and load them all.
Cheers
Reza
Two queries
1) can we show selected values in Hierachy Slicer based on selection in Chiclet Slicer
2) can we dynamically change chart type thru DAX or Power Query based on selection in slicer
Hi Subrato,
You can control the interaction between Chiclet slicer and Hierarchy slicer to do what you want. read this post for more explanation. http://radacad.com/control-the-interaction-in-power-bi-report
dynamically changing chart types is not yet supported in Power BI.
Cheers
Reza
Hi Reza, great article. But can we use a calculated parameter table as a substitute for Report Level Filters in Power BI? I followed your example and created a new parameter table and the relationship to my main table. But after adding a slicer on this new parameter, it only filters visuals on the same page, so it’s not report level.
Hi Ryan,
Not sure if I understand your question correctly. You can use that as a Report level filter and then it will work on your report level.
Cheers
Reza
Good post. However the calculated table is computed during processing. So if I have a situation where I would like to customize a slicer based on the currently logged on user, I would not be able to do so with the calculated table approach. Eventually Power BI would best serve us by somehow allowing a visual level filter based on a value of the measure.
Hi Reza,
I think I may have found the answer in the following thread: http://community.powerbi.com/t5/Desktop/Calculated-Table-filtered-based-on-Slicer-selection/m-p/160250#M69640 as posted by http://community.powerbi.com/t5/user/viewprofilepage/user-id/6970
“The calculated table is preprocessed BEFORE use slicer visual to filter data. So we are not able to use the checked slicer value in the calculated table….”
Regards
Hi James,
This is talking about totally different topic. In this post I did not explained about using calculated tables to work on the filtered data from slicer. I explained a workaround to create a visual level filter on slicer.
Cheers
Reza