
Intro:
In my younger days, I enjoyed playing computer games and in particular, maze-based games. So for the latest addition to my series of DAX based games, I thought I would have a crack at building a game in Power BI that allowed the user to appear to control a character through a maze to find an object. Hopefully, this helps highlight how truly versatile DAX can be.
Before I get into the detail of the blog, here are helpful links to :
View (play) the game in the web service
A key feature of the game is the ability to create and edit maps easily yourself. The data files used to generate maps for the game are stored in the \maps subfolder as CSV files which allows you to customise the game by merely editing the CSV files. More about the editable maps later in the blog.
Thanks:
Once again I’d like to give a big shout out to the team over at PowerBI.Tips for providing the graphics for the backgrounds. I’d especially like to shout out to Margarida Prozil an enormous thanks for building the D-Pad custom control used in the game to control navigation. Margarida is the genius behind the Play Axis custom control and it YYYYYY, and I’m looking forward to seeing the D-Pad custom control turning up in the app store. I’d also like to thank Miguel Escobar for helping to configure the M code that handles importing and transforming CSV files of variable widths.
The Game:
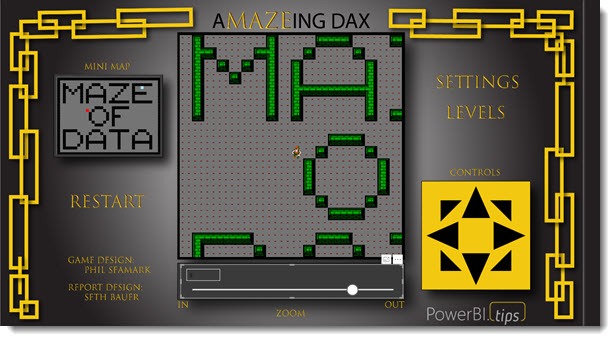
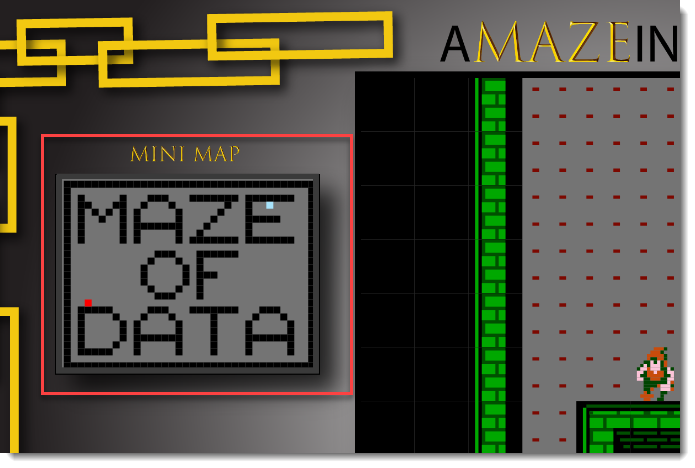
The central element of the game is a map view that displays your character in the centre. Next to the main map is a D-Pad custom control that displays eight arrows. Two for up/down, two for left/right and four for the diagonals. The idea is you use the D-Pad control to move the character in the centre of the map around the maze to see if you can find the Insight square (exit). There are no baddies chasing you, and there is no time limit, score or any concept of health. There isn’t actually anything stopping you walking through walls either, aside from a message that appears in place of the main map if you happen to move into a wall square.
The D-Pad is a custom control that sits over two columns that contain a sequence of numbers. If the map happens to be 40 cells wide and 30 cells high, then a column with numbers 1 through 40 are automatically generated and used to control the X-Axis. The second column with numbers 1 through 30 is used to control the Y-Axis. The D-Pad could be replaced by two slicers, but the gameplay wouldn’t be anywhere near as good.
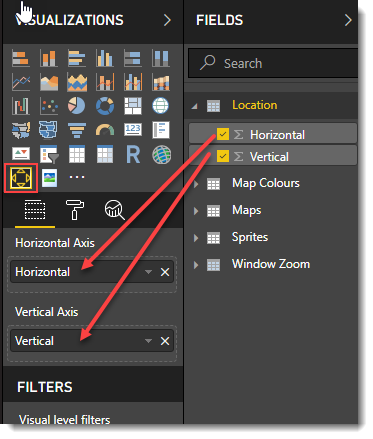
The two columns get assigned to the appropriate field (horizontal axis/vertical axis) on the D-Pad control which behaves like a slicer allowing you to make a single selection on either column at any point in time. Clicking any of the arrows adjusts your current choice to the adjacent item in the slicer. Clicking on one of the diagonal arrows makes the appropriate adjustment to both the X and Y axis selections.
An excellent feature of the D-Pad is you can enable/disable the arrows in the format properties. I will use the D-Pad control in non-game scenarios like having only the left/right arrows, or up/down arrows showing over a column that represents a time entity such as year or month. An end user can then click the arrows to view the next/previous period as a nice alternative to the traditional slicer views.
If the user happens to be at coordinates X=15, Y=15 and clicks the right arrow, the new coordinates are X=16, Y=15. If the user then clicks the up arrow, the coordinates are now X=16, Y=14 (in this game the Y-axis starts at the top and increases in value as you go down).
Once we know the position of the character, we can draw the map. The main map is a sliding window representation of the full map. To keep things easy, the character you control is always in the centre of the d map. A better version would allow the character to move around within the sliding window and only move the window as it moved closer to an edge.
The default view of the main map always to display five points above, below and to either side of the characters current position. A slider underneath the main map controls a “What-if” parameter to adjust this from between five and ten to create a zoom in/out effect. The more you zoom out, the more impact on redraw performance.
The map files:
I was keen to have the first game map spell the words “Maze of Data”, and initially I thought I would construct this by hard-coding in DAX which sprite piece should appear in any given coordinate. I was not looking forward to this aspect of building the game, as it seemed like it was going to be quite a fiddly exercise.
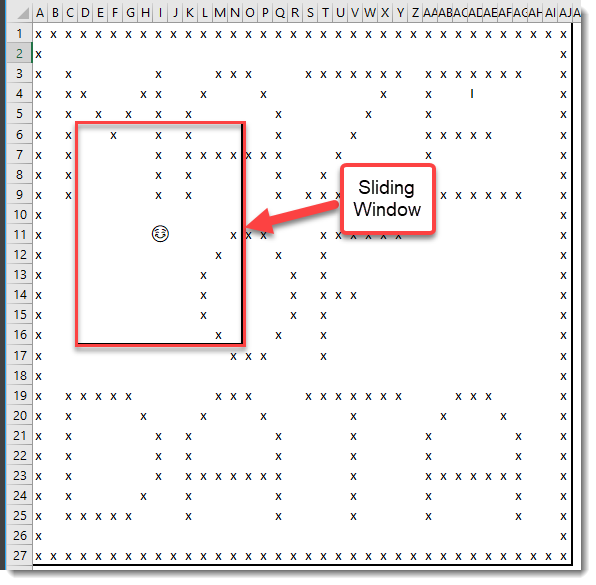
To solve this, I decided to “cheat” and use CSV files to store the data needed to draw the maps. I used Excel to create the map files, but I could have used any text editor. An advantage of Excel is setting the width of every column in the worksheet to 15 pixels to match the height of every row to provide a view that is nicely in proportion. Any cell that contains an ‘X’ character will represent where a wall should be. An ‘I’ character represents an “Insight”.
For my maps, I created an outer boundary wall of ‘X’s and then drew the rest of the map by placing an X in the appropriate cell. The DAX logic inside Power BI works out which sprite should be used based on the ‘X’s so there is no requirement to decide whether a cell should be a corner, line or junction when creating or editing maps.
Once the maps have been saved (as CSV and not XLSX format), Power Query imports the CSV files in the \maps subfolder and transposes the layout to a tall version of the table that includes the following columns, Name, Row, Column and Value. The Row and Column columns represent the X/Y coordinates in any given map, while the Value column carries an X for a wall, I for an Insight and a blank value is where the floor should be.
There is no fixed requirement that the map files must match a specific dimension. If one file has a CSV file with 17 rows and 22 columns, nothing is stopping another CSV file having 55 rows and n10 columns. Both CSV files get transposed to the same table format by Power Query, only might end up having more rows than the other.
I was lucky enough to catch M-Maestro Miguel Escobar online, and he was able to help ensure the M code does the import, transpose and apply the required transformations, in the correct order.
I like this feature because it allows you to create as many custom maps as you want, and it’s as easy as adding or removing ‘X’s to cells.
The map graphics:
To draw the main map, I sew together a series of 16 x 16 SVG files. There are 22 of these in total and found in the \sprites subfolder and cover the various elements to build the walls and floor. There is a sprite file for each type of wall connection including the multiple corners, T and cross junctions. Each sprite file is a text-based SVG file that describes where to draw rectangles or lines. Each rectangle or line element is associated with a class which makes it easier to update the theme colour for the map.
I initially used the standard Matrix visual, to help lay out the map. The process for this is as follows:
1) Determine the current coordinates for the character. e.g. X=15, y=20
2) Determine the zoom factor (a number between 5 and 10), e.g. Zoom = 5
3) Retrieve from the Map table, all rows where X is between 10 and 20, and where Y is between 15 and 25.
4) Because the Map is a sliding window over the overall map, treat the sliding window as a mini matrix with 11 rows and 11 columns.
5) For any given cell in the sliding window, retrieve five values from the map data.
5.1) retrieve from the map file if there is an X in the row for the specific cell (when mapped from the sliding window coordinates to the map file)
5.2) retrieve the value for the cell above, below, the left and to the right.
5.3) Use a 17 option SWITCH statement to decide which sprite to display based on the condition of the five values (current, above, below, left, right).
In the case where there is an X in the current, above and right cells, but the left and below are blank, then the L shaped wall sprite should be used.
If there is no X in the current cell, the floor sprite should be displayed.
The main map only displays a portion of the overall map at any one time and is based on the coordinates of your character. If you click the right arrow, the sliding window moves to the right and retrieves a new set of [Values] from the map table to recreate a new SVG file.
The matrix visual provides a nice easy way to sew together rows and columns of 16 x 16-pixel sprite files. I was able to get the logic working quite quickly with the Matrix visual, however, found it would flicker when moving around. Enough for it to be annoying to check in with Will Thompson in the Power BI team to ask if there was something he could suggest that might reduce or eliminate the flicker. There is also a visible line that separates the rows and columns that can’t be removed by the formatting properties.
Will confirmed a design decision made when building the Matrix visual, to improve scrolling performance was behind the flicker, and there would be no way to reduce this quickly. I could sympathise with this and believe the Power BI should be optimised for genuine business use and not for crazy people like me for strange things like this.
Given the sprite, files are already in an SVG I decided to ditch the Matrix and replace with a single Image View control by CloudScape. A recent blog by David Eldersveld inspired me to create a single SVG element using the various components. The Image control seemed to handle the redraw pretty smoothly compared with the Matrix visual.
The logic for creating the single SVG file s driven by nested CONCATENATEX functions. One CONCATENATEX function loops the number of times needed for rows, while the other loops the number of times necessary for columns. The expression inside both loops can detect which row and column are current and retrieve the appropriate SVG code for that cell and append it to the main SVG file.
So game logic for drawing the main map sits inside a single calculated measure imaginatively called [Main map]. This produces a very long string of text and the measure is classified as an Image URL.
The ContentSVG variable is where the nested loops run to build the final SVG file for the image viewer.
Main Map =
VAR MapWidth = MAX('Maps'[Column])
VAR MapHeight = MAX('Maps'[Row])

//VAR ZoomFactor = 2
// How many squares can be seen above/below/left/right of character
VAR WindowZoom = [Window Zoom Value]
VAR windowZoomFull = (WindowZoom * 2) + 1


VAR myX =
        IF(
            ISFILTERED('Location'[Horizontal]),
            SELECTEDVALUE('Location'[Horizontal])
            ,1
            )
VAR myY1 = MapHeight -SELECTEDVALUE('Location'[Vertical])
VAR myY = IF(ISFILTERED('Location'[Vertical]),myY1,MapHeight-2)


VAR myRows = SELECTCOLUMNS(GENERATESERIES(0,windowZoomFull-1),"r",[Value])
VAR myCols = SELECTCOLUMNS(GENERATESERIES(0,windowZoomFull-1),"c",[Value])
VAR ContentSVG =
    CONCATENATEX(
        myRows,
        CONCATENATEX(
            myCols,
            VAR cellX = myX + [c] - (WindowZoom + 1)
            VAR cellY = myY + [r] - (WindowZoom + 1)

            VAR Sprite =
                MAXX(
                    FILTER(
                        'Maps',
                        Maps[Row] = myY - WindowZoom + [r] &&
                        Maps[Column] = myX - WindowZoom + [c]
                        ),
                        Maps[Value]
                        )


            VAR SpriteAbove =
                MAXX(
                    FILTER(
                        'Maps',
                        Maps[Row] = myY - WindowZoom + [r] - 1 &&
                        Maps[Column] = myX - WindowZoom + [c] &&
                        Maps[Value] <> "I"
                        ),
                        Maps[Value]
                        )

            VAR SpriteBelow =
                MAXX(
                    FILTER(
                        'Maps',
                        Maps[Row] = myY - WindowZoom + [r] + 1 &&
                        Maps[Column] = myX - WindowZoom + [c] &&
                        Maps[Value] <> "I"
                        ),
                        Maps[Value]
                        )

            VAR SpriteLeft =
                MAXX(
                    FILTER(
                        'Maps',
                        Maps[Row] = myY - WindowZoom + [r] &&
                        Maps[Column] = myX - WindowZoom + [c] - 1 &&
                        Maps[Value] <> "I"
                        ),
                        Maps[Value]
                        )

            VAR SpriteRight =
                MAXX(
                    FILTER(
                        'Maps',
                        Maps[Row] = myY - WindowZoom + [r] &&
                        Maps[Column] = myX - WindowZoom + [c] + 1 &&
                        Maps[Value] <> "I"
                        ),
                        Maps[Value]
                        )

            VAR P = SWITCH(
                TRUE() ,
                // Plot me in the center of the rolling window.
                [r] = (WindowZoom + 1) && [c] = (WindowZoom + 1) , [Sprite Man] ,
                // Paint outside of maze black
                [c] + myX -(WindowZoom+2)  > MapWidth - 2 , [Outer] ,
                [r] + myY -(WindowZoom+2)  > MapHeight-2 , [Outer] ,
                [c] + myX -(WindowZoom+1) < 0 , [Outer] ,
                [r] + myY -(WindowZoom+1) < 0 , [Outer] ,
                // Plot Floor
                 Sprite = "" , [Sprite Floor],
                // Plot appropriate walls
                Sprite = "I"  , [Insight] ,
                Sprite = "x" && SpriteAbove = "x" && SpriteBelow = "x" && SpriteLeft = "" && SpriteRight ="" , [Sprite Vertical1] ,
                Sprite = "x" && SpriteAbove = "" && SpriteBelow = "x" && SpriteLeft = "" && SpriteRight ="" , [Sprite Vertical3] ,
                Sprite = "x" && SpriteAbove = "x" && SpriteBelow = "" && SpriteLeft = "" && SpriteRight ="" , [Sprite Vertical2] ,
                Sprite = "x" && SpriteAbove = "" && SpriteBelow = "" && SpriteLeft = "x" && SpriteRight ="x" , [Sprite Horizontal4] ,
                Sprite = "x" && SpriteAbove = "" && SpriteBelow = "" && SpriteLeft = "x" && SpriteRight ="" , [Sprite Horizontal2] ,
                Sprite = "x" && SpriteAbove = "" && SpriteBelow = "" && SpriteLeft = "" && SpriteRight ="x" , [Sprite Horizontal3] ,
                Sprite = "x" && SpriteAbove = "x" && SpriteBelow = "x" && SpriteLeft = "x" && SpriteRight ="x" , [Sprite Cross] ,
                Sprite = "x" && SpriteAbove = "" && SpriteBelow = "x" && SpriteLeft = "" && SpriteRight ="x" , [Sprite Corner1] ,
                Sprite = "x" && SpriteAbove = "x" && SpriteBelow = "" && SpriteLeft = "" && SpriteRight ="x" , [Sprite Corner2] ,
                Sprite = "x" && SpriteAbove = "" && SpriteBelow = "x" && SpriteLeft = "x" && SpriteRight ="" , [Sprite Corner3] ,
                Sprite = "x" && SpriteAbove = "x" && SpriteBelow = "" && SpriteLeft = "x" && SpriteRight ="" , [Sprite Corner4] ,
                Sprite = "x" && SpriteAbove = "x" && SpriteBelow = "" && SpriteLeft = "x" && SpriteRight ="x" , [Sprite T2] ,
                Sprite = "x" && SpriteAbove = "x" && SpriteBelow = "x" && SpriteLeft = "" && SpriteRight ="x" , [Sprite T3] ,
                Sprite = "x" && SpriteAbove = "x" && SpriteBelow = "x" && SpriteLeft = "x" && SpriteRight ="" , [Sprite T4] ,
                Sprite = "x" && SpriteAbove = "" && SpriteBelow = "x" && SpriteLeft = "x" && SpriteRight ="x" , [Sprite T5] ,
                1=1, IF(Sprite="X", [Sprite Stub]) ,

                [Sprite Floor]
            )
            RETURN

            "<svg x=""" & ([c] * 16) - 16 & """ y=""" & ([r] * 16) - 16 & """>" & p & "</svg>"
            )
        )

VAR HeaderSVG =
"data:image/svg+xml;utf8," &
            "<svg width=""" & (16 * windowZoomFull) - 16
            & """ height=""" & (16 * windowZoomFull) - 16
            & """ xmlns=""http://www.w3.org/2000/svg"" xmlns:svg=""http://www.w3.org/2000/svg"" xmlns:xlink=""http://www.w3.org/1999/xlink"" style=""background:#747474"">"

VAR C1 = MINX('Map Colours',[C1])
VAR C2 = MINX('Map Colours',[C2])
VAR C3 = MINX('Map Colours',[C3])

VAR defs = "<defs>
  <style>
    .cls-2{stroke:#" & C1 & ";stroke-width:1px;fill:#" & C1 & "}
    .cls-1{stroke:#" & C2 & ";stroke-width:1px;fill:#" & C2 & "}
    .cls-3{stroke:#" & C3 & ";stroke-width:1px;fill:#" & C3 & "}
	.cls-4{stroke:red;stroke-width}
    .cls-5{stroke:#C84C0C;stroke-width:1px;fill:#C84C0C}
    .cls-6{stroke:#004400;stroke-width:1px;fill:#004400}
    .cls-7{stroke:#FCC4D8;stroke-width:1px;fill:#FCC4D8}
    .cls-9{stroke:#7C0800;stroke-width:1px;}
    .cls-10{fill:#000000}
    .cls-11{stroke:#A8E4FC;stroke-width:1px;fill:#A8E4FC}
    .cls-12{ font: bold 30px sans-serif;}
  </style>
</defs>"

VAR Sprite =
    MAXX(
        FILTER(
            'Maps',
            Maps[Row] = myY +1 &&
            Maps[Column] = myX +1
            ),
            Maps[Value]
            )


VAR PauseMessage =
"data:image/svg+xml;utf8," &
            "<svg width=""200"" height=""200"" xmlns=""http://www.w3.org/2000/svg"" xmlns:svg=""http://www.w3.org/2000/svg"" xmlns:xlink=""http://www.w3.org/1999/xlink"" style=""background:#747474"">
            <text x=""100"" y=""80"" fill=""#F2C811"" style=""font-family:Goudy Old Style;text-anchor: middle"">GAME PAUSED</text>
            <text x=""100"" y=""100"" fill=""#F2C811"" style=""font-family:Goudy Old Style;text-anchor: middle"">CLICK ARROW</text>
            <text x=""100"" y=""120"" fill=""#F2C811"" style=""font-family:Goudy Old Style;text-anchor: middle"">TO RESUME</text>
            </svg>"

VAR WallMessage =
"data:image/svg+xml;utf8," &
            "<svg width=""200"" height=""200"" xmlns=""http://www.w3.org/2000/svg"" xmlns:svg=""http://www.w3.org/2000/svg"" xmlns:xlink=""http://www.w3.org/1999/xlink"" style=""background:#747474"">
            <text x=""100"" y=""105"" fill=""#F2C811"" style=""font-family:Goudy Old Style;text-anchor: middle"">YOU HIT A WALL!</text>
            </svg>"

VAR InsightMessage =
"data:image/svg+xml;utf8," &
            "<svg width=""200"" height=""200"" xmlns=""http://www.w3.org/2000/svg"" xmlns:svg=""http://www.w3.org/2000/svg"" xmlns:xlink=""http://www.w3.org/1999/xlink"" style=""background:#747474"">
            <text x=""100"" y=""95"" fill=""#F2C811"" style=""font-family:Goudy Old Style;text-anchor: middle"">YOU FOUND</text>
            <text x=""100"" y=""125"" fill=""#F2C811"" style=""font-family:Goudy Old Style;text-anchor: middle"">THE INSIGHT!</text>
            </svg>"

RETURN
    SWITCH(
        TRUE() ,
        NOT  ISFILTERED('Location'[Horizontal]),PauseMessage,
        Sprite="X",WallMessage,
        Sprite="I",InsightMessage,
        HeaderSVG & defs & ContentSVG & "</svg>"
        )
A concern I had was I may end up hitting a boundary of how much text you can store in a single measure, but fortunately, this didn’t end up being an issue even when the map is zoomed out.
If you play the game, you may notice there is nothing to stop you walking through walls. The reason for this is there is no current way to easily store the previous selection of a slicer, nor is there a way to set a value of a slicer from inside a calculation. If there were, then some code could be added to the calculated measure to test if you have walked into a wall and if so, return you to your previous square. Another use of a “previous value” could be to draw one of 8 different sprites for your character depending on the direction you came from. It would also be nice to have a central variable scope to store information about the sliding window coordinates to allow the character to move around within the window and only moving the window when the character moves closer. A central layer of variable scope could also open up features such as other characters trying to chase you, weapons firing, doors in different states.
Mini Map
In the top left-hand corner is a smaller map that shows the entire map. There is a red dot to represent your current position, and the Insight will be a small silver dot. This also uses the Image control by cloudscape and a single calculated measure called [Zoom Map] constructs an SVG string that is used to draw the image.
The DAX here is much shorter than for the [Main Map], but it still uses the two nested CONCATENATEX functions to create an outer loop for rows, and an inner loop for columns.
The PlotWalls variable builds up a string of nested SVG elements that are dynamically positioned by the inner/outer loop.
Zoom Map =
VAR MapWidth = MAX('Maps'[Column])
VAR MapHeight = MAX('Maps'[Row])

VAR myX = SELECTEDVALUE('Location'[Horizontal])
VAR myY =MapHeight -SELECTEDVALUE('Location'[Vertical])

VAR ZoomFactor = 2

VAR myRows = SELECTCOLUMNS(GENERATESERIES(1,MapHeight),"r",[Value])
VAR myCols = SELECTCOLUMNS(GENERATESERIES(1,MapWidth),"c",[Value])

VAR PlotMe = "<svg x=""" & (myX * ZoomFactor)  & """ y=""" & (myY * ZoomFactor) & """><rect class=""cls-2"" x="".5"" y="".5"" width=""2"" height=""2""  style=""fill:red""/></svg>"

VAR PlotWalls =
    CONCATENATEX(
        myRows,
        CONCATENATEX(
            myCols,
            VAR cellX = ([C] * ZoomFactor) - ZoomFactor
            VAR cellY = ([r] * ZoomFactor) - ZoomFactor

            VAR p = MAXX(FILTER('Maps',Maps[Row] = [r] && Maps[Column] = [c] ),Maps[Value])
            RETURN
                SWITCH(
                    TRUE() ,
                    p="x","<svg x=""" & cellX & """ y=""" & celly & """><rect class=""cls-1"" x="".5"" y="".5"" width=""2"" height=""2""/></svg>",
                    p="i","<svg x=""" & cellX & """ y=""" & celly & """><rect  x="".5"" y="".5"" width=""2"" height=""2"" fill=""#A8E4FC""/></svg>",
                    "")

        )
    )

VAR defs = "<defs>
  <style>
    .cls-1{stroke:#005000;stroke-width:1px;fill:#005000}
    .cls-2{stroke:#FF0000;stroke-width:1px;fill:#FF0000}
    .cls-3{stroke:#00A800;stroke-width:1px;fill:#00A800}
    .cls-12{stroke:#A834FC;stroke-width:1px;fill:#A834FC}
  </style>
</defs>"

VAR Header = "data:image/svg+xml;utf8," &
            "<svg width=""" & (MapWidth * ZoomFactor)
            & """ height=""" & (MapHeight * ZoomFactor)
            & """ xmlns=""http://www.w3.org/2000/svg"" xmlns:svg=""http://www.w3.org/2000/svg"" xmlns:xlink=""http://www.w3.org/1999/xlink"" style=""background:#747474"">"
            & PlotWalls
            & PlotMe
            & "</svg>"

RETURN Header
Other features:
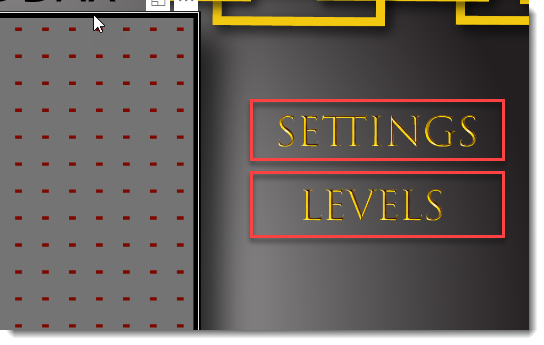
Clicking the Settings text displays a flyout panel that contains a slicer to control which map you would like to navigate while clicking Levels shows a flyout panel where you can change the theme colour for the walls. Seth Bauer added these elements to the report using bookmarks and shapes. This is a highly customisable way to present filter options to the end user without taking up permanent screen real estate.
Summary:
This was a lot of fun to build and I was quite surprised by how little DAX was required to get it up and running. It would be nice to have it working so you were blocked from going through walls, and for bookmarks to be triggered by an in-calculation event. These are not high priority items for typical business reports so I’m not going to hold my breath. It does show how versitile DAX can be when it comes to presenting data, so hopefully it has at least reset what you thought might be the boundaries of DAX.


Amazing ideas and Power BI skills!
There seems to be some problems with the download links. Could you please fix it or send the PBIX file to my email?
Greetings from Germany
Have fixed the link download link. Please give it another try.
Dear Philip
I really like your maze idea! I also think that the D-pad has definite possibilities for use in actual reports. Did you design it yourself? If so, great job! Also where would I be able to access the custom D-pad visual? Thanks for your clear explanations of how you created the mazes, and why you did it the way you did! Super easy to follow.
–Christopher Hastings