
Carrying on from my recent article on how to build a game of Blackjack using Power BI and DAX, this time I thought I would see if I could build a fully playable game of Sudoku. A big thanks to my good friend Tom Martins over at minceddata for giving me the idea.
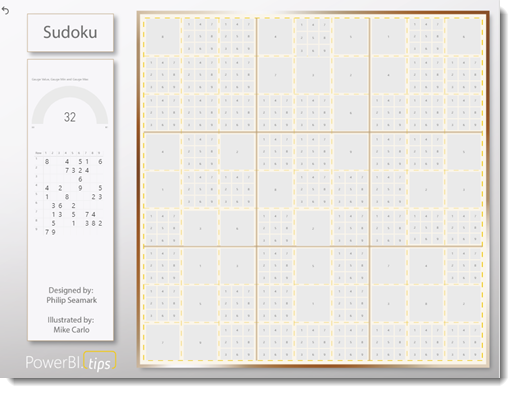
The end result looks as follows and the PBIX file can be downloaded here which includes a zip file with the source data.
To begin with, I needed some data to use as the basis for the game. I had a look around to see if there were any existing data-sets around and found a file over at Kaggle with data for 1 million Sudoku games. The file is a CSV that includes two values for each game. First, a set of 81 digits to represent the initial setup of clues and an additional 81 digits for the end result.
A typical line in the data-set looks like :
800405106000732400000006000402009005100800023036020000013050740050010382790000000

827495136561732498349186257482379615175864923936521874213658749654917382798243561
The top row provides data used to initialize the board. Zeros are placeholders for guesses, while the non-zeroes carry values to be used as the clues.
If I add line-breaks and vertical gaps, you can see how I map the numbers to cells on the Sudoku board.
--Initial Setup--
800 405 106
000 732 400
000 006 000

402 009 005
100 800 023
036 020 000

013 050 740
050 010 382
790 000 000


--Solution--
827 495 136
561 732 498
349 186 257

482 379 615
175 864 923
936 521 874

213 658 749
654 917 382
798 243 561
Interestingly, it doesn’t matter if you orient the data so the first 9 digits are the first row or the first column – it will still create a playable board so long as you carry on the same pattern. It means you can flip around existing games vertically, or horizontally (or both) to create an even larger set of games, although a million is probably quite enough.
I decided to make the first 9 digits the top row, then digits 10 through 18 as the second row etc.
I use Power Query to generate a random number to filter the raw data-set down to a single row for the Power BI data model. The random number is used to filter an index row which is added to the CSV file. This means every time the data-set is refreshed, a new game will be loaded. This particular data-set doesn’t come with any form of difficulty rating on the games, so there is no ability to set if the game should be easy, medium or hard.
To build the board, I contacted the very good people over at PowerBI.Tips to see if they would be able to spin up a suitable background image to use for the game. They have all sorts of wonderful templates that you can use for reports and dashboards, which are well worth a look (free too!). The wonderful, Mike Carlo sent me through a pretty snazzy graphic that provided some structure to place the visuals to construct the game.
Once I had the graphic I could start adding slicers to sit in each cell of the board. Each slicer sits on its own data-table that is a single column, 9-row table containing numbers between 1 and 9. The DAX to generate each table is as follows:
R1C1 =
VAR Position = 1
VAR Quiz = MIN('Quizzes'[quizzes])
VAR Clue = INT(MID(Quiz,Position,1))
VAR Series = FILTER('Slicer Primer',[N] = IF(Clue=0,[N],FORMAT(Clue,"")))
RETURN ROW("N",Clue)
I create 81 of these tiny tables in the data model and there are no relationships between any.
The name of the data-table helps me keep track of which slicer it supports. In this case, R1C1 means it will be the table I use for the slicer in Row 1, Column 1 (so the top left-hand corner).
The VAR Position = 1, determines which position in the 81 digit clue/solution pattern the slicer represents.
The Quiz variable stores the 81 digits that contain the zeros from the source data.
The Clue variable stores the individual digit that represents the position this table will manage. In this case, it will be the first digit in the series.
Finally, the Series table expression takes an already built set of 9 digits (stored in the ‘Slicer Primer’ table) and then decides if it needs to return all 9 rows or just 1 row. If the value stored in Clue is a zero, it means the player will need to guess for this cell, so all 9 values are returned. If the value in the Clue is a non-zero value, then only that value will be returned so the slicer will just have one value.
I initially thought I would configure my slicer visuals as drop-downs, but remembered there is a pretty nice setting on the default visual that allows you to offer the options as buttons.
The format properties for all the slicers on the game board were set as follows:

The Orientation is changed from “vertical” to “horizontal” and I turned on the “Responsive” setting. Now when I add a slicer to the game board and set the height to 150, and width to 180, it looks like either of the following :
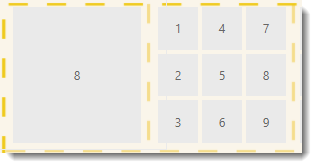
There are two slicers in the above picture. The one on the left taking up the whole cell is where the game provides a clue, where the cell on the right showing all 9 numbers provides the end user the ability to make a selection as their guess.
It’s interesting to see how Power BI performs with so many visuals on the canvas. It’s certainly not super snappy, which I think is more to do with all the client-side JavaScript that needs to fire and talk among the visuals to synchronize the selections. I doubt the underlying SSAS engine raises much of a sweat with all the tiny tables.
The final part of the game was to provide an ability to track progress and announce if the game is complete.
I managed this by creating a calculated measure that tests the selection of any visual, with its corresponding value in the solution. I created a calculated measure for each cell position using the same pattern:
M R1C1 =
VAR x = SELECTEDVALUE('R1C1'[N])
RETURN IF(ISBLANK(x),"",x)
The measure simply determines if a single value has been selected for the position. This represents the end-users guess for the cell.
The resulting measure performs the comparison using a very basic string concatenation to construct a value to test against the actual solution as follows
Result =
Var Player = [M R1C1] & [M R1C2] & [M R1C3] & [M R1C4] & [M R1C5] & [M R1C6] & [M R1C7] & [M R1C8] & [M R1C9] &
             [M R2C1] & [M R2C2] & [M R2C3] & [M R2C4] & [M R2C5] & [M R2C6] & [M R2C7] & [M R2C8] & [M R2C9] &
             [M R3C1] & [M R3C2] & [M R3C3] & [M R3C4] & [M R3C5] & [M R3C6] & [M R3C7] & [M R3C8] & [M R3C9] &
             [M R4C1] & [M R4C2] & [M R4C3] & [M R4C4] & [M R4C5] & [M R4C6] & [M R4C7] & [M R4C8] & [M R4C9] &
             [M R5C1] & [M R5C2] & [M R5C3] & [M R5C4] & [M R5C5] & [M R5C6] & [M R5C7] & [M R5C8] & [M R5C9] &
             [M R6C1] & [M R6C2] & [M R6C3] & [M R6C4] & [M R6C5] & [M R6C6] & [M R6C7] & [M R6C8] & [M R6C9] &
             [M R7C1] & [M R7C2] & [M R7C3] & [M R7C4] & [M R7C5] & [M R7C6] & [M R7C7] & [M R7C8] & [M R7C9] &
             [M R8C1] & [M R8C2] & [M R8C3] & [M R8C4] & [M R8C5] & [M R8C6] & [M R8C7] & [M R8C8] & [M R8C9] &
             [M R9C1] & [M R9C2] & [M R2C3] & [M R9C4] & [M R9C5] & [M R9C6] & [M R9C7] & [M R9C8] & [M R9C1]
VAR Solution = MIN('Quizzes'[solutions])
RETURN IF(Player = Solution,"YOU HAVE SOLVED THE PUZZLE","")
Only when there is an exact match between all the cells and the solution is the text “YOU HAVE SOLVED THE PUZZLE” returned to a card visual.
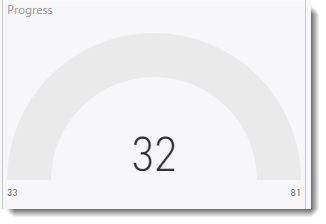
A progress calculated measure is generated along the same lines that perform 81 individual tests to see if a cell selection (guess) matches the corresponding position in the solution. This is used in a Gauge visual to help track progress. This gauge will slowly fill as correct answers are provided until the user gets 81 from 81 cells correct.
Gauge Value =
     IF([M R1C1]= MID(MIN('Quizzes'[solutions]),1,1),1,0) +
     IF([M R1C2]= MID(MIN('Quizzes'[solutions]),2,1),1,0) +
     IF([M R1C3]= MID(MIN('Quizzes'[solutions]),3,1),1,0) +
     IF([M R1C4]= MID(MIN('Quizzes'[solutions]),4,1),1,0) +
     IF([M R1C5]= MID(MIN('Quizzes'[solutions]),5,1),1,0) +
...
...
...
Finally, I add a matrix visual to the left-hand menu strip that populates itself based on the user progress. This is to provide a compact view of the board and selections to try and make it easier to track progress. I could probably use conditional formatting here to help show when blocks of guesses are correct and might get around to that next time I have an opportunity.
Another enhancement was to add a reset button to the top left corner which resets the board using a bookmark.
Anyway, I hope you enjoy the game AND maybe pick up an idea or two from the exercise.
A publish to web version can be found here.
As usual, I enjoy reading your comments so please feel free to comment.


Wonderful to nice article, I would like you to continue to develop Machine Learning model in this same path.