
To follow in the spirit of some of my recent blogs, I thought I would have a look to see how feasible it might be to build a Tic Tac Toe game using just DAX and Power BI. I get pretty close and will detail my approach here in this article. For starters, here is a link to a playable “Publish to Web” version so you can try it out for yourself.
The underlying PBIX File can be downloaded here:
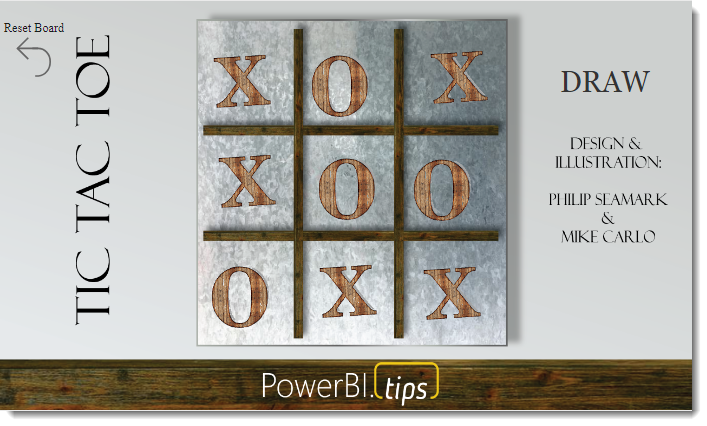
A caveat I would like to make early in the article is the game gets confused about 5% of the time, so you may notice the computer pieces jump to a completely different layout if you play it often enough. If this happens, click the reset button in the top left corner and have another go. The reason for this will become clear later in the article.
Once again, I’d like to give a big thanks to Mike Carlo and the team over at PowerBI.Tips for coming up with some fantastic images for the game. If you see the layout of the game without images, you’ll agree the graphics improve the look and feel out of this world.
The Game Engine
The main challenge with this and any game using DAX in Power BI is how to keep of each player’s moves. In this game, there are two players, you the user against the DAX engine. The moves made by the end user are easy enough to track by combining slicers and bookmarks. Keeping track of the moves by DAX is harder as there is no current way in DAX to store state, or to make a selection on an object as the output of a calculation. Let’s first look at how I keep track of the moves made by the person playing the game.
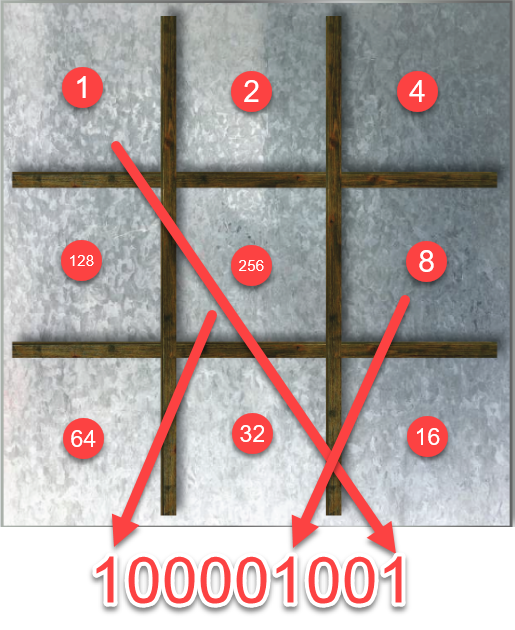
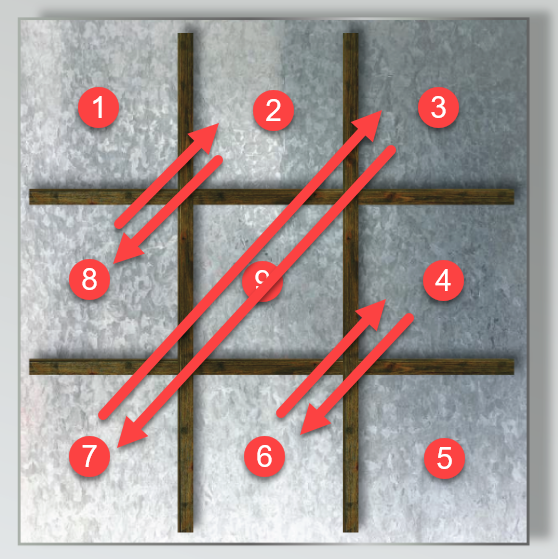
The first thing I do is assign a numeric value to each square on the board as follows. This is deliberately set in this curl pattern to make some adjustments later on much easier to make.

Each square is assigned a physical table with a single column and only a couple of rows. There are 9 of these tables that are used to keep track of the moves made human player of the game. The physical table looks like this and is not related to any another table in the data model:

Nine slicers are added to the game board with each slicer using one of the nine physical tables. Nine bookmarks are then added to the PBIX File as follows. The bookmark for Cell 1 is used to see the slicer for cell 1 to the number 1.
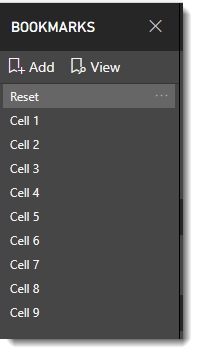
A handy feature of bookmarks which I take full advantage of, is you can set individual bookmarks to only snapshot the “selected objects”. So, for each of the nine bookmarks, a single slicer is set with a selection of 1 before the bookmark is Updated. I use this to make sure the bookmark associated with each square on the playing board affects just the slicer tied to the same square.

The “Reset” bookmark is set to snapshot “All visuals” with care being taken to make sure all the slicers on the canvas have no selection. This provides a mechanism to reset the board to start again.
With the bookmarks being configured using “Selected visuals” instead of “All Visuals”, this allows bookmarks to be actioned in a way that accumulates moves for the human player. This means if the bookmark that controls the top-left square is actioned, only that slicer is set to one. Then if another bookmark on the board is actioned, say the centre square, then the slicer that belongs to the centre square is set to 1, while the slicer set earlier retains its state.
Finally, nine buttons are added to the game board. The format properties for each button are set so it appears invisible and then positioned over each square with the action set to the relevant bookmark, provides a way to capture the moves made in the correct order for the human player.
Binary Storage
The next thing to do is to compress all moves made by the human number down to a single value that represents each square played. If the square has had a piece played by the human player, its slicer is set to 1, otherwise, it will be 0. So in the example below, the human has made two moves. The top left cell (1) along with the right cell of the middle row (8). When these two values are added together I can represent this using the decimal value of 9 or a binary value of 000001001.

Using this method, if the human player decides to place a piece in the center of the board (256), this now can be represented using the decimal number of 265 (256 + 8 + 1), which in binary form looks like 10001001. Basically, each of the nine 1/0 bits stores if the human player has made a move in a cell.
I use the following [Player 1 Positions] calculated measure to first determine the decimal (Base10) value by checking the state of all nine slicers.
Player 1 Positions =
    IF(SELECTEDVALUE('R1'[Value])=1,1,0) +
    IF(SELECTEDVALUE('R2'[Value])=1,2,0) +
    IF(SELECTEDVALUE('R3'[Value])=1,4,0) +
    IF(SELECTEDVALUE('R4'[Value])=1,8,0) +
    IF(SELECTEDVALUE('R5'[Value])=1,16,0) +
    IF(SELECTEDVALUE('R6'[Value])=1,32,0) +
    IF(SELECTEDVALUE('R7'[Value])=1,64,0) +
    IF(SELECTEDVALUE('R8'[Value])=1,128,0) +
    IF(SELECTEDVALUE('R9'[Value])=1,256,0)
The’Binary Mapping’ table can be filtered down to a single row using the above decimal value as a filter to get access to the binary representation of the number if required.
Player 1 Positions Binary =
    MINX(
        FILTER(
            'Binary Mapping',
            'Binary Mapping'[Value]=[Player 1 Positions]
            ),
        'Binary Mapping'[Binary2]
        )
The next part is to have nine visuals to show the relevant piece. This is the only aspect of the PBIX file that doesn’t use native DAX. I use an image viewer control from the marketplace to display an image stored in a physical table. I will provide more detail on how the images were imported, stored, dynamically selected using a calculated measure to eventually display the piece on the board in my next blog.
So far, I have covered the mechanism used to allow the human player to make moves in the game. Hopefully, this is pretty straightforward and shows creative usage of bookmarks, slicers and DAX calculations.
Computer Moves
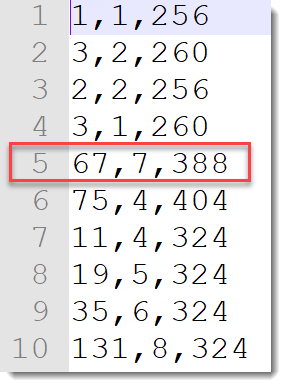
The fun begins when adding logic to allow the DAX engine to play moves. As mentioned earlier, DAX has no ability to make selections on tables. Once the human user has made a move, this causes a selection to be made on a slicer which in turn triggers any measure used in a visual to be re-calculated. There are nine measures used on the game board that determine game piece to display. The human player peices are easy to manage, as these can be determined by referencing the [Player 1 Positions] calculated measure. The next step is to look up a list of pre-played moves saved in a CSV data file that follows the following pattern.
There are three columns in total (and approximately 100 rows of pre-played moves). The first column represents the binary mapping of the human players’ moves. This is mapped to the board using the clockwise swirl pattern. The fifth row has a value in the first column of 67 which in binary is 0 + 0 + 64 + 0 + 0 + 0 + 0 + 2 + 1 (001000011).
When mapped to the gameboard mean the human player has played three pieces as follows :

The second column in the CSV file determines the square last played by the human player. In the fifth row, this value is a 7 which when mapped to the board using the clockwise swirl system represents the square in the lower right-hand side. There is a separate slicer that tracks the last move made by each player. This is to help provide some clarity on the order the pieces that have been played. This is the weakness of my approach. While I can tell that the human player has made three moves, and which of the last moves have been played, I can’t tell which order the top two pieces have been played.
The final column in the CSV file tells me where to place the computer pieces based on the information in the first two columns. The value in the fifth row is 388. In binary, this maps to 110000100 and therefore means I need to place three pieces computer pieces on the board in position 9, 8 and 3

The challenge with DAX is there is no place to proactively store dynamic information, which removes from DAX any ability to provide logic to respond progressively to pieces as they are played. The pre-played dataset is pretty good, especially with the addition of the middle column in the CSV file to control which was the last move made by the human player. Before I added this, I was hitting ambiguous game-states more often.
Building the Pre-played game dataset
So with the game logic sorted, the challenge was to generate data for the moves.csv file that contains the instructions on how to place the computer pieces based on any given known state of the human played game. I’m no data scientist and after some pretty basic maths, I decided there probably weren’t too many permutations on gameplay so I decided to build these by hand. What I had in my favour was I could ‘cheat’ by re-using game play data by rotating and flipping.
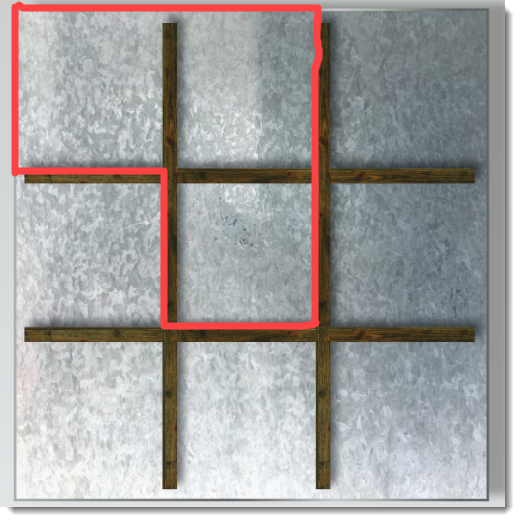
I knew I would allow the human player to make the first move each game, and there are realistically only three possible starting moves. I would only write data to assume player 1 had started in either the top two right-hand squares and the centre square as highlighted. Once I had generated each permutation of response for these opening moves, I would make three copies of the dataset with each dataset being a mirror of the base set only rotated 90°, 180° and 270°. I did not need to generate copies if the opening move by the human player is in the centre square.
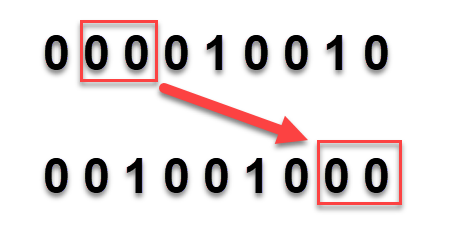
My system of mapping binary positions to squares made rotating the dataset very easy. For 90°, I could just grab two bits from the near the start of the number and move them to the end.
So in the following example, the 2nd and 3rd bits which are both 0’s are removed and placed at the end if you read left to right. The right-most bit is the center square so is always left alone.
To rotate 180°, four bits are moved and for 270° 6 bits are moved. The DAX I used to manage this is as follows:
I start with the data contained in the moves.csv which I load into the Unrotated variable. I then make multiple copies of the dataset but apply the relevant rotation rule before finally joining all the datasets back together in a UNION at the end.
Pre Played Games =
VAR Unrotated = ADDCOLUMNS('Moves',"X",1)
VAR Rotated90Deg =
SELECTCOLUMNS(
    ADDCOLUMNS(
        FILTER(moves,[Player 1] < 256),
        "P1 Rotated",
            VAR StartVal = 'moves'[Player 1]
            VAR b = MINX(FILTER('Binary Mapping','Binary Mapping'[Value]= StartVal),'Binary Mapping'[Binary2])
            VAR CenterMove=MID(b,1,1)
            VAR BinaryShift=MID(b,2,2)
            VAR bFinal = CenterMove & MID(b,4,6) & BinaryShift
            RETURN MINX(FILTER('Binary Mapping','Binary Mapping'[Binary2] = bFinal),'Binary Mapping'[Value])
            ,
        "LM Rotated",VAR x = 'moves'[Last Move] RETURN SWITCH(TRUE(),x<7,x+2,x<9,x-6,x),

        "P2 Rotated",
            VAR StartVal = 'moves'[Player 2]
            VAR b = MINX(FILTER('Binary Mapping','Binary Mapping'[Value]= StartVal),'Binary Mapping'[Binary2])
            VAR CenterMove=MID(b,1,1)
            VAR BinaryShift=MID(b,2,2)
            VAR bFinal = CenterMove & MID(b,4,6) & BinaryShift
            RETURN MINX(FILTER('Binary Mapping','Binary Mapping'[Binary2] = bFinal),'Binary Mapping'[Value])
            ),
        "P1 Player",[P1 Rotated] ,
        "Last Move",[LM Rotated],
        "P2 Player",[P2 Rotated] ,
        "X",2
          )

VAR Rotated180Deg =
SELECTCOLUMNS(
    ADDCOLUMNS(
        FILTER(moves,[Player 1] < 256),
        "P1 Rotated",
            VAR StartVal = 'moves'[Player 1]
            VAR b = MINX(FILTER('Binary Mapping','Binary Mapping'[Value]= StartVal),'Binary Mapping'[Binary2])
            VAR CenterMove=MID(b,1,1)
            VAR BinaryShift=MID(b,2,4)
            VAR bFinal = CenterMove & MID(b,6,4) & BinaryShift
            RETURN MINX(FILTER('Binary Mapping','Binary Mapping'[Binary2] = bFinal),'Binary Mapping'[Value])
            ,
        "LM Rotated",VAR x = 'moves'[Last Move] RETURN SWITCH(TRUE(),x<5,x+4,x<9,x-4,x),

        "P2 Rotated",
            VAR StartVal = 'moves'[Player 2]
            VAR b = MINX(FILTER('Binary Mapping','Binary Mapping'[Value]= StartVal),'Binary Mapping'[Binary2])
            VAR CenterMove=MID(b,1,1)
            VAR BinaryShift=MID(b,2,4)
            VAR bFinal = CenterMove & MID(b,6,4) & BinaryShift
            RETURN MINX(FILTER('Binary Mapping','Binary Mapping'[Binary2] = bFinal),'Binary Mapping'[Value])
            )  ,
        "P1 Player",[P1 Rotated] ,
        "Last Move",[LM Rotated],
        "P2 Player",[P2 Rotated],
        "X",3
          )
VAR Rotated2700Deg =
SELECTCOLUMNS(
    ADDCOLUMNS(
        FILTER(moves,[Player 1] < 256),
        "P1 Rotated",
            VAR StartVal = 'moves'[Player 1]
            VAR b = MINX(FILTER('Binary Mapping','Binary Mapping'[Value]= StartVal),'Binary Mapping'[Binary2])
            VAR CenterMove=MID(b,1,1)
            VAR BinaryShift=MID(b,2,6)
            VAR bFinal = CenterMove & MID(b,8,2) & BinaryShift
            RETURN MINX(FILTER('Binary Mapping','Binary Mapping'[Binary2] = bFinal),'Binary Mapping'[Value])
            ,
        "LM Rotated",VAR x = 'moves'[Last Move] RETURN SWITCH(TRUE(),x<3,x+6,x<9,x-2,x),
        "P2 Rotated",
            VAR StartVal = 'moves'[Player 2]
            VAR b = MINX(FILTER('Binary Mapping','Binary Mapping'[Value]= StartVal),'Binary Mapping'[Binary2])
            VAR CenterMove=MID(b,1,1)
            VAR BinaryShift=MID(b,2,6)
            VAR bFinal = CenterMove & MID(b,8,2) & BinaryShift
            RETURN MINX(FILTER('Binary Mapping','Binary Mapping'[Binary2] = bFinal),'Binary Mapping'[Value])
            )  ,
        "P1 Player",[P1 Rotated] ,
        "Last Move",[LM Rotated],
        "P2 Player",[P2 Rotated],
        "X",4
          )

VAR Flipped =
SELECTCOLUMNS(
    ADDCOLUMNS(
        FILTER(moves,[Player 1] >= 256),
        "P1 Rotated",
            VAR StartVal = 'moves'[Player 1]
            VAR b = MINX(FILTER('Binary Mapping','Binary Mapping'[Value]= StartVal),'Binary Mapping'[Binary2])
            VAR Bit1=MID(b,9,1)
            VAR Bit2=MID(b,8,1)
            VAR Bit3=MID(b,7,1)
            VAR Bit4=MID(b,6,1)
            VAR Bit5=MID(b,5,1)
            VAR Bit6=MID(b,4,1)
            VAR Bit7=MID(b,3,1)
            VAR Bit8=MID(b,2,1)
            VAR Bit9=MID(b,1,1)
            VAR bFinal= Bit9 & Bit2 & Bit3 & Bit4 & Bit5 & Bit6 & Bit7 & Bit8 & Bit1 // Swap bits 2 with 8, 3 with 7 and 4 with 6
            RETURN MINX(FILTER('Binary Mapping','Binary Mapping'[Binary2] = bFinal),'Binary Mapping'[Value])
            ,
        "LM Rotated",
        	VAR x = 'moves'[Last Move]
        	RETURN
        		SWITCH(
        			TRUE(),
        			x=4,6,
        			x=3,7,
        			x=2,8,
        			x=6,4,
        			x=7,3,
        			x=8,2,
        			x),
        "P2 Rotated",
            VAR StartVal = 'moves'[Player 2]
            VAR b = MINX(FILTER('Binary Mapping','Binary Mapping'[Value]= StartVal),'Binary Mapping'[Binary2])
            VAR Bit1=MID(b,9,1)
            VAR Bit2=MID(b,8,1)
            VAR Bit3=MID(b,7,1)
            VAR Bit4=MID(b,6,1)
            VAR Bit5=MID(b,5,1)
            VAR Bit6=MID(b,4,1)
            VAR Bit7=MID(b,3,1)
            VAR Bit8=MID(b,2,1)
            VAR Bit9=MID(b,1,1)
            VAR bFinal= Bit9 & Bit2 & Bit3 & Bit4 & Bit5 & Bit6 & Bit7 & Bit8 & Bit1 // Swap bits 2 with 8, 3 with 7 and 4 with 6
            RETURN MINX(FILTER('Binary Mapping','Binary Mapping'[Binary2] = bFinal),'Binary Mapping'[Value])
            )  ,
        "P1 Player",[P1 Rotated] ,
        "Last Move",[LM Rotated],
        "P2 Player",[P2 Rotated],
        "X",5
          )


RETURN
UNION(
	Unrotated,Rotated90Deg,Rotated180Deg,Rotated2700Deg,Flipped)
The calculation also includes code to generate a flipped set of the code based on a diagonal mirror from top left to bottom right. In this case, I swap bits 8 and 2, 7 and 3, 4 and 6, to give an extra set of pre-played combinations.
Once these have been applied, my 148 manually created states become 476 scenarios that can be used to place the computer peices depending on what the human player has done. 95% of the time, this plays out nicely and makes it look like the computer is responding to the human as pieces are played. In reality, like me, DAX forgets things easily and computations can only use current selections and can’t look back to help guide any output.
I quite like the simplicity of the bitwise approach to mapping – and it certainly made multiplying the game permutations an easier job. It’s not perfect and I have made sure there are scenarios where the human can win the game.
Images
The images used for game pieces were stored as png files in a local folder (c:\x). I used the folder data source to import the files and converted the binary column to text. I then strip out unused columns and prefix the converted text with the magic “data:image/png;base64, ” string, which seems to be enough to allow some Power BI Visuals to display images. Full credit to this blog post for the original idea.
let
    Source = Folder.Files("c:\x"),
    #"Changed Type" = Table.TransformColumnTypes(Source,{{"Content", type text}}),
    #"Removed Other Columns" = Table.SelectColumns(#"Changed Type",{"Content", "Name"}),
    #"Added Prefix" = Table.TransformColumns(#"Removed Other Columns", {{"Content", each "data:image/png;base64, " & _, type text}}),
    #"Extracted First Characters" = Table.TransformColumns(#"Added Prefix", {{"Name", each Text.Start(_, 2), type text}}),
    #"Inserted Last Characters" = Table.AddColumn(#"Extracted First Characters", "Last Characters", each Text.End([Name], 1), type text),
    #"Filtered Rows" = Table.SelectRows(#"Inserted Last Characters", each ([Last Characters] = "4")),
    #"Extracted First Characters1" = Table.TransformColumns(#"Filtered Rows", {{"Name", each Text.Start(_, 1), type text}})
in
    #"Extracted First Characters1"
Then with a little DAX magic, using disconnected tables and making 9 copies of the table of images imported using Power Query. The tables are named P1 through P9 and each contains a calculated measure which is used as a visual filter to determine which, if any, image should be used.
P1 Filter = IF([M 1]=MIN('P1'[Name]),1,0)
This part of the game was the only departure from using 100% native Power BI. I needed to use a custom visual to display the images to get it to look the way I want.
There is a fair amount to take in, and I would love to see your comments. I will probably convert this to a presentation that might be interesting enough to deliver in a webinar as part of the Power BI series.


Oops a little bug is introduced.
If I take the first step and click somewhere on the board, the computer takes the next step afterwards. But when I click on the same spot as the computer did, the bug is introduced. The computer stops playing and I will always win.
But beside of that respect for what you did! Nice job!
Doing things like this is frivolous, fun and necessary. What better way to push your creativity and push the limits of what is possible with the Power BI platform.
Definitely in the vein of the “BI Power Hour” presentations at SQL PASS in years past.