
I have explained previously what fuzzy matching in Power BI is and how to use it. In this article and video, I’ll explain Fuzzy grouping. Fuzzy grouping in short means grouping text values by their similarity based on a threshold, rather than exact equal values. This option at the moment is available in Power Query online (dataflow), but it will be available soon in Power Query in Power BI Desktop or Excel too.
Video
Sample input and requirement
Let’s say we have a table like below;
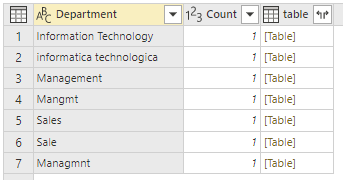
“source” table which is the data of employees and their departments. Notice that the Department field has data quality issues. we have department values such as “Sales”, and “Sale”. Or another example is “Managmnt” and “Management”.

If the requirement is to group items based on the Department field. However, because every value in the Department column is different, we will have seven groups as the result;
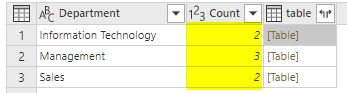
Our requirement is to have similar items grouped together. We want an output like this:
We do not have a mapping table that tells us “Managmnt” means “Management”.
This is something that can be done using Fuzzy Grouping.
Power Query Online
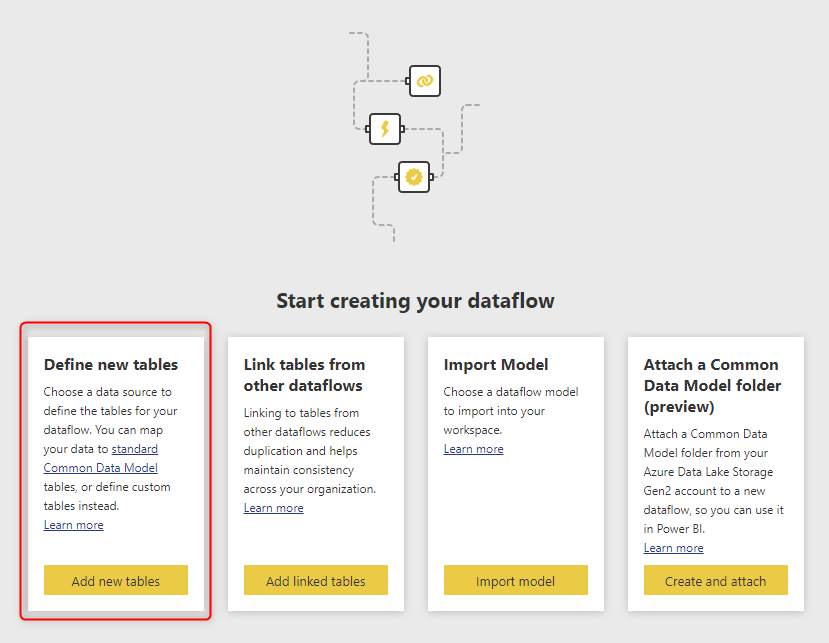
At the time of writing this article, this option is only available in Power Query online. It surely will be available in other Power Query options on desktop such as Power BI Desktop and Excel in the future. But if you want to try it and online is the only option, it means you need to create a new dataflow inside an organizational workspace for it;
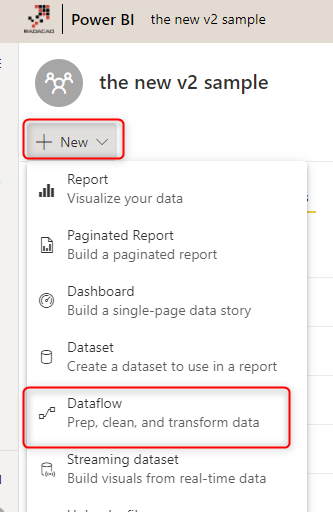
Once you created a dataflow, you can use the add new table
This would get you to the Get Data experience to connect to any data sources you want.
Fuzzy Grouping
Performing fuzzy grouping is very similar to the normal grouping in Power Query. You have to choose Group By on the column(s) you want.
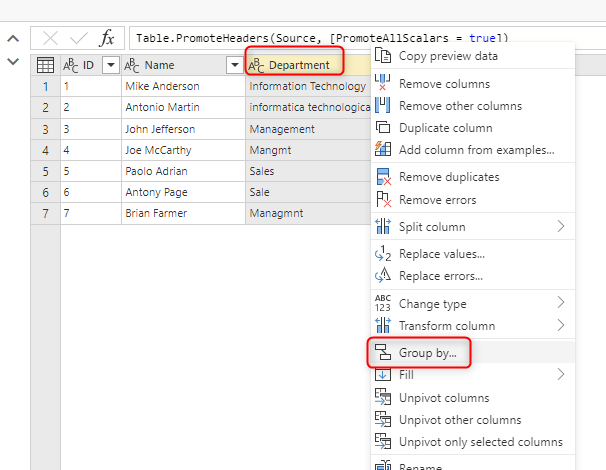
In the Group-by window, you will see the “Use Fuzzy Grouping” option.
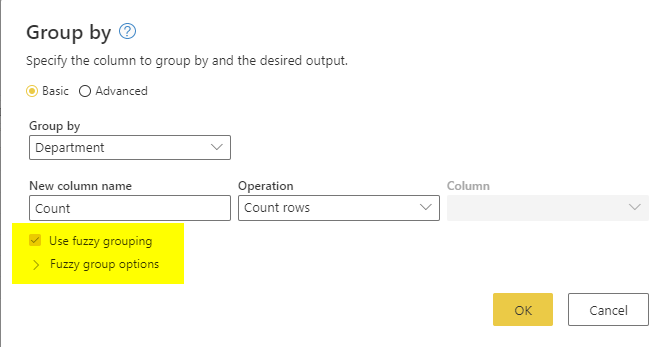
Enabling the fuzzy grouping will result in the grouping as below;
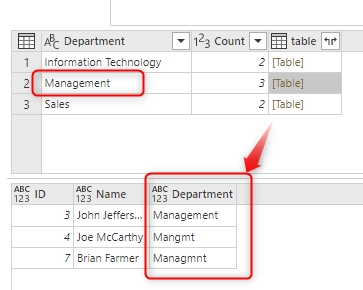
As you can see, in the above screenshot, the three values of “Management”, “Mangmt”, and “Managmnt” are all grouped into one.
Similarity Algorithm
This is possible because Fuzzy grouping uses an algorithm to find the similarity threshold of text values. The algorithm is based on Jaccard Index, which is explained here.
Performance Aspect
Be careful whenever you use Fuzzy Merge or Fuzzy Grouping. Any fuzzy operation on the dataset will bring a huge performance impact to the data processing. The reason is that every text value has to be compared with every other text value in the table, the similarity threshold of the two has to be calculated (based on the algorithm above), and then if passes the similarity threshold merge into a group. This process is a very time-consuming process. Especially with more rows in the data table, you will feel it much more.
My suggestion is to first perform normal grouping on the items that match and then for the non-matching items perform the fuzzy operation.
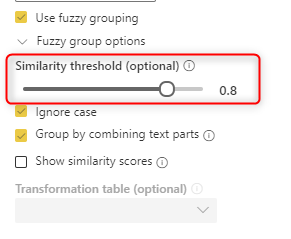
Fuzzy Grouping Options
The default threshold for Fuzzy Grouping is 0.8, which means 80% similarity.
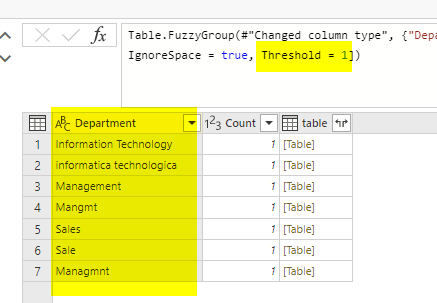
You can change the options such as Ignore case, or Similarity threshold. For example, if I change the similarity threshold to 1, It means 100% matching, this will result in seven groups.
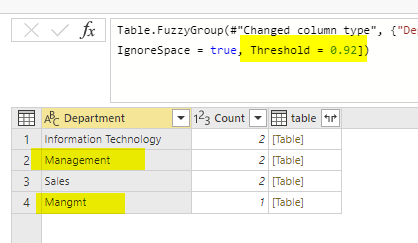
The lower the similarity threshold the more matching of non-similar values. For example, 0.92 similarity threshold will give me the below
If you want to set other settings for the Fuzzy Grouping here is what they mean;
| Option | Acceptable Value | Description |
| Threshold | a value between 0.00 to 1.00 | if the similarity of the two text values is more than the threshold it will be considered as a successful match. Value 1.00 means exact match. |
| Ignore Case | true/false | If you want the similarity algorithm to work regardless of the upper or lower case letters, then select this option. |
| Group by combining text parts | true/false | If you want the similarity algorithm to work regardless of the number of spaces in the text, then select this option. |
| Transformation Table | table | This is like a mapping table, let’s check it out a bit later in this post. It gives you the option to use your own mapping table. This table should have at least two columns of “To” and “From”. |
Power Query Functions
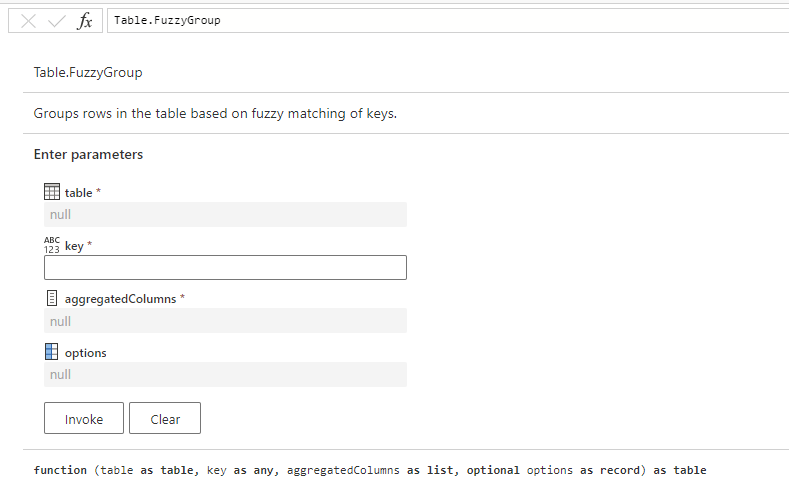
In addition to the option added in the graphical interface of Power Query, we also have a Power Query Function that does the Fuzzy Grouping:
Table.FuzzyGroup
If you use these two functions directly in the M script, you will have some parameters to set;
Transformation Table
Sometimes in the merge operation, you need a mapping table. This table is called here a Transformation Table. Here is an example of a mapping table:

Note that this table should have at least the two-column of “To”, and “From”. And don’t forget that Power Query is case-sensitive!
Now you can select this table in your Merge operation in the Fuzzy configuration as below;

This process is like merging the “source” table, which is the first table in our Merge, with the “Department” table based on the “Department” and then “Department Name” column, then merging it with the “mapping” table, based on the “To” column and “Department Name”. The output will bring the “To” column of the mapping table. Here is the sample output:

Summary
Fuzzy Grouping is a very helpful option if you are dealing with dirty data. Fuzzy grouping is easy to apply, however, it comes with a performance cost. Ideally, you have to make sure the data comes clean before doing the transformation. Which means applying the right process to get the clean data. However, sometimes when you need the transformation, you can use it. In this article and video, you learned about that. I strongly recommend you to read the two other articles below too:
- Fuzzy Matching in Power BI and Power Query; Match based on Similarity Threshold
- Grouping in Power Query; Getting The Last Item in Each Group


Reza is author of more than 14 books on Microsoft Business Intelligence, most of these books are published under Power BI category. Among these are books such as Power BI DAX Simplified, Pro Power BI Architecture, Power BI from Rookie to Rock Star, Power Query books series, Row-Level Security in Power BI and etc.
He is an International Speaker in Microsoft Ignite, Microsoft Business Applications Summit, Data Insight Summit, PASS Summit, SQL Saturday and SQL user groups. And He is a Microsoft Certified Trainer.
Reza’s passion is to help you find the best data solution, he is Data enthusiast.
His articles on different aspects of technologies, especially on MS BI, can be found on his blog: https://radacad.com/blog.