

A common requirement when reporting data with a Date axis is to be able to see the year and the month in a short form beside each other. Formats such as 2021 Jan, or Jan 2021, or even Jan 21, or 2021-01 are very popular. In Power BI, ideally, you should have a Date dimension with columns for this. However, if you don’t I’ll explain how you can create these formats easily using DAX.
Video
Sample table
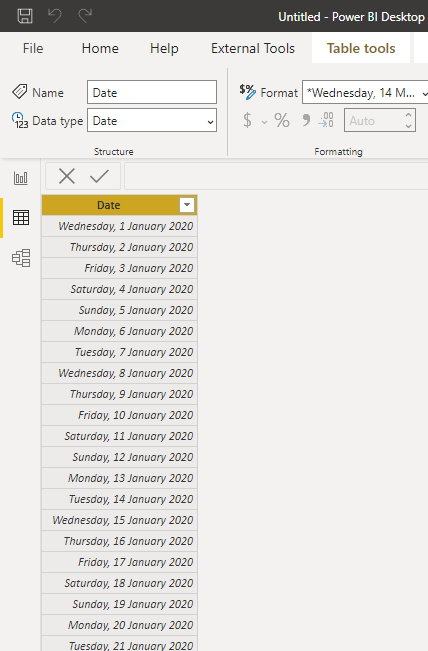
My sample table just have a single column; Date as below;
Label column
If you are going to use the month NAME as part of the year-month combination, then you will need a label column and a code column. The label column is used to show the year-month combination in the visual, and the code column to sort the label column. let’s start with the label column;
To create a column for the year and month combined, one of the most helpful functions will be the FORMAT function. You can use the Format function like below;
Year-Month = FORMAT('Date'[Date],"YYYY MMM")
This can be a calculated column added to your table;

The output will be in the format of four digits for the year, and then a three-character month name after a space. That is because we used YYYY MMM as the format expression. You can use formats as below too;
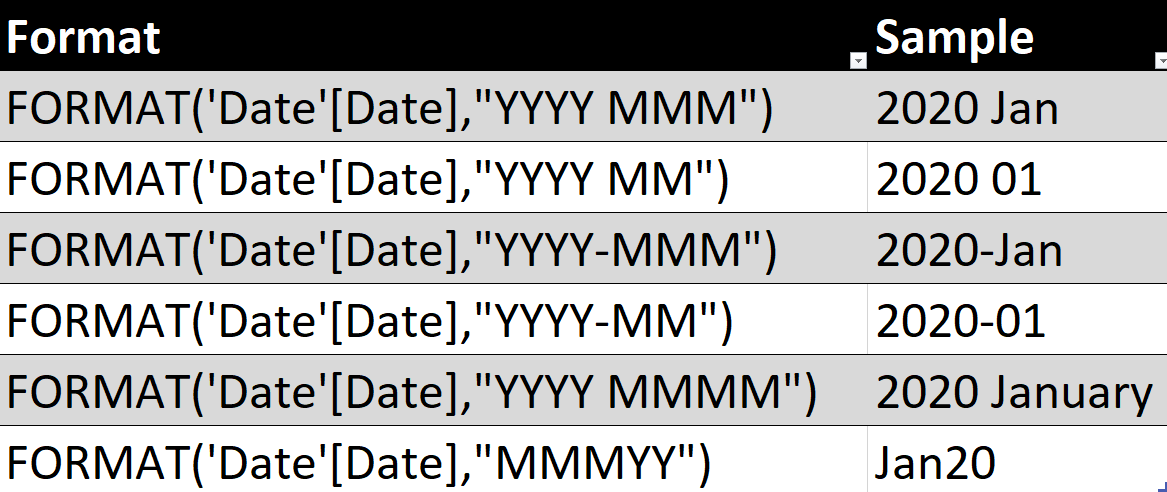
Note that the M and Y can be lowercase too. Here is what they mean;
| Character | Details | Sample |
|---|---|---|
| MMMM | full month name | January |
| MMM | three-characters month name | Jan |
| MM | two-digit month number | 01 |
| M | One or two-digits month number (no leading zero) | 1 |
| YYYY | 4-digit year number | 2020 |
| YY | 2-digit year number | 20 |
Code column
This column above by itself usually isn’t enough, as the order of items might not be the right order if you used a format that produces the month name instead of the number. You would need a column that is The Year-Month code and you can use that to sort the Year-Month column.
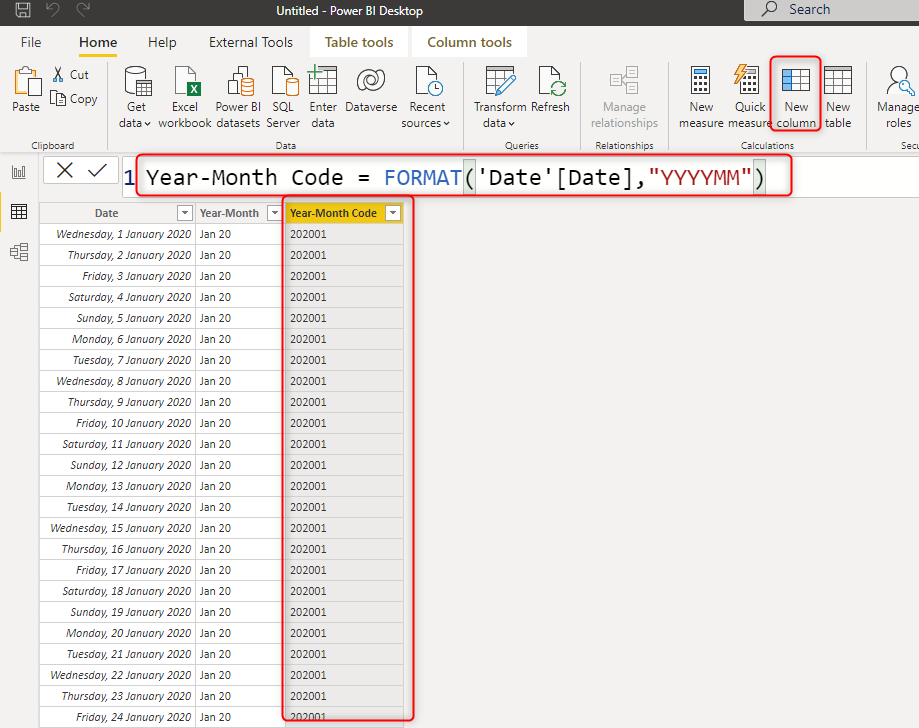
This code generates a six-digit text for year and month combined which will be always in the right order if converted to a number;
Year-Month Code = FORMAT('Date'[Date],"YYYYMM")
Sort by Column
It doesn’t matter what format you used for the label column, the code column can sort it, by using the Sort by Column option. I explained more about this feature here in this article.
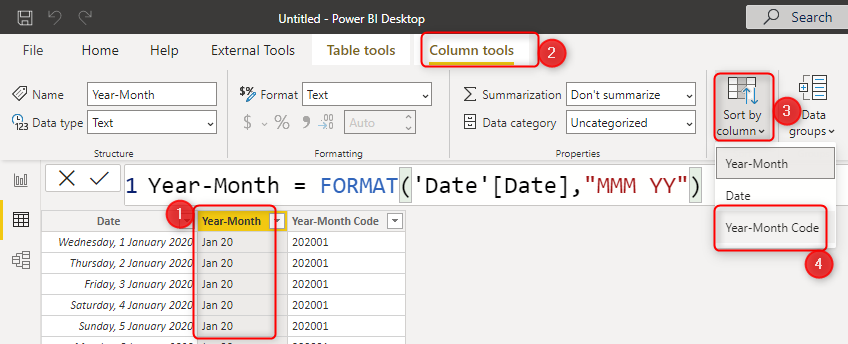
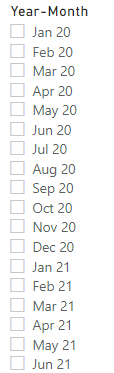
And this gives me the right ordered list of year-month values as below in any visual;
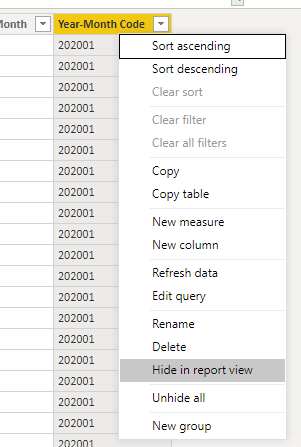
Hide the code column
Note that, it is recommended to hide the Year-Month code column from the report view. To learn more about what columns are a good candidate to be hidden read my article here.
Date Dimension
I strongly suggest using a Date dimension (or calendar table) including all the columns for slicing and dicing by date-related attributes. A full script of a date dimension is available here in this article for you available to download;


Reza is author of more than 14 books on Microsoft Business Intelligence, most of these books are published under Power BI category. Among these are books such as Power BI DAX Simplified, Pro Power BI Architecture, Power BI from Rookie to Rock Star, Power Query books series, Row-Level Security in Power BI and etc.
He is an International Speaker in Microsoft Ignite, Microsoft Business Applications Summit, Data Insight Summit, PASS Summit, SQL Saturday and SQL user groups. And He is a Microsoft Certified Trainer.
Reza’s passion is to help you find the best data solution, he is Data enthusiast.
His articles on different aspects of technologies, especially on MS BI, can be found on his blog: https://radacad.com/blog.
Thanks for this awesome solution – easy to set up
Thank you, that was easy to follow and solved my problem.
Thanks. I am glad it helped.
This is amazing, thanks for sharing
Thanks. I am glad to help
Thank you so much. Best Solution!